. 2018 Sep 15;58(9):384-392.
doi: 10.2176/nmc.oa.2018-0054. Epub 2018 Aug 3.

Metabolomic Analysis of Mouse Brain after a Transient Middle Cerebral Artery Occlusion by Mass Spectrometry Imaging

Affiliations

Metabolomic Analysis of Mouse Brain after a Transient Middle Cerebral Artery Occlusion by Mass Spectrometry Imaging

Takatsugu Abe et al. Neurol Med Chir (Tokyo). .

Abstract

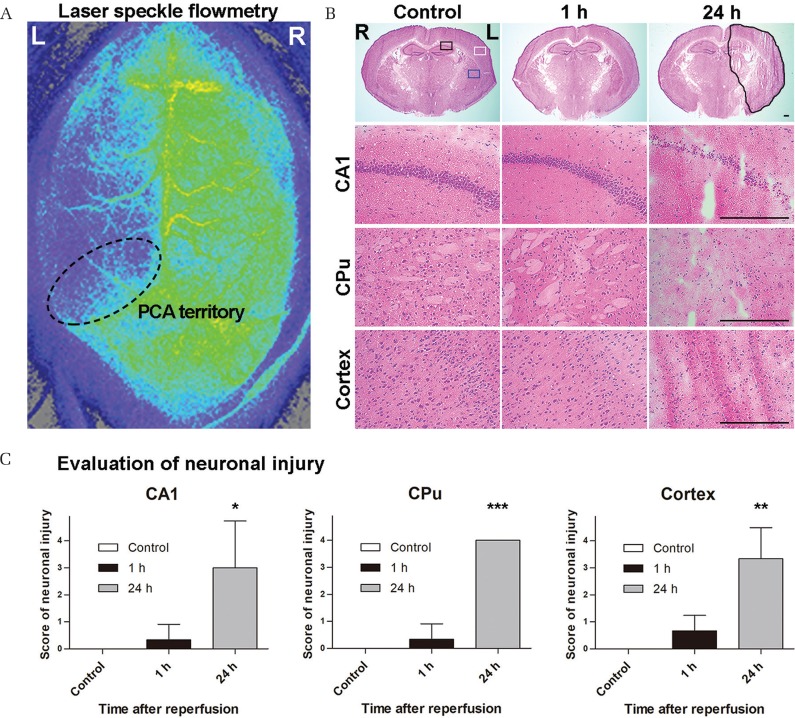
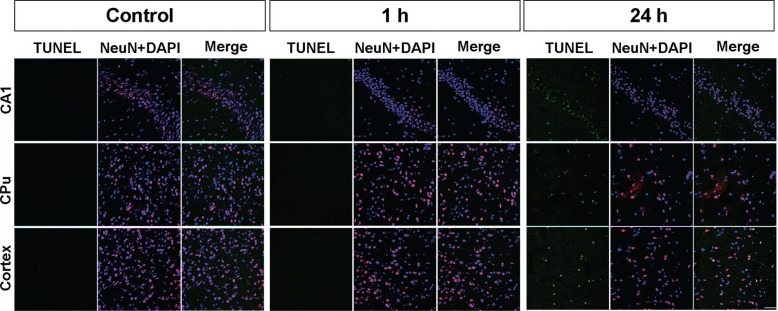
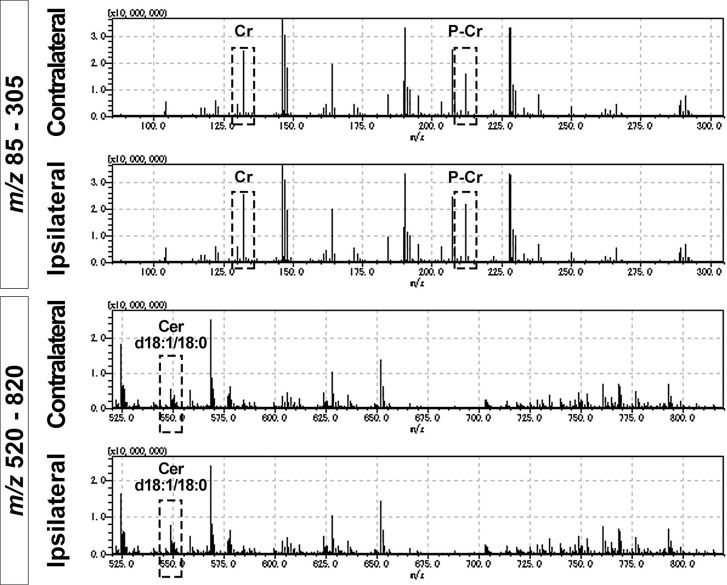
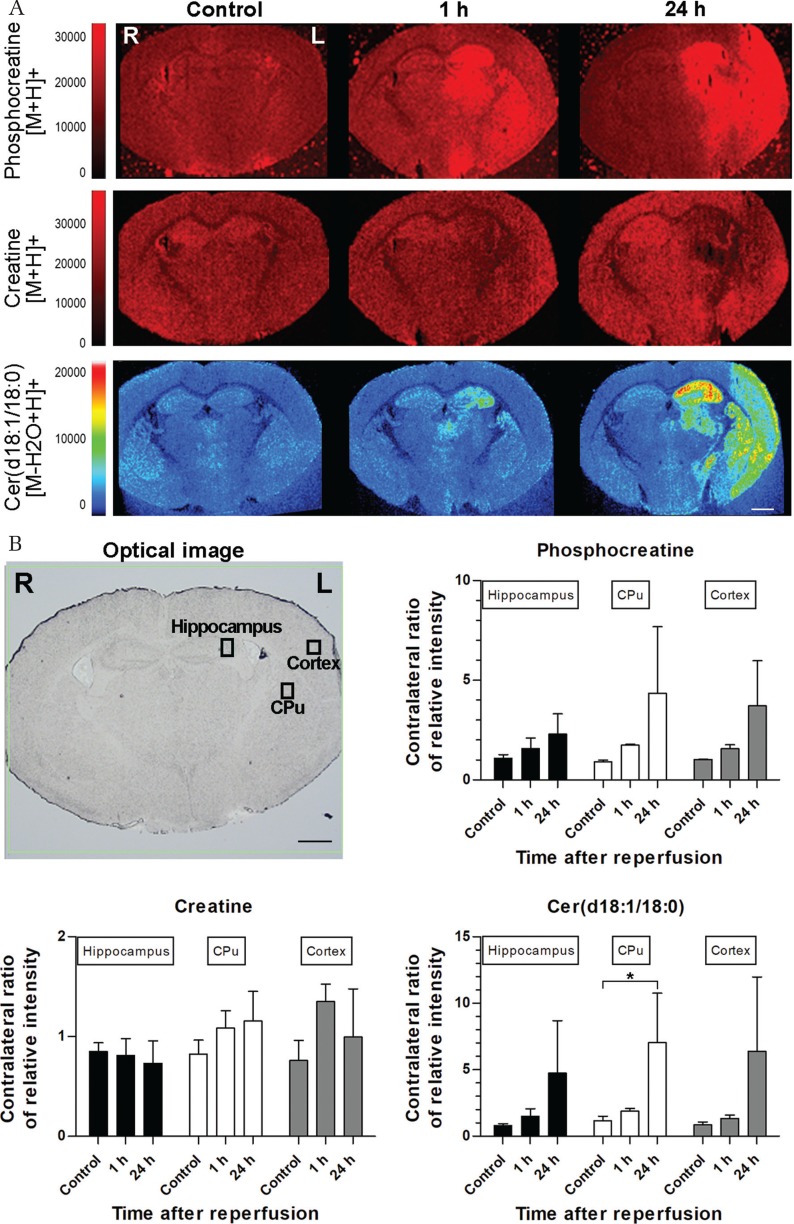
We performed metabolomic analyses of mouse brain using a transient middle cerebral artery occlusion (tMCAO) model with Matrix Assisted Laser Desorption/Ionization (MALDI)-mass spectrometry imaging (MSI) to reveal metabolite changes after cerebral ischemia. We selected and analyzed three metabolites, namely creatine (Cr), phosphocreatine (P-Cr), and ceramides (Cer), because these metabolites contribute to cell life and death. Eight-week-old male C57BL/6J mice were subjected to tMCAO via the intraluminal blockade of the middle cerebral artery (MCA) and reperfusion 60 min after the induction of ischemia. Each mouse was randomly assigned to one of the three groups; the groups were defined by the survival period after reperfusion: control, 1 h, and 24 h. Corrected samples were analyzed using MALDI-MSI. Results of MSI analysis showed the presence of several ionized substances and revealed spatial changes in some metabolites identified as precise substances, including Cr, P-Cr, Cer d18:1/18:0, phosphatidylcholine, L-glutamine, and L-histidine. Cr, P-Cr, and Cer d18:1/18:0 were changed after tMCAO, and P-Cr and Cer d18:1/18:0 accumulated over time in ischemic cores and surrounding areas following ischemia onset. The upregulation of P-Cr and Cer d18:1/18:0 was detected 1 h after tMCAO when no changes were evident on hematoxylin and eosin staining and immunofluorescence assay. P-Cr and Cer d18:1/18:0 can serve as neuroprotective therapies because they are biomarker candidates for cerebral ischemia.

Keywords: ceramide; cerebral ischemia; mass spectrometry imaging; metabolomic analysis; phosphocreatine.


Conflict of interest statement

Conflicts of Interest Disclosure

The authors have no conflicts of interest to disclose.

Figures

Fig. 1.
Fig. 1.
Assessment of the ischemic area after transient middle cerebral artery occlusion (tMCAO). (A) Laser speckle flowmetry shows signal attenuation in the perfusion area of the middle and posterior cerebral arteries, indicating decreased cerebral blood flow in the tMCAO model. (B) Hematoxylin and eosin staining over time after tMCAO. Hippocampal CA1 (CA1), caudoputamen (CPu), and cerebral cortex (Cortex) are presented as black, blue, and white square regions, respectively. The black free line region indicates an area of infarction with neuronal cell loss and tissue damage. One hour after tMCAO, no obvious changes are observed compared with controls. However, neural cells of the CA1, CPu, and cerebral cortex are decreased 24 h after tMCAO. These sections are 1.80-mm posterior to the bregma. The scale bars are 300 μm. (C) These graphs show the score of neuronal injury in the hippocampal CA1, CPu, and the cerebral cortex on the scales of 0–4. All lesions exhibited significant neuronal cell damage 24 h after tMCAO. *P < 0.05, **P < 0.01, and ***P < 0.001 (N = 3 each).
Fig. 2.
Fig. 2.
Histological change after transient middle cerebral artery occlusion (tMCAO). Double immunofluorescence of the TUNEL staining (green) and NeuN (red) with DAPI (blue) 1 and 24 h after tMCAO. TUNEL-positive cells are scattered and NeuN-positive cells are decreased in the CA1, caudoputamen, and cerebral cortex area of a 24 h section. The soma of NeuN-positive cells appears shrunken in CA1. These findings are not seen in the 1 h section. The scale bar is 50 μm.
Fig. 3.
Fig. 3.
Mass spectrum of mass spectrometry imaging (MSI) These graphs show four mass spectra of the ischemic and contralateral hemispheres 24 h after transient middle cerebral artery occlusion under different m/z scales from 85–305 and 520–820. These scan areas encompass almost entire hemispheres. MSI detects several ions within a brain section, but most of them are not identified as precise substances. Dotted squares indicate creatine (Cr) (m/z 132.08), phosphocreatine (P-Cr) (m/z 212.03), and ceramide (Cer) d18:1/18:0 (m/z 548.54). The relative intensities of P-Cr and Cer d18:1/18:0 are remarkably different between the ipsilateral and contralateral areas, but Cr exhibited no such difference.
Fig. 4.
Fig. 4.
Mass spectrometry imaging (MSI) at different time points (A). Time course MSI analysis of phosphocreatine (P-Cr), creatine (Cr), and ceramide (Cer) d18:1/18:0 after transient middle cerebral artery occlusion (tMCAO) at 1.80 mm posterior to the bregma. In the control brain, P-Cr expression is low throughout the entire brain. Cr expression is higher than P-Cr and is stronger in the hippocampus. One hour after tMCAO, P-Cr expression is upregulated in the hippocampus, caudoputamen (CPu), and cerebral cortex of the ischemic hemisphere. In contrast, Cr expression is downregulated in the hippocampus and CPu of the ischemic hemisphere. Cer d18:1/18:0 expression is upregulated in the hippocampus. After 24 h, tMCAO, P-Cr, and Cer d18:1/18:0 expressions are increase in the hippocampus, CPu, and ischemic cortex. Cr expression is slightly upregulated throughout the entire brain, with the exception of the ischemic area, which shows an obvious downregulation of Cr. (B) The relative intensities were measured at three regions of interests presented in the optical image and contralateral sides. These graphs indicate the contralateral ratio of relative intensity. P-Cr and Cer d18:1/18:0 expressions increase over time, but Cr expression exhibits no such tendency. *P < 0.05. Each group included three samples. The scale bars are 1000 μm.

References

    1. Irie M, Fujimura Y, Yamato M, Miura D, Wariishi H: Integrated MALDI-MS imaging and LC-MS techniques for visualizing spatiotemporal metabolomic dynamics in a rat stroke model. Metabolomics 10: 473–483, 2014 - PMC - PubMed
    1. Mulder IA, Esteve C, Wermer MJ, et al. : Funnel-freezing versus heat-stabilization for the visualization of metabolites by mass spectrometry imaging in a mouse stroke model. Proteomics 16: 1652–1659, 2016 - PubMed
    1. Pohjanen E, Thysell E, Jonsson P, et al. : A multivariate screening strategy for investigating metabolic effects of strenuous physical exercise in human serum. J Proteome Res 6: 2113–2120, 2007 - PubMed
    1. Werner E, Croixmarie V, Umbdenstock T, et al. : Mass spectrometry-based metabolomics: accelerating the characterization of discriminating signals by combining statistical correlations and ultrahigh resolution. Anal Chem 80: 4918–4932, 2008 - PubMed
    1. Stoeckli M, Chaurand P, Hallahan DE, Caprioli RM: Imaging mass spectrometry: a new technology for the analysis of protein expression in mammalian tissues. Nat Med 7: 493–496, 2001 - PubMed