. 2018 Jul 20:9:1625.
doi: 10.3389/fimmu.2018.01625. eCollection 2018.

Expanded Regulatory T Cells Induce Alternatively Activated Monocytes With a Reduced Capacity to Expand T Helper-17 Cells

Affiliations

Expanded Regulatory T Cells Induce Alternatively Activated Monocytes With a Reduced Capacity to Expand T Helper-17 Cells

Marco Romano et al. Front Immunol. .

Abstract

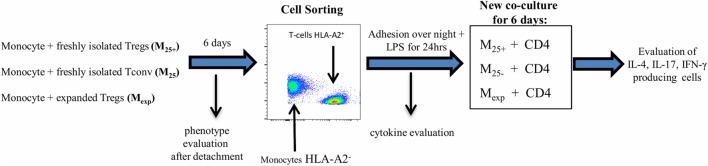
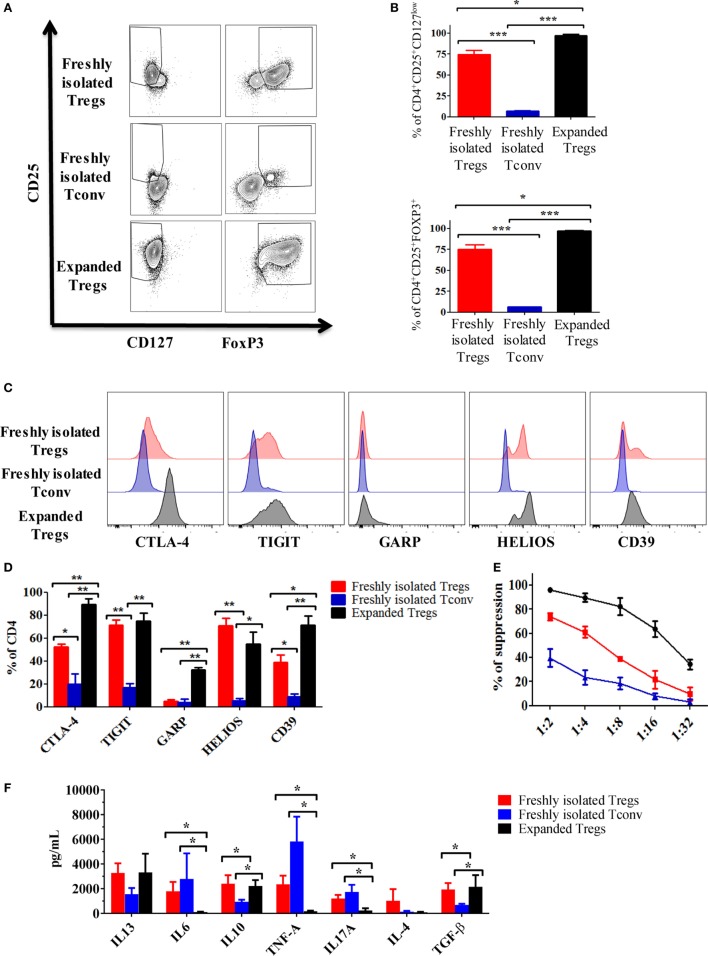
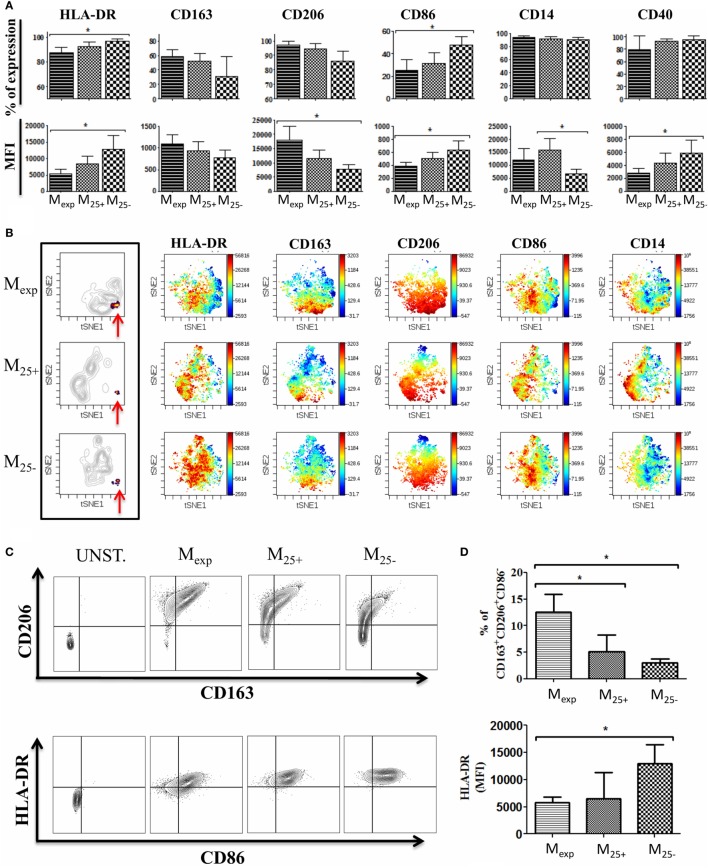
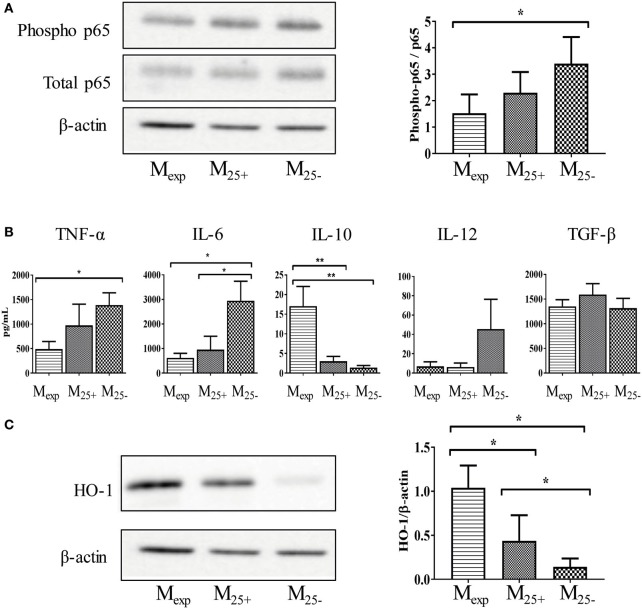
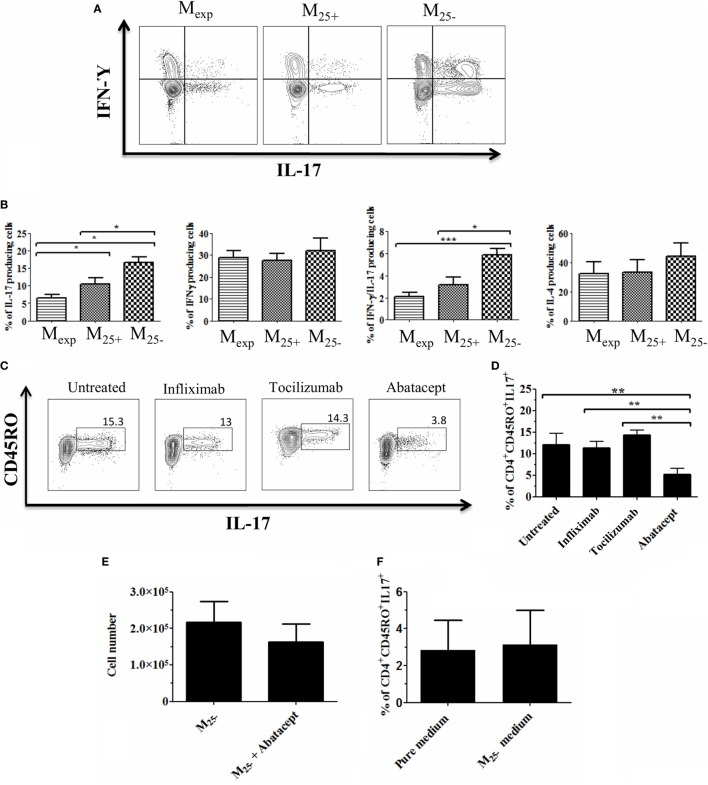
Regulatory T cells (Tregs) are essential in maintaining peripheral immunological tolerance by modulating several subsets of the immune system including monocytes. Under inflammatory conditions, monocytes migrate into the tissues, where they differentiate into dendritic cells or tissue-resident macrophages. As a result of their context-dependent plasticity, monocytes have been implicated in the development/progression of graft-vs-host disease (GvHD), autoimmune diseases and allograft rejection. In the last decade, Tregs have been exploited for their use in cell therapy with the aim to induce tolerance after solid organ transplantation and for the treatment of autoimmune diseases and GvHD. To date, safety and feasibility of Treg infusion has been demonstrated; however, many questions of how these cells induce tolerance have been raised and need to be answered. As monocytes constitute the major cellular component in inflamed tissues, we have developed an in vitro model to test how Tregs modulate their phenotype and function. We demonstrated that expanded Tregs can drive monocytes toward an alternatively activated state more efficiently than freshly isolated Tregs. The effect of expanded Tregs on monocytes led to a reduced production of pro-inflammatory cytokines (IL-6 and tumor necrosis factor-α) and NF-κB activation. Furthermore, monocytes co-cultured with expanded Tregs downregulated the expression of co-stimulatory and MHC-class II molecules with a concomitant upregulation of M2 macrophage specific markers, CD206, heme oxygenase-1, and increased interleukin-10 production. Importantly, monocytes co-cultured with expanded Tregs showed a reduced capacity to expand IL-17-producing T cells compared with monocyte cultured with freshly isolated Tregs and conventional T cells. The capacity to decrease the expansion of pro-inflammatory Th-17 was not cytokine mediated but the consequence of their lower expression of the co-stimulatory molecule CD86. Our data suggest that expanded Tregs have the capacity to induce phenotypical and functional changes in monocytes that might be crucial for tolerance induction in transplantation and the prevention/treatment of GvHD and autoimmune diseases.

Keywords: alternatively activated macrophages; cell therapy; immunoregulation; monocytes; regulatory T cells.


Figures

Figure 1
Figure 1
Experimental protocol. Co-culture experiments have been settled in 48-well plates pre-coated with anti-CD3 monoclonal antibody (50 ng/mL). 0.5 × 106 monocytes (HLA-A2) have been cultured in the presence of 0.25 × 106 T cells (HLA-A2+) for 6 days. The resultant monocyte populations have been identified as M25+ [monocytes co-cultured with freshly isolated CD4+CD25+ regulatory T cells (Tregs)], M25− [monocytes co-cultured with freshly isolated CD4+CD25 conventional T cell (Tconv)], and Mexp (monocytes co-cultured with expanded Tregs). Cells were then detached and labeled with Live/Dead dying and HLA-A2 antibody for cell sorting following the gate strategy reported in Figure S1 in Supplementary Material. At the same time, the expression of CD86, CD14, CD80 CD40, CD206, CD163, and HLA-DR has been evaluated by flow cytometry. After sorting, 150 × 105 cells have been lysed for WB analysis and 50 × 103 cells per condition were placed in a new 48-well plate and left at 37°C overnight to ensure complete adhesion. Adhering cells have been stimulated with LPS for 24 h and then co-cultured, for other 6 days, with allogeneic CD4 T cells (105 per condition, HLA-A2+ coming from the same donor of the Tconv/Treg) in presence of soluble anti-CD3 (50 ng/mL). Intracellular staining to evaluate IL-4, IL-17, and IFN-γ-producing CD4 T cells has been executed at the end of the co-culture. Supernatant after LPS stimulation (50 ng/mL) has been used for cytokine evaluation and for the experiment using the M25− conditioned medium.
Figure 2
Figure 2
Expansion of regulatory T cells (Tregs) using rapamycin increases their immunosuppressive capacity. (A) Representative dot plots showing the expression of CD25 vs FOXP3 and CD127 in expanded Tregs, freshly isolated Tregs and conventional T cell (Tconv). (B) Cumulative data of six independent experiments showing the percentages of CD4+CD25+CD127low and CD4+CD25+FOXP3+ in expanded Tregs, freshly isolated Tregs and Tconv. Representative histogram (C) and cumulative data (D) of six independent experiments showing the expression of cytotoxic T-lymphocyte antigen-4 (CTLA-4), TIGIT, GARP, HELIOS, and CD39 in expanded Tregs, freshly isolated Tregs and Tconv. Data are expressed as percentage of expression of CD4+ cells. (E) Suppressive ability at different ratios of expanded Tregs, freshly isolated Tregs and Tconv vs third party Teff. Means of six independent experiments are expressed as percentage of inhibition of the Teff proliferation. (F) Cytokine production by expanded Tregs, freshly isolated Tregs and Tconv after 3 days stimulation with anti-CD3/CD28 beads (4:1 cells to beads ratio). Data are expressed as mean of six independent experiments. In all the experiments, data are presented as mean ± SEM and analyzed using unpaired t-test with *p < 0.05, **p < 0.01, and ***p < 0.001.
Figure 3
Figure 3
Phenotype of monocytes after co-culture with T cells. (A) Expression of HLA-DR, CD86, CD14, CD206, CD163, and CD40 evaluated by flow cytometry on monocytes co-culture with expanded regulatory T cells (Tregs) (Mexp), freshly isolated Tregs (M25+), and freshly isolated conventional T cell (M25−) for 6 days. Percentages of expression (upper panels) and MFI (lower panels) of 10 independent experiments. (B) Visualization of one representative automated clustering method including t-distributed stochastic neighbor embedding (t-SNE) highlighting the unique cluster (indicated by the red arrows) in Mexp, M25+, and M25− followed by the intensity of expression of HLA-DR, CD86, CD14, CD206, and CD163. (C) Representative plots showing CD206 and CD163 expression (upper panels) and HLA-DR plus CD86 on CD206+DC163+ cells (lower panel) in unstained control, Mexp, M25+, and M25− cells. (D) Cumulative data of six independent experiments showing the percentages of CD14+CD206+CD163+CD86 in Mexp, M25+, and M25− (upper panel) and their HLA-DR expression (lower panel). In all the experiments, data, presented as mean ± SEM, were analyzed using one-way ANOVA followed by Tukey with *p < 0.05.
Figure 4
Figure 4
Mexp showed a reduced activation status compared with M25+ and M25−. (A) Representative WB showing the expression of phosphorylated and total p65 and β-actin in Mexp, M25+, and M25− (left panels); cumulative data of four independent experiments showing the ratio between phosphorylated and total p65 (right panel) in Mexp, M25+, and M25− cells. (B) Cytokine production of sorted Mexp, M25+, and M25− after LPS stimulation (50 ng/mL) for 24 h. (C) Representative WB showing the expression of β-actin and heme oxygenase-1 (HO-1) in Mexp, M25+, and M25− (left panels); cumulative data of four independent experiments showing the ratio between HO-1 and β-actin (right panel) in Mexp, M25+, and M25− cells. In all the experiments, data, presented as mean ± SEM, were analyzed using one-way ANOVA followed by Tukey with *p < 0.05, **p < 0.01. Full length-blots are presented in Figure S4 in Supplementary Material. The same representative β-actin blot is shown in panels (A,C).
Figure 5
Figure 5
Mexp reduced the generation of IL-17-producing cells due to their lower CD86 expression. (A) Representative plots showing the percentages of IL-17, IL-17/IFN-γ, and IFN-γ-producing CD4+ cells after co-culture with Mexp, M25+, and M25−. (B) Cumulative data of nine independent experiments showing the percentages of IL-17, IL-17/IFN-γ, and IFN-γ and IL-4 producing CD4+ cells. Representative plots (C) and cumulative data (D) of four independent experiments showing the percentages of memory IL-17-producing CD4+ cells after co-culture with M25− alone or in the presence of infliximab, tociluzmab, and abatacept. (E) Cell count of CD4+ cells (n = 4) co-cultured with M25− alone or in the presence of Abatacept. (F) Cumulative data of four independent experiments showing the percentages of memory IL-17-producing CD4+ stimulated with anti-CD3/28 beads in medium alone or M25− conditioned medium. In all the experiments, data, presented as mean ± SEM, were analyzed using one-way ANOVA followed by Tukey with *p < 0.05, **p < 0.01.

References

    1. Gupta S. Immune homeostasis: regulatory T cells (Treg) and molecules. J Clin Immunol (2008) 28:617–8.10.1007/s10875-008-9259-3 - DOI - PubMed
    1. Hori S, Nomura T, Sakaguchi S. Control of regulatory T cell development by the transcription factor Foxp3. Science (2003) 299:1057–61.10.1126/science.1079490 - DOI - PubMed
    1. Fontenot JD, Gavin MA, Rudensky AY. Foxp3 programs the development and function of CD4+CD25+ regulatory T cells. Nat Immunol (2003) 4:330–6.10.1038/ni904 - DOI - PubMed
    1. Toker A, Engelbert D, Garg G, Polansky JK, Floess S, Miyao T, et al. Active demethylation of the Foxp3 locus leads to the generation of stable regulatory T cells within the thymus. J Immunol (2013) 190:3180–8.10.4049/jimmunol.1203473 - DOI - PubMed
    1. Yadav M, Stephan S, Bluestone JA. Peripherally induced Tregs – role in immune homeostasis and autoimmunity. Front Immunol (2013) 4:232.10.3389/fimmu.2013.00232 - DOI - PMC - PubMed