

Chemical transport model simulations of organic aerosol in southern California: model evaluation and gasoline and diesel source contributions
- PMID: 30079083
- PMCID: PMC6070158
- DOI: 10.5194/acp-17-4305-2017
Chemical transport model simulations of organic aerosol in southern California: model evaluation and gasoline and diesel source contributions
Abstract
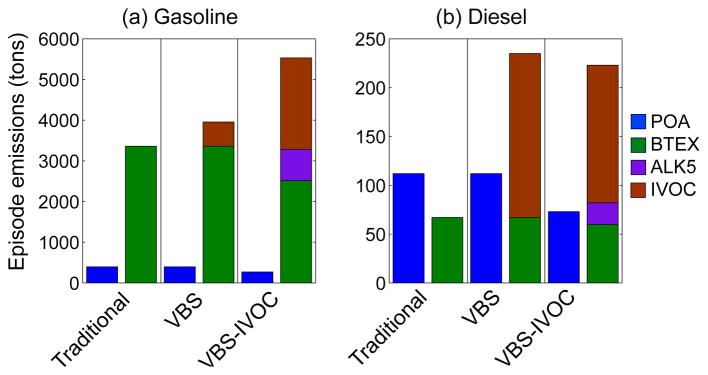
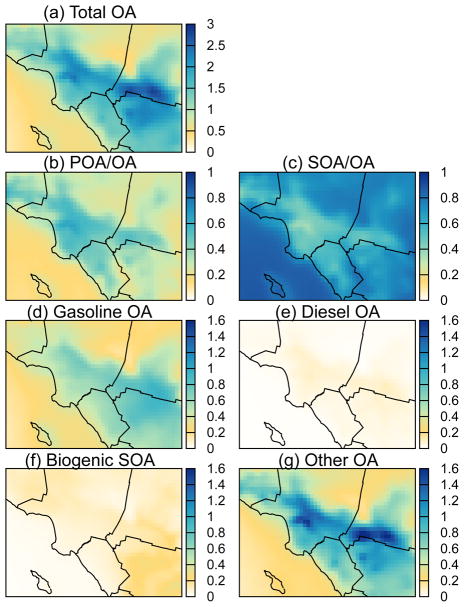
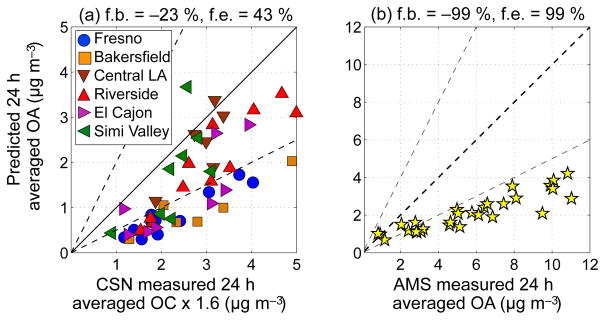
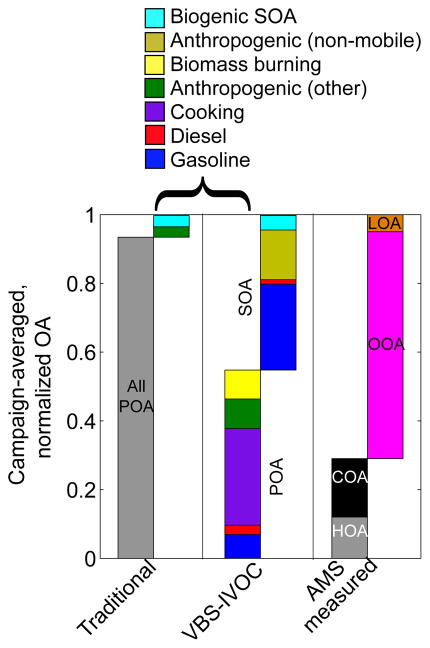
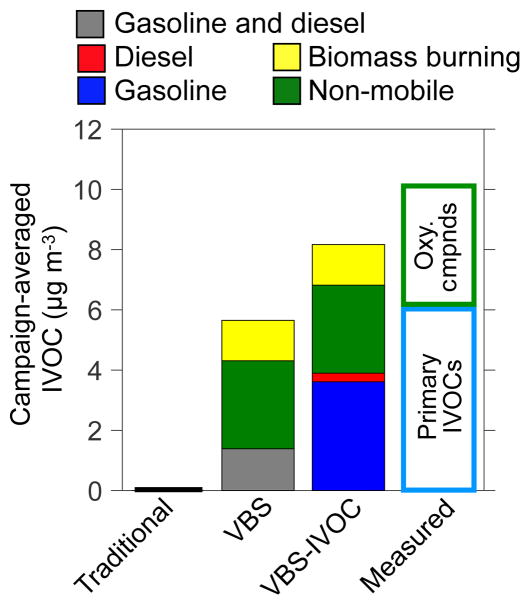
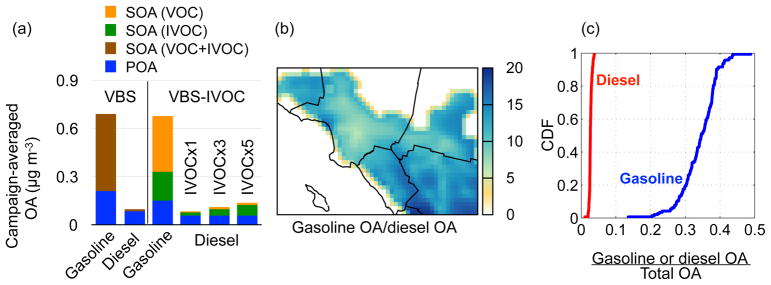
Gasoline- and diesel-fueled engines are ubiquitous sources of air pollution in urban environments. They emit both primary particulate matter and precursor gases that react to form secondary particulate matter in the atmosphere. In this work, we updated the organic aerosol module and organic emissions inventory of a three-dimensional chemical transport model, the Community Multiscale Air Quality Model (CMAQ), using recent, experimentally derived inputs and parameterizations for mobile sources. The updated model included a revised volatile organic compound (VOC) speciation for mobile sources and secondary organic aerosol (SOA) formation from unspeciated intermediate volatility organic compounds (IVOCs). The updated model was used to simulate air quality in southern California during May and June 2010, when the California Research at the Nexus of Air Quality and Climate Change (CalNex) study was conducted. Compared to the Traditional version of CMAQ, which is commonly used for regulatory applications, the updated model did not significantly alter the predicted organic aerosol (OA) mass concentrations but did substantially improve predictions of OA sources and composition (e.g., POA-SOA split), as well as ambient IVOC concentrations. The updated model, despite substantial differences in emissions and chemistry, performed similar to a recently released research version of CMAQ (Woody et al., 2016) that did not include the updated VOC and IVOC emissions and SOA data. Mobile sources were predicted to contribute 30-40 % of the OA in southern California (half of which was SOA), making mobile sources the single largest source contributor to OA in southern California. The remainder of the OA was attributed to non-mobile anthropogenic sources (e.g., cooking, biomass burning) with biogenic sources contributing to less than 5 % to the total OA. Gasoline sources were predicted to contribute about 13 times more OA than diesel sources; this difference was driven by differences in SOA production. Model predictions highlighted the need to better constrain multi-generational oxidation reactions in chemical transport models.
Conflict of interest statement
Competing interests. The authors declare that they have no conflict of interest.
Figures
References
-
- Ahmadov R, McKeen SA, Robinson AL, Bahreini R, Middlebrook AM, de Gouw JA, Meagher J, Hsie EY, Edgerton E, Shaw S, Trainer M. A volatility basis set model for summertime secondary organic aerosols over the eastern United States in 2006. J Geophys Res-Atmos. 2012;117:D06301. doi: 10.1029/2011JD016831. - DOI
-
- Aiken AC, DeCarlo PF, Kroll JH, Worsnop DR, Huffman JA, Docherty KS, Ulbrich IM, Mohr C, Kimmel JR, Sueper D, et al. O /C and OM /OC ratios of primary, secondary, and ambient organic aerosols with high-resolution time-of-flight aerosol mass spectrometry. Environ Sci Technol. 2008;42:4478–4485. - PubMed
-
- Bahreini R, Middlebrook AM, de Gouw JA, Warneke C, Trainer M, Brock CA, Stark H, Brown SS, Dube WP, Gilman JB, Hall K, Holloway JS, Kuster WC, Perring AE, Prevot ASH, Schwarz JP, Spackman JR, Szidat S, Wagner NL, Weber RJ, Zotter P, Parrish DD. Gasoline emissions dominate over diesel in formation of secondary organic aerosol mass. Geophys Res Lett. 2012;39:L06805. doi: 10.1029/2011gl050718. - DOI
-
- Baker KR, Carlton AG, Kleindienst TE, Offenberg JH, Beaver MR, Gentner DR, Goldstein AH, Hayes PL, Jimenez JL, Gilman JB, de Gouw JA, Woody MC, Pye HOT, Kelly JT, Lewandowski M, Jaoui M, Stevens PS, Brune WH, Lin Y-H, Rubitschun CL, Surratt JD. Gas and aerosol carbon in California: comparison of measurements and model predictions in Pasadena and Bakersfield. Atmos Chem Phys. 2015;15:5243–5258. doi: 10.5194/acp-15-5243-2015. - DOI
-
- Ban-Weiss GA, McLaughlin JP, Harley RA, Lunden MM, Kirchstetter TW, Kean AJ, Strawa AW, Stevenson ED, Kendall GR. Long-term changes in emissions of nitrogen oxides and particulate matter from on-road gasoline and diesel vehicles. Atmos Environ. 2008;42:220–232.
Grants and funding
LinkOut - more resources
Full Text Sources
Other Literature Sources