. 2018 Jun 25:3:78.
doi: 10.12688/wellcomeopenres.14641.1. eCollection 2018.

Distinct transcriptional responses of mouse sensory neurons in models of human chronic pain conditions

Affiliations

Distinct transcriptional responses of mouse sensory neurons in models of human chronic pain conditions

M A Bangash et al. Wellcome Open Res. .

Abstract

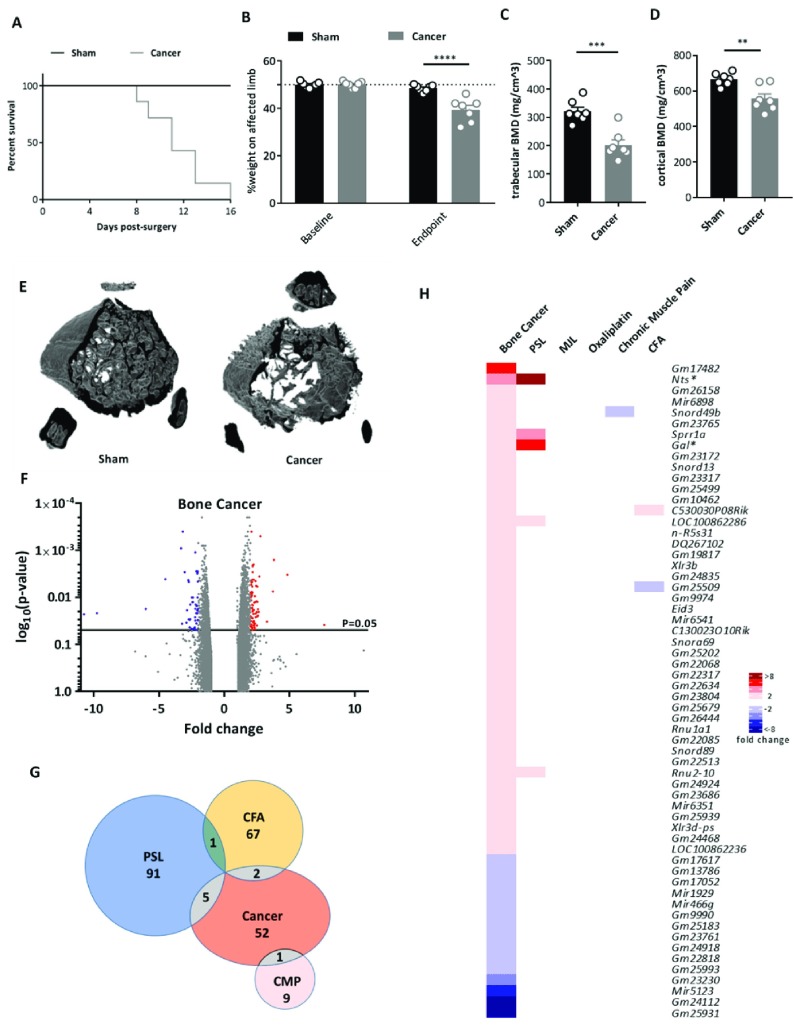
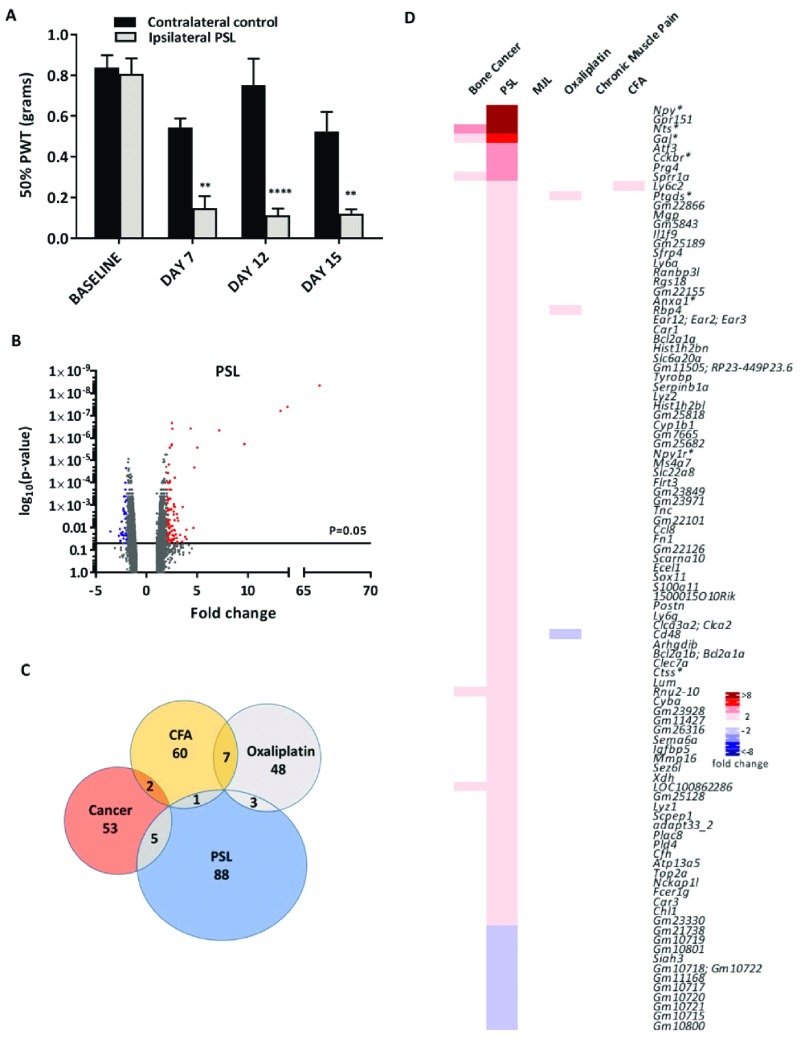
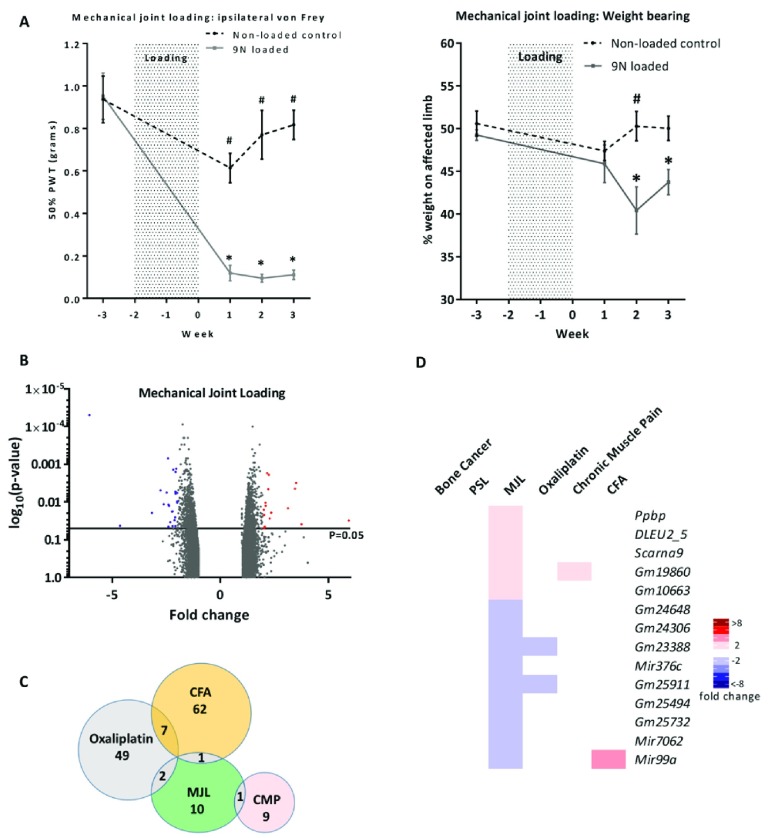
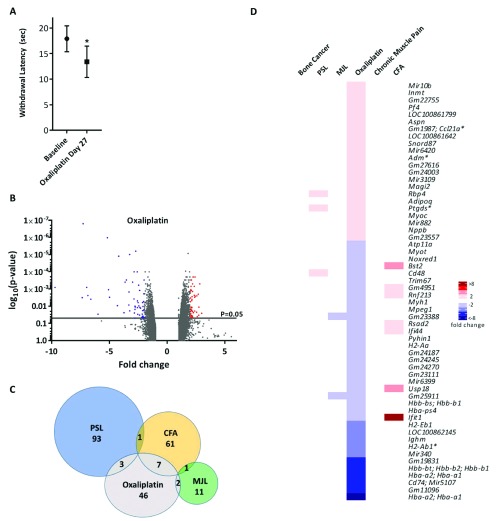
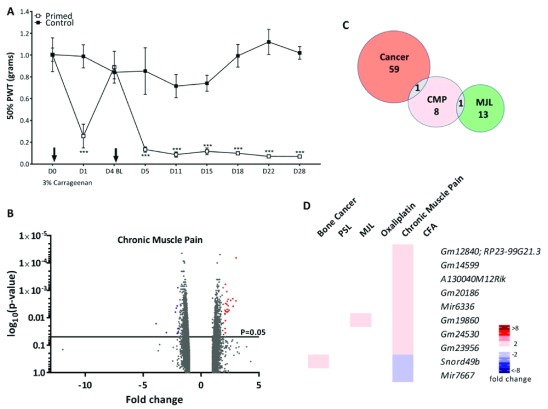
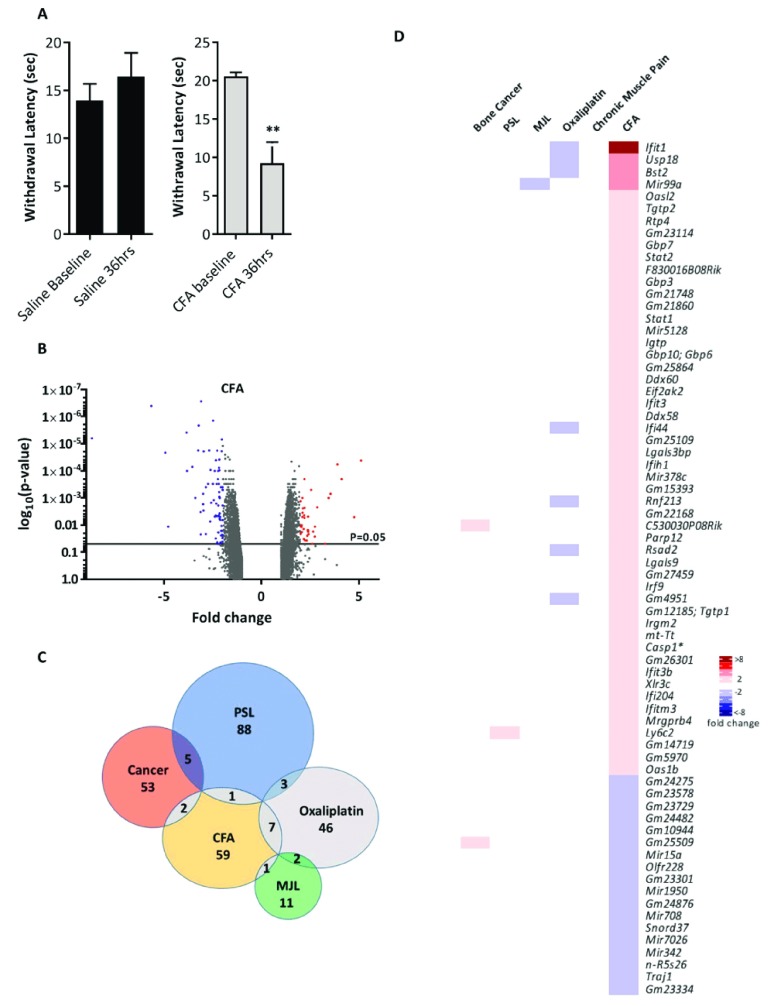
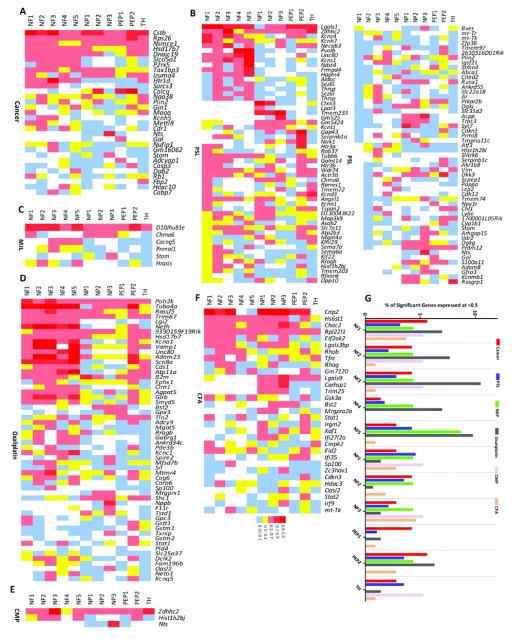
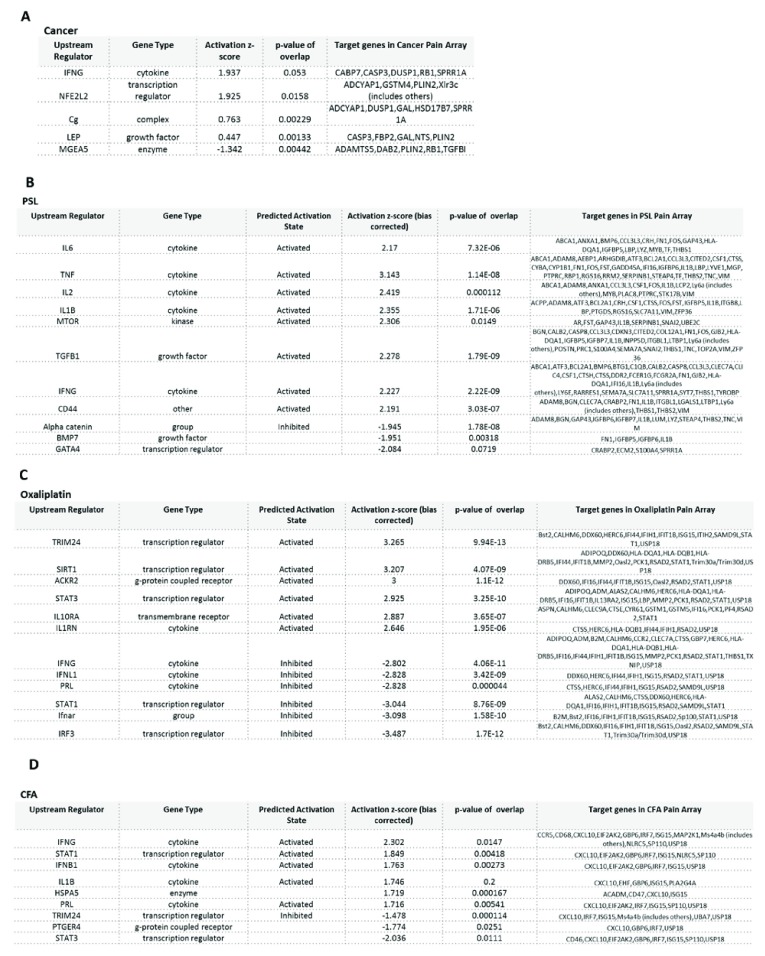
Background: Sensory neurons play an essential role in almost all pain conditions, and have recently been classified into distinct subsets on the basis of their transcriptomes. Here we have analysed alterations in dorsal root ganglia (DRG) gene expression using microarrays in mouse models related to human chronic pain. Methods: Six different pain models were studied in male C57BL/6J mice: (1) bone cancer pain using cancer cell injection in the intramedullary space of the femur; (2) neuropathic pain using partial sciatic nerve ligation; (3) osteoarthritis pain using mechanical joint loading; (4) chemotherapy-induced pain with oxaliplatin; (5) chronic muscle pain using hyperalgesic priming; and (6) inflammatory pain using intraplantar complete Freund's adjuvant. Microarray analyses were performed using RNA isolated from dorsal root ganglia and compared to sham/vehicle treated controls. Results: Differentially expressed genes (DEGs) were identified. Known and previously unreported genes were found to be dysregulated in each pain model. The transcriptomic profiles for each model were compared and expression profiles of DEGs within subsets of DRG neuronal populations were analysed to determine whether specific neuronal subsets could be linked to each of the pain models. Conclusions: Each pain model exhibits a unique set of altered transcripts implying distinct cellular responses to different painful stimuli. No simple direct link between genetically distinct sets of neurons and particular pain models could be discerned.

Keywords: Chronic pain; dorsal root ganglia; gene expression; microarrays; mouse models; sensory neurons.


Conflict of interest statement

No competing interests were disclosed.

Figures

Figure 1.
Figure 1.. Differential gene expression in the cancer induced bone pain model.
( A) Survival curve after surgery for sham (black line, n=7) and cancer (grey line, n=7) animals with endpoint defined as clear limping on the affected limb (limb score=2). Log-rank test: p=0.0056. ( B) Percentage weight bearing on the affected limb is significantly reduced at the endpoint (limb score=2) for cancer compared to sham animals (2-way ANOVA with posthoc Bonferonni test: p<0.0001.) ( C) Trabecular bone mineral density (unpaired t-test: p=0.0003) and ( D) cortical bone mineral density (unpaired t-test: p=0.0033) in cancer vs. sham animals. ( E) Representative 3D reconstructions of a 1mm VOI at 0.6mm from growth plate from uCT data (7 replicates per group). ( F) Volcano plot for all genes identified in the bone cancer pain array. Each dot represents a single gene (red=upregulated; blue=downregulated). ( G) Venn diagram showing the number of differentially expressed DRG genes (fold change >2, <-2, p<0.05) shared with other pain models. ( H) Heat map of upregulated (red) and downregulated (blue) DRG genes (fold change >2, <-2, p<0.05) and a comparison of shared genes across models. Genes with an asterisk are present within the Pain Genes Database of pain-related transgenic knockout studies .
Figure 2.
Figure 2.. Differential gene expression in the partial sciatic nerve ligation (PSL) neuropathic pain model.
( A) Mechanical sensitivity using von Frey filaments on ipsilateral and contralateral paws following PSL surgery (n=4, **indicates p<0.01, ****indicates p<0.0001, 2-way ANOVA with posthoc Bonferonni test). PWT = paw withdrawal threshold. ( B) Volcano plot for all genes identified in the PSL pain model array. Each dot represents a single gene (red=upregulated; blue=downregulated). ( C) Venn diagram showing the number of differentially expressed DRG genes (fold change >2, <-2, p<0.05) shared with other pain models. ( D) Heat map of upregulated (red) and downregulated (blue) DRG genes (fold change >2, <-2, p<0.05) and a comparison of shared genes across models. Genes with an asterisk are present within the Pain Genes Database of pain-related transgenic knockout studies .
Figure 3.
Figure 3.. Differential gene expression in the mechanical joint loading (MJL) model.
( A) Development of mechanical hypersensitivity and altered weight bearing after osteoarthritis (OA) induction by mechanical joint loading. Mice were loaded three times per week for two weeks at 9N (grey line, error bars given as SEM, n=6) in order to induce OA. Behavioural measurements were taken before OA induction and each week for three weeks post loading. These values were compared to a non-loaded isoflurane control (black hashed line, error bars given as SEM, n=6). Significant changes between non-loaded animals and loaded animals are indicated with a # (p<0.05, 2-way ANOVA with posthoc Dunnett or Sidak tests) whilst significant changes within experimental groups over time (compared to baseline value) are indicated with a * (p<0.05, 2-way ANOVA with posthoc Dunnett or Sidak tests). ( B) Volcano plot for all genes identified in the MJL array. Each dot represents a single gene (red=upregulated; blue=downregulated). ( C) Venn diagram showing the number of differentially expressed DRG genes (fold change >2, <-2, p<0.05) shared with other pain models. ( D) Heat map of upregulated (red) and downregulated (blue) DRG genes (fold change >2, <-2, p<0.05) and a comparison of shared genes across models.
Figure 4.
Figure 4.. Differential gene expression in the oxaliplatin pain model.
( A) Cold hypersensitivity induced by oxaliplatin (6 mg/kg, i.p.) at Day 27 (5% glucose solution was used as control). Significant changes are indicated with * (n=6 per group, *p<0.05, paired t-test). ( B) Volcano plot for all genes identified in the oxaliplatin model array. Each dot represents a single gene (red=upregulated; blue=downregulated). ( C) Venn diagram showing the number of differentially expressed DRG genes (fold change >2, <-2, p<0.05) shared with other pain models. ( D) Heat map of upregulated (red) and downregulated (blue) DRG genes (fold change >2, <-2, p<0.05) and a comparison of shared genes across models. Genes with an asterisk are present within the Pain Genes Database of pain-related transgenic knockout studies .
Figure 5.
Figure 5.. Differential gene expression in the chronic muscle pain model.
( A) Widespread mechanical hypersensitivity in a mouse model of the transition from acute to chronic musculoskeletal pain. Mice were injected twice with 3% carrageenan i.m. (primed group) or saline (control group) into the gastrocnemius muscle (n=4 per group). Injections are indicated by arrows and mechanical withdrawal thresholds were assessed in the glabrous skin of the ipsilateral hind paw. Significant changes denoted by *** (***p<0.001 Primed vs Control, 2-way ANOVA with repeated measures and Bonferroni post hoc tests). ( B) Volcano plot for all genes identified in the chronic muscle pain model array. Each dot represents a single gene (red=upregulated; blue=downregulated). ( C) Venn diagram showing the number of differentially expressed DRG genes (fold change >2, <-2, p<0.05) shared with other pain models. ( D) Heat map of upregulated (red) and downregulated (blue) DRG genes (fold change >2, <-2, p<0.05) and a comparison of shared genes across models.
Figure 6.
Figure 6.. Differential gene expression in the complete Freund’s adjuvant (CFA) inflammatory pain model.
( A) Heat hypersensitivity post CFA intraplantar injection (20 microliters) in mice. Significant changes are indicated with ** (n=6 per group, ** p<0.01, 2-way ANOVA). ( B) Volcano plot for all genes identified in the CFA pain model array. Each dot represents a single gene (red=upregulated; blue=downregulated). ( C) Venn diagram showing the number of differentially expressed DRG genes (fold change >2, <-2, p<0.05) shared with other pain models. ( D) Heat map of upregulated (red) and downregulated (blue) DRG genes (fold change >2, <-2, p<0.05) and a comparison of shared genes across models. Genes with an asterisk are present within the Pain Genes Database of pain-related transgenic knockout studies .
Figure 7.
Figure 7.. Pattern of dorsal root ganglion (DRG) neuron expression of differentially expressed genes (DEGs) identified in the six pain models.
Expression pattern in ( A) Bone cancer, ( B) partial sciatic nerve ligation (PSL), ( C) mechanical joint loading (MJL), ( D) Oxaliplatin, ( E) chronic muscle pain (CMP) and ( F) complete Freund’s adjuvant (CFA) models of the DEGs and their basal expression pattern in the 11 different subtypes of DRG neurons (NF1-5, NP1-3, PEP1-2, TH) based on the classification described by Usoskin et al. . NF1, NF2 and NF3 correspond to low-threshold mechanoreceptors (LTMRs); NF4 and NF5 correspond to proprioceptors; NP1, NP2 and NP3 are unmyelinated, nonpeptidergic neurons; PEP1 are unmyelinated, peptidergic neurons; PEP2 are myelinated, peptidergic neurons; and TH neurons are type C low-threshold mechanoreceptors (C-LTMRs) that are unmyelinated. Analysis has been restricted to DEGs with a fold-change greater than 1.5 or less than -1.5 (p<0.05) with at least 20% expression in 1 or more of the neuronal subgroups in the Usoskin et al. dataset . ( G) Transcriptional preference for distinct DRG neuronal subpopulations (described previously) in each pain model. This graphical estimation is based on a particular gene being expressed in 50% or more of a particular neuronal subpopulation and presented as a percentage of the total DEGs shared with the Usoskin et al. dataset at >1.5 or <-1.5 fold (p<0.05).
Figure 8.
Figure 8.. Top upstream regulators of differentially expressed genes identified in bone cancer, partial sciatic nerve ligation (PSL), oxaliplatin, and complete Freund’s adjuvant (CFA) models.
Upstream regulators were identified for ( A) Bone cancer, ( B) PSL, ( C) Oxaliplatin and ( D) CFA. Bias corrected activation z-score predicts likelihood of activation (+ive score) or inhibition (-ive score) of the molecular pathway.

References

    1. Breivik H, Collett B, Ventafridda V, et al. : Survey of chronic pain in Europe: prevalence, impact on daily life, and treatment. Eur J Pain. 2006;10(4):287–333. 10.1016/j.ejpain.2005.06.009 - DOI - PubMed
    1. Nahin RL: Estimates of pain prevalence and severity in adults: United States, 2012. J Pain. 2015;16(8):769–80. 10.1016/j.jpain.2015.05.002 - DOI - PMC - PubMed
    1. LaCroix-Fralish ML, Austin JS, Zheng FY, et al. : Patterns of pain: meta-analysis of microarray studies of pain. Pain. 2011;152(8):1888–98. 10.1016/j.pain.2011.04.014 - DOI - PubMed
    1. Usoskin D, Furlan A, Islam S, et al. : Unbiased classification of sensory neuron types by large-scale single-cell RNA sequencing. Nat Neurosci. 2015;18(1):145–53. 10.1038/nn.3881 - DOI - PubMed
    1. Li CL, Li KC, Wu D, et al. : Somatosensory neuron types identified by high-coverage single-cell RNA-sequencing and functional heterogeneity. Cell Res. 2016;26(8):967. 10.1038/cr.2016.90 - DOI - PMC - PubMed

LinkOut - more resources