. 2018 Aug 6;8(1):25.
doi: 10.1186/s13395-018-0171-0.

MuscleJ: a high-content analysis method to study skeletal muscle with a new Fiji tool

Affiliations

MuscleJ: a high-content analysis method to study skeletal muscle with a new Fiji tool

Alicia Mayeuf-Louchart et al. Skelet Muscle. .

Abstract

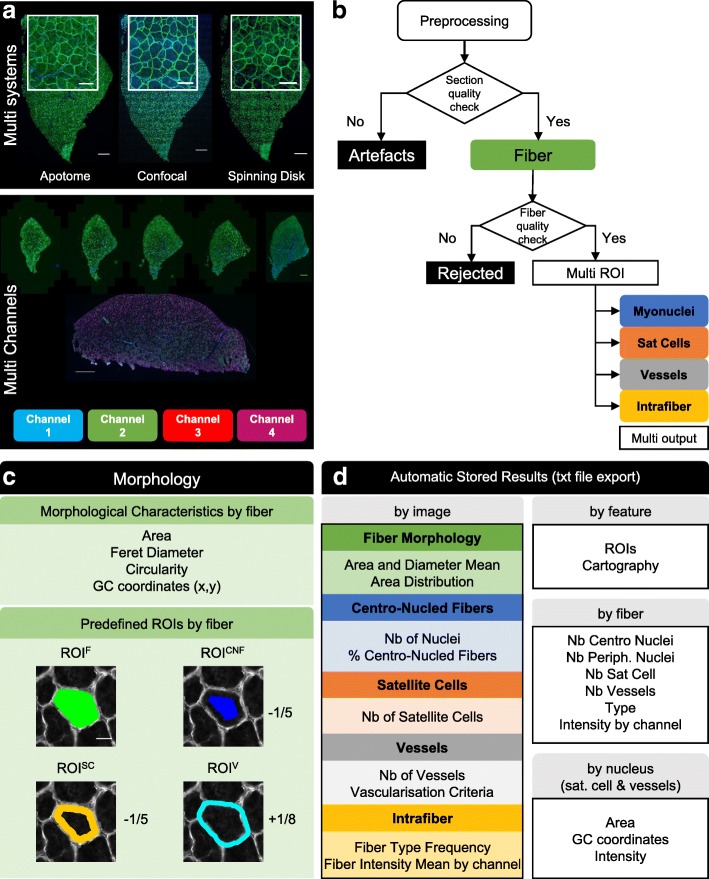
Background: Skeletal muscle has the capacity to adapt to environmental changes and regenerate upon injury. To study these processes, most experimental methods use quantification of parameters obtained from images of immunostained skeletal muscle. Muscle cross-sectional area, fiber typing, localization of nuclei within the muscle fiber, the number of vessels, and fiber-associated stem cells are used to assess muscle physiology. Manual quantification of these parameters is time consuming and only poorly reproducible. While current state-of-the-art software tools are unable to analyze all these parameters simultaneously, we have developed MuscleJ, a new bioinformatics tool to do so.

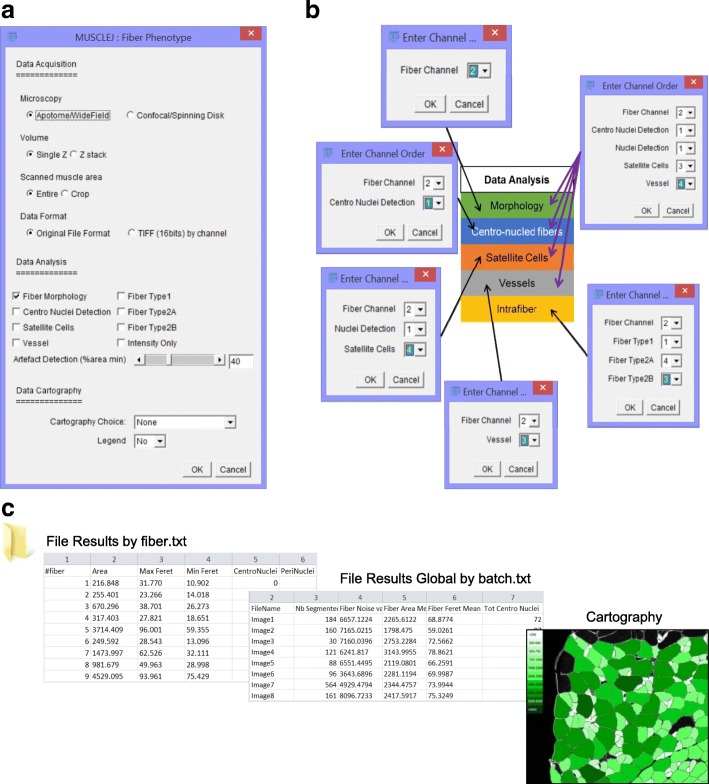
Methods: Running on the popular open source Fiji software platform, MuscleJ simultaneously analyzes parameters from immunofluorescent staining, imaged by different acquisition systems in a completely automated manner.

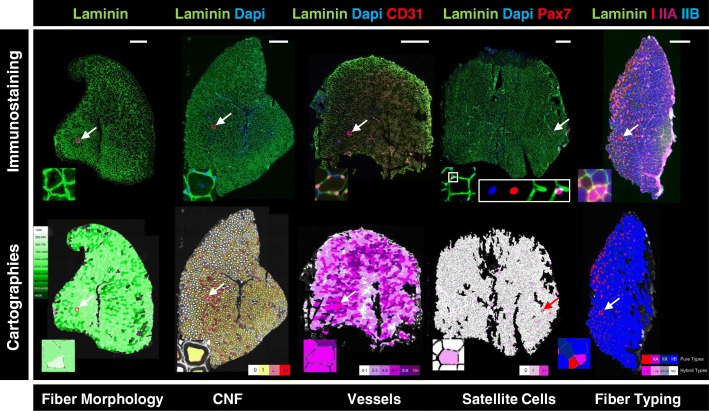
Results: After segmentation of muscle fibers, up to three other channels can be analyzed simultaneously. Dialog boxes make MuscleJ easy-to-use for biologists. In addition, we have implemented color in situ cartographies of results, allowing the user to directly visualize results on reconstituted muscle sections.

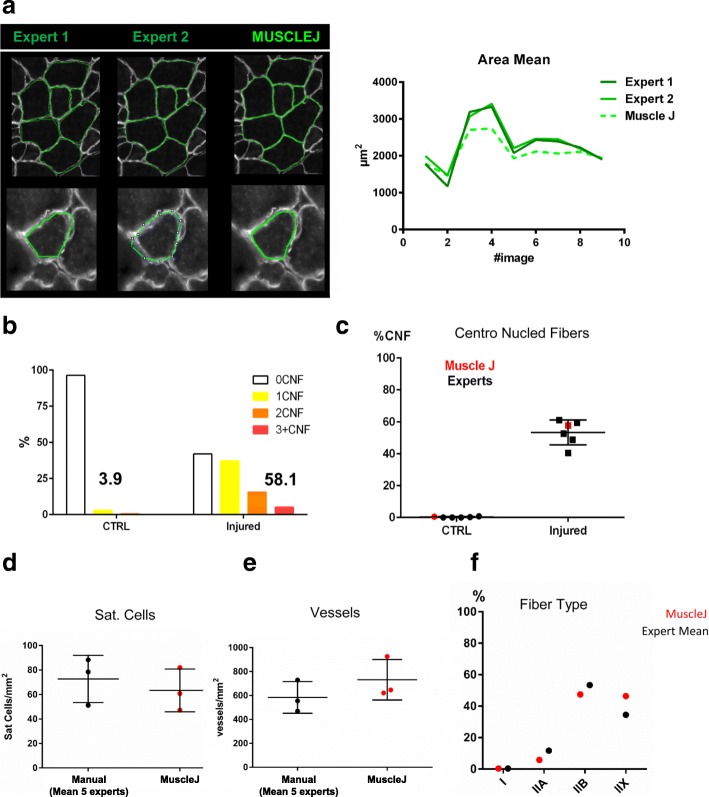
Conclusion: We report here that MuscleJ results were comparable to manual observations made by five experts. MuscleJ markedly enhances statistical analysis by allowing reliable comparison of skeletal muscle physiology-pathology results obtained from different laboratories using different acquisition systems. Providing fast robust multi-parameter analyses of skeletal muscle physiology-pathology, MuscleJ is available as a free tool for the skeletal muscle community.

Keywords: Fiber typing; Histology; Image automated quantification; In situ cartography; Satellite cells; Skeletal muscle fiber; Stem cells; Vessels.


Conflict of interest statement

Experimental procedures were performed with the approval of the Nord-Pas-de-Calais ethics committee (CEEA75- 2017122019046377), the Institut Pasteur Ethics Committee (C2EA 89 - CETEA), and in compliance with French and European ethical legislations. Protocols were also reviewed by the Institut Pasteur, the competent authority, for compliance with the French and European regulations on Animal Welfare and with Public Health Service recommendations. This project has been reviewed and approved (# 2013-0044) by the Institut Pasteur Ethics Committee (C2EA 89 - CETEA).

Not applicable.

The authors declare that they have no competing interests.

Springer Nature remains neutral with regard to jurisdictional claims in published maps and institutional affiliations.

Figures

Fig. 1
Fig. 1
Overview of the MuscleJ workflow and feature pipeline. a Images of the multi-system panel represent the same muscle section acquired by different microscopes: Apotome (Zeiss-25X), Confocal LSM700 (Zeiss-25X), Spinning Disk CV1000 (Yokogawa-20X), and Scale Bar (SB) equals 400 μm. Part of the image appears at higher magnification in white outline, SB equals 200 μm. In the multi-channels panel, images were obtained from the AxioscanZ1 (Zeiss-20X) and muscle sections, with different staining are represented by slide and section. SB equal respectively to 500 μm. b Representation of the MuscleJ organigram. c Automatic detection of different region of interest (ROI) of skeletal muscle fibers, based on laminin staining (gray), corresponding to regions in which several parameters are analyzed (F fiber, CNF centronucleated fiber, SC satellite cell, V vessels). ROICNF, ROISC and ROIV are proportional to the minimum Feret diameter of fibers (− 1/5, − 1/5 and + 1/8 respectively). SB equals 20 μm. d List of the different outputs obtained from MuscleJ, per image, feature, fiber, or nucleus (Nb Number)
Fig. 2
Fig. 2
MuscleJ implementation. a Representation of the principal dialog box of MuscleJ with different sections: data acquisition settings, multi-data analysis choices, and in situ cartography representation. b Following option selection in a, a second dialog box appears and should be informed on the channels order in original file format. c Data are saved in global tables where the requested information is filled in, as well as details for each muscle fiber. Selected cartographies are also saved at this step
Fig. 3
Fig. 3
Scoring of skeletal muscle phenotypes. The upper panel represents entire skeletal muscle sections obtained from immunofluorescent staining with different antibodies (laminin, Pax7, CD31, myosin I, myosin IIA, myosin IIB) and Dapi. SB equals 500 μm (20×, AxioscanZ1). The lower panel represents cartographies made by MuscleJ of the respective stainings. Arrows indicate selections of enlarged fibers in boxes. For satellite cell, each channel is represented separately. The first cartography, colored with a green scale represents the cross-section area (CSA) of skeletal muscle fibers. The number of centronuclei, vessels per fiber (CD31+), satellite cells (Pax7+) per fiber and the fiber typing are represented by red, pink, violet, and purple-blue scales respectively. Color scales can directly be incorporated in the saved cartographies
Fig. 4
Fig. 4
Method validation by feature. a The left panel represents the manual drawing of skeletal muscle fibers by two independent experts. The right panel is a graph representing the cross-section area (CSA) mean by expert compared to MuscleJ. b The percentage of fibers with no, one, two, or three and more centronuclei was quantified by MuscleJ on control skeletal muscle sections (left, CTRL, n = 4) and sections from injured skeletal muscle (right, n = 5). c Manual expertise by five independent experts compared to MuscleJ for the quantification of the percentage of centronucleated fibers. d, e Results obtained for manual quantification compared to MuscleJ for the number of satellite cells by mm2 (d), vessels by mm2 (e) and fiber type distribution. f For d, e, and f, each black dot represents the mean of manual quantification by five independent experts per image. Mann–Whitney test was used to compare manual and MuscleJ data for Sat. Cells and Vessels by mm2 (respectively, p = 0.70 and p = 0.40)

References

    1. Buckingham M, Mayeuf A. Skeletal muscle development. In: Hill JA, Olson EN, editors. Muscle: fundamental biology and mechanisms of disease. Boston: Academic Press; 2012. p. 749-62.
    1. Montarras D, L’honoré A, Buckingham M. Lying low but ready for action: the quiescent muscle satellite cell. FEBS J. 2013;280:4036–4050. doi: 10.1111/febs.12372. - DOI - PubMed
    1. Schiaffino S. Fibre types in skeletal muscle: a personal account. Acta Physiol Oxf Engl. 2010;199:451–463. doi: 10.1111/j.1748-1716.2010.02130.x. - DOI - PubMed
    1. Blaauw B, Schiaffino S, Reggiani C. Mechanisms modulating skeletal muscle phenotype. Compr Physiol. 2013;3:1645–1687. doi: 10.1002/cphy.c130009. - DOI - PubMed
    1. Gutiérrez JM, Ownby CL, Odell GV. Skeletal muscle regeneration after myonecrosis induced by crude venom and a myotoxin from the snake Bothrops asper (Fer-de-Lance) Toxicon Off J Int Soc Toxinol. 1984;22:719–731. doi: 10.1016/0041-0101(84)90155-7. - DOI - PubMed

Publication types

LinkOut - more resources