. 2018 Sep 3;215(9):2235-2245.
doi: 10.1084/jem.20180653. Epub 2018 Aug 6.

Microglial translational profiling reveals a convergent APOE pathway from aging, amyloid, and tau

Affiliations

Microglial translational profiling reveals a convergent APOE pathway from aging, amyloid, and tau

Silvia S Kang et al. J Exp Med. .

Abstract

Alzheimer's disease (AD) is an age-associated neurodegenerative disease characterized by amyloidosis, tauopathy, and activation of microglia, the brain resident innate immune cells. We show that a RiboTag translational profiling approach can bypass biases due to cellular enrichment/cell sorting. Using this approach in models of amyloidosis, tauopathy, and aging, we revealed a common set of alterations and identified a central APOE-driven network that converged on CCL3 and CCL4 across all conditions. Notably, aged females demonstrated a significant exacerbation of many of these shared transcripts in this APOE network, revealing a potential mechanism for increased AD susceptibility in females. This study has broad implications for microglial transcriptomic approaches and provides new insights into microglial pathways associated with different pathological aspects of aging and AD.


Figures

Figure 1.
Figure 1.
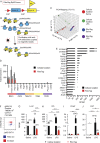
Transcript isolation methodology can introduce bias in microglial transcriptomes. (A) Rpl22HA RiboTag model expressing an alternative HA epitope tagged Rpl22 exon 4. (B) Cell-type specific promoter driven Cre expression uniquely express HA-tagged RPL22 for mRNA transcript purification at “time zero” without necessity for cellular purification. (C) Tamoxifen-treated Cx3cr1CreERT2-IRES-eYFP/+; Rpl22HA/+ mice were injected with saline or 2 mg/kg LPS i.p. and harvested at 24 h for generation of microglial RNAseq of mRNA purified by RiboTag or by cellular isolation by enzymatic digestion, Percoll gradient myelin removal, staining, and flow cytometric sorting forlive 7AAD CD11b+ CD45lo/int microglia. PCA of microglial RNAseq transcriptomes with centroids. n = 3–4 per group from one independent experiment. (D) Fold enrichment of RiboTag and cellular isolation methods relative to input by RNAseq for microglial (micro; red), astrocytes (astro; blue), neurons (neuron; orange), oligodendrocytes (oligo; yellow), and endothelial (endo; purple) transcripts. Shown are the averages ± SEM, n = 3–4 per group from one independent experiment. (E) Top 20 most abundant microglial transcripts enriched in cellular isolation (>10-fold enriched over input) with >10-fold overexpression relative to RiboTag transcripts shown as averages ± SEMwith FDR set at q < 0.1. n = 3–4 per group from one independent experiment. (F) Flow plot of TMEM119+ CD11b+ Live Zombie microglia with S100A8 (red) or fluorescence minus one control (FMO ctrl; blue). n = 3 per group, two independent experiments. (G–J) Average RPKM value ± SEM from RNAseq. n = 3–4 per group, one independent experiment for Lcn2 (G), Il1b (H), Prok2 (I), and Cst7 (J), two-way ANOVA with Tukey posthoc t tests. *, P < 0.05; **, P < 0.01; ***, P < 0.001; ****, P < 0.0001. Numbers in parentheses indicate fold induction.
Figure 2.
Figure 2.
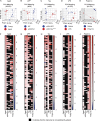
Translational ribosomal profiling of microglial transcriptomes reveals amyloidosis and tauopathy responses overlap with aging but are mostly distinct from acute inflammation. RiboTag derived microglial transcripts from aged (24-mo-old) mice, 9–10-mo-old APP/PS1, and 9–10-mo old rAAV-TauP301L Tau male mice were examined by RNAseq. (A–E) PCA with centroids of RNAseq datasets of microglial transcriptomes from either aged (A), APP/PS1 (B), rAAV-TauP301L (C), 2 mg/kg LPS-injected mice 24 h after challenge (D), and 12 mg/kg poly(I:C)-injected mice 24 h after challenge (E) versus controls were generated from n = 3–5 animals per group, one independent experiment. (F–J) Top 25 changes in microglial transcripts (FDR q < 0.1; FC > 1.25) ranked by age (F), APP/PS1 (G), Tau (H), LPS (I), and poly(I:C) (J). Scale on heat map is log2 fold change n = 3–5 animals per group, one independent experiment. Black boxes indicate that the transcript did not meet the cutoff of q < 0.1 and absolute FC ≥ 1.25.
Figure 3.
Figure 3.
Microglial transcripts shared between aging, amyloidosis, and tauopathy form significant biological pathways. Volcano plots of microglial RiboTag isolated transcripts altered in aged (24 mo old; A), APP/PS1 (B), and rAAV-TauP301L (C). Red are FC values > 0; blue are FC values < 0. Black are transcripts that did not reach significance. The dashed lines indicate an FDR q > 0.1 (considered nonsignificant) based on n = 4–5 animals per group, one independent RNAseq experiment. (D) The fold up-regulation of the top 25 shared genes, sorted by the aged dataset, as averages ± SEM (n = 4–5 per group, one independent experiment). Dashed line, fold change of 1 (no change). (E) Cst7 expression following Cst7 siRNA mediated knockdown. Shown are averages ± SEM (n = 4 per group). Three independent experiments were performed. (F) Fluorescent sphere phagocytosis by primary microglia with siRNA mediated Cst7 knockdown compared with control siRNA. Shown are averages ± SEM (n = 4 per group); **, P < 0.01; ***, P < 0.001; ****, P < 0.0001 by one-way ANOVA, Tukey’s posthoc. Three independent experiments were performed. (G) Significant biological pathways by gene ontology (DAVID; NIAID/NIH) for shared microglial transcripts between aging, amyloidosis, and tauopathy.
Figure 4.
Figure 4.
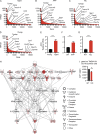
Microglial APOE drives the top network formed by shared microglial transcripts between aging, amyloidosis, and tauopathy. (A–D) RPKM versus abundance ranking of microglial transcripts in aged (24 mo old; A), APP/PS1 (B), Tau (C), and young 3-mo-old males (D) based on n = 4–5 animals per group, one independent RNAseq experiment. (E–G) Relative ApoE microglial mRNA up-regulation in aged (24 mo old; E), APP (F), and Tau (G) versus respective controls. Shown are averages ± SEM (n = 4–5 per group, one independent experiment); ***, P < 0.001, ****, P < 0.0001 by unpaired two-tailed Student’s t test. (H) Ingenuity network analysis of the shared transcripts between aging, amyloidosis, and tauopathy with FDR set at q < 0.1 and absolute FC > 1.25. (I) SPP1 geometric mean fluorescence intensity (GMFI) by flow cytometric analysis of live TMEM119+CD11b+ microglia between WT and Apoe−/− mice shown as averages ± SEM; **, P < 0.01 unpaired two-tailed Student’s t test, n = 3–5 animals per group, two independent experiments.
Figure 5.
Figure 5.
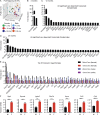
Age related sex differences reveal exacerbation of numerous transcripts involved in the APOE-driven network of CCL3 and CCL4 production. Tamoxifen injected Cx3Cr1CreER/+; Rpl22HA/+ (“RiboTag”) male and female mice were analyzed by RNAseq at 3, 12, and 24 mo of age with FDR set at q < 0.1 and FC > 1.25. (A) PCA of microglial transcriptomes from 3-mo-old males and females, 12-mo-old males and females, and 24-mo-old males and females were generated from n = 4–5 animals per group, one independent experiment. (B–D) Female microglial transcripts at 3 mo (B), 12 mo (C), and 24 mo (D) that were significantly up-regulated compared with male transcripts from the corresponding age. Data are shown for each age as an average ± SEM for n = 4–5 mice per group, one independent experiment. (E) Examination of the top 25 up-regulated transcripts in aged (24-mo-old) females versus young (3-mo-old) females were shown relative to alterations observed in 12-mo versus 3-mo-old females, 24-mo versus 3-mo-old males, and 12-mo versus 3-mo-old males. Shown is the average fold up-regulation ± SEM for n = 4–5 mice per group, one independent RNA seq experiment. (F) Transcripts significantly altered by sex in aged, 24-mo-old mice, observed in the APOE-driven pathway. M is male, F is female. Bar graphs are averages ± SEM; ***, P < 0.001; ****, P < 0.0001 unpaired two-tailed Student’s t test (n = 4–5 per group, one independent experiment).

References

    1. Austermann J., Friesenhagen J., Fassl S.K., Petersen B., Ortkras T., Burgmann J., Barczyk-Kahlert K., Faist E., Zedler S., Pirr S., et al. . 2014. Alarmins MRP8 and MRP14 induce stress tolerance in phagocytes under sterile inflammatory conditions. Cell Reports. 9:2112–2123. 10.1016/j.celrep.2014.11.020 - DOI - PubMed
    1. Baik S.H., Cha M.-Y., Hyun Y.-M., Cho H., Hamza B., Kim D.K., Han S.-H., Choi H., Kim K.H., Moon M., et al. . 2014. Migration of neutrophils targeting amyloid plaques in Alzheimer’s disease mouse model. Neurobiol. Aging. 35:1286–1292. 10.1016/j.neurobiolaging.2014.01.003 - DOI - PMC - PubMed
    1. Cook C., Kang S.S., Carlomagno Y., Lin W.L., Yue M., Kurti A., Shinohara M., Jansen-West K., Perkerson E., Castanedes-Casey M., et al. . 2015. Tau deposition drives neuropathological, inflammatory and behavioral abnormalities independently of neuronal loss in a novel mouse model. Hum. Mol. Genet. 24:6198–6212. 10.1093/hmg/ddv336 - DOI - PMC - PubMed
    1. Corneveaux J.J., Myers A.J., Allen A.N., Pruzin J.J., Ramirez M., Engel A., Nalls M.A., Chen K., Lee W., Chewning K., et al. . 2010. Association of CR1, CLU and PICALM with Alzheimer’s disease in a cohort of clinically characterized and neuropathologically verified individuals. Hum. Mol. Genet. 19:3295–3301. 10.1093/hmg/ddq221 - DOI - PMC - PubMed
    1. Davalos D., Grutzendler J., Yang G., Kim J.V., Zuo Y., Jung S., Littman D.R., Dustin M.L., and Gan W.-B.. 2005. ATP mediates rapid microglial response to local brain injury in vivo. Nat. Neurosci. 8:752–758. 10.1038/nn1472 - DOI - PubMed

Publication types

MeSH terms