. 2018 Dec 1;24(23):5883-5894.
doi: 10.1158/1078-0432.CCR-17-3668. Epub 2018 Aug 6.

A Visually Apparent and Quantifiable CT Imaging Feature Identifies Biophysical Subtypes of Pancreatic Ductal Adenocarcinoma

Affiliations

A Visually Apparent and Quantifiable CT Imaging Feature Identifies Biophysical Subtypes of Pancreatic Ductal Adenocarcinoma

Eugene J Koay et al. Clin Cancer Res. .

Abstract

Purpose: Pancreatic ductal adenocarcinoma (PDAC) is a heterogeneous disease with variable presentations and natural histories of disease. We hypothesized that different morphologic characteristics of PDAC tumors on diagnostic computed tomography (CT) scans would reflect their underlying biology.

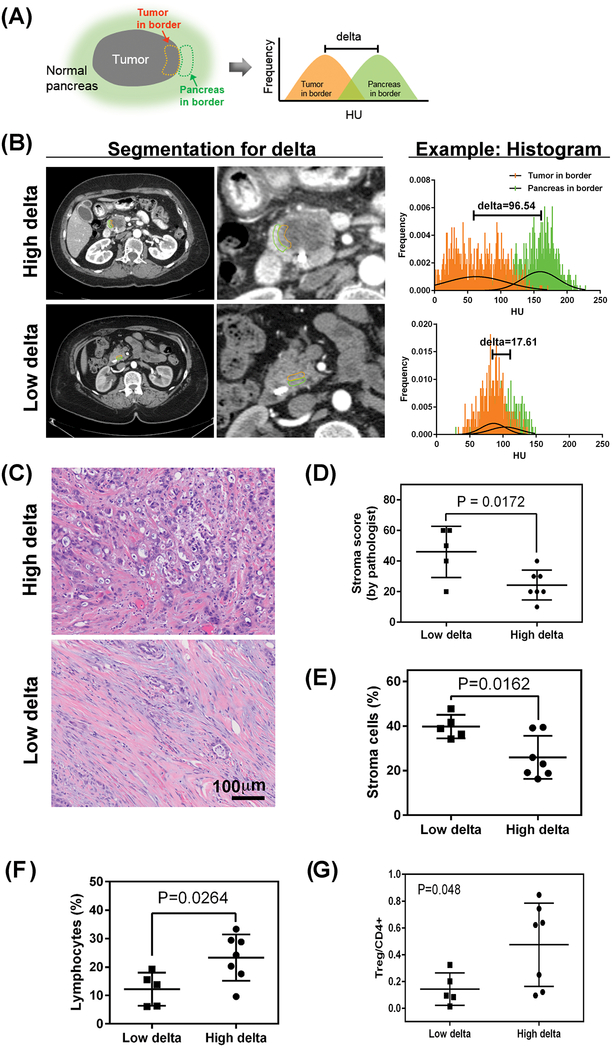
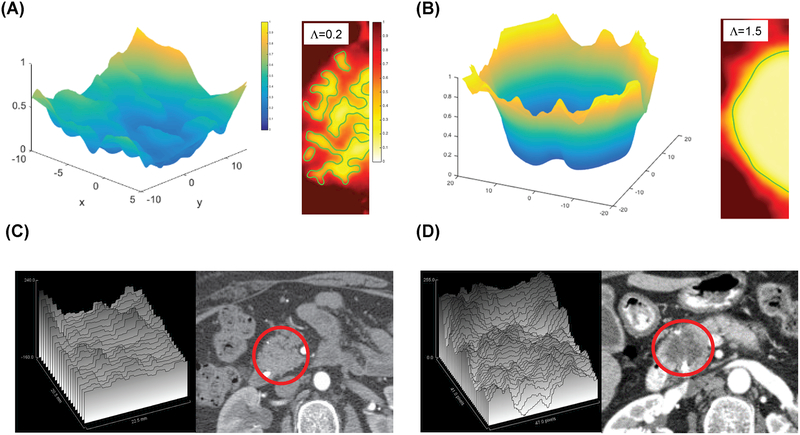
Experimental design: We developed a quantitative method to categorize the PDAC morphology on pretherapy CT scans from multiple datasets of patients with resectable and metastatic disease and correlated these patterns with clinical/pathologic measurements. We modeled macroscopic lesion growth computationally to test the effects of stroma on morphologic patterns, hypothesizing that the balance of proliferation and local migration rates of the cancer cells would determine tumor morphology.

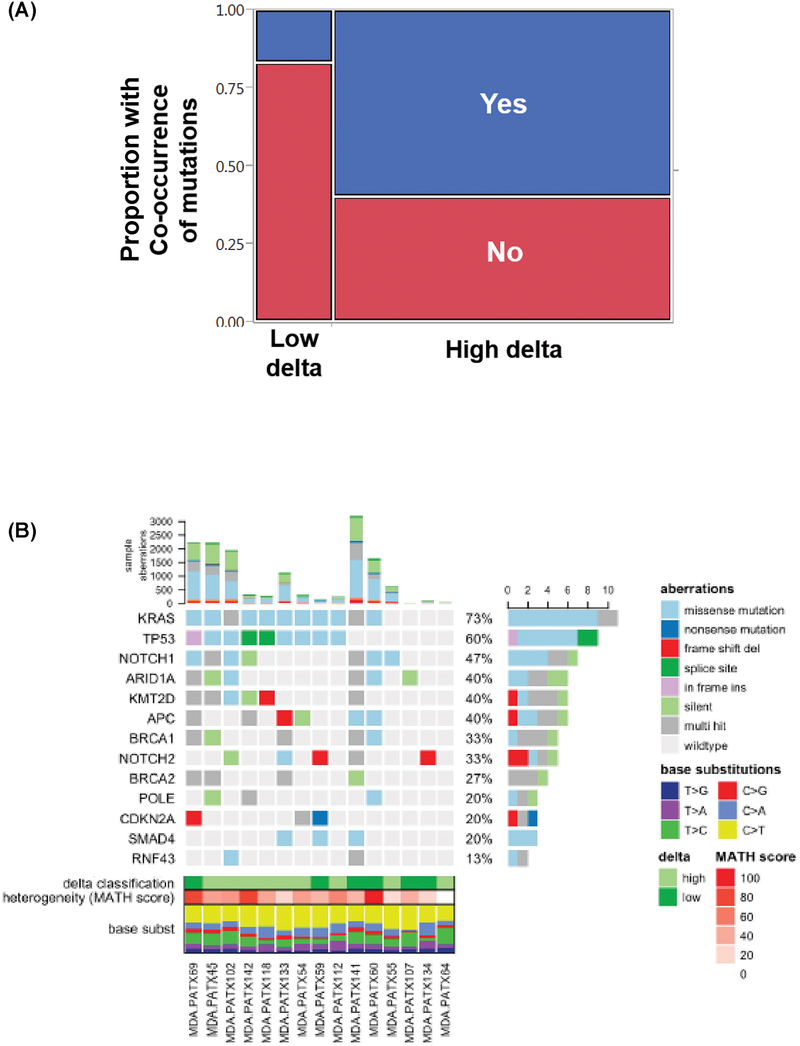
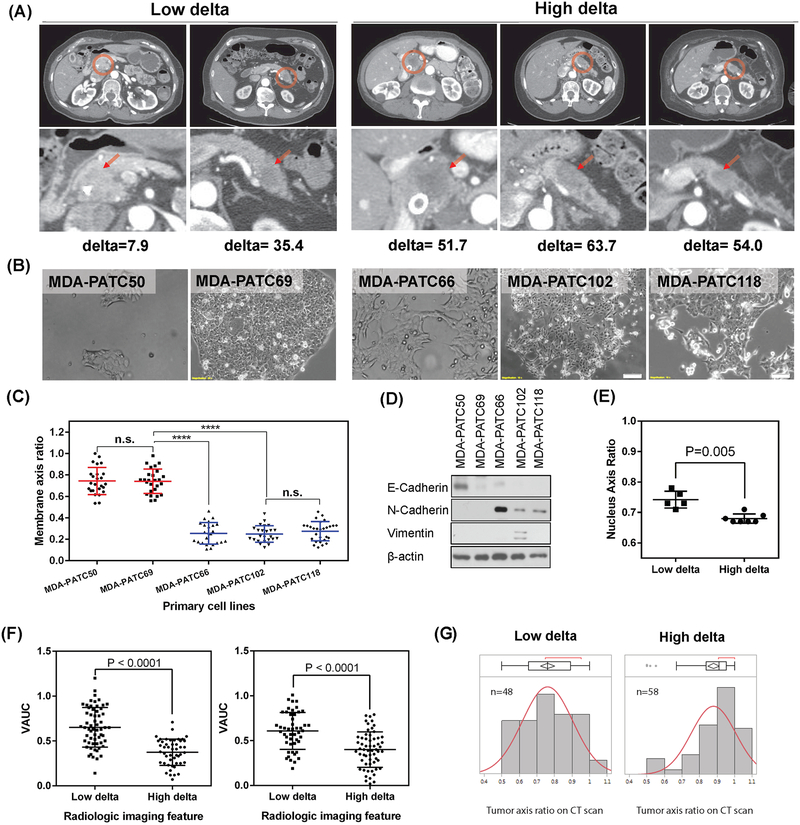
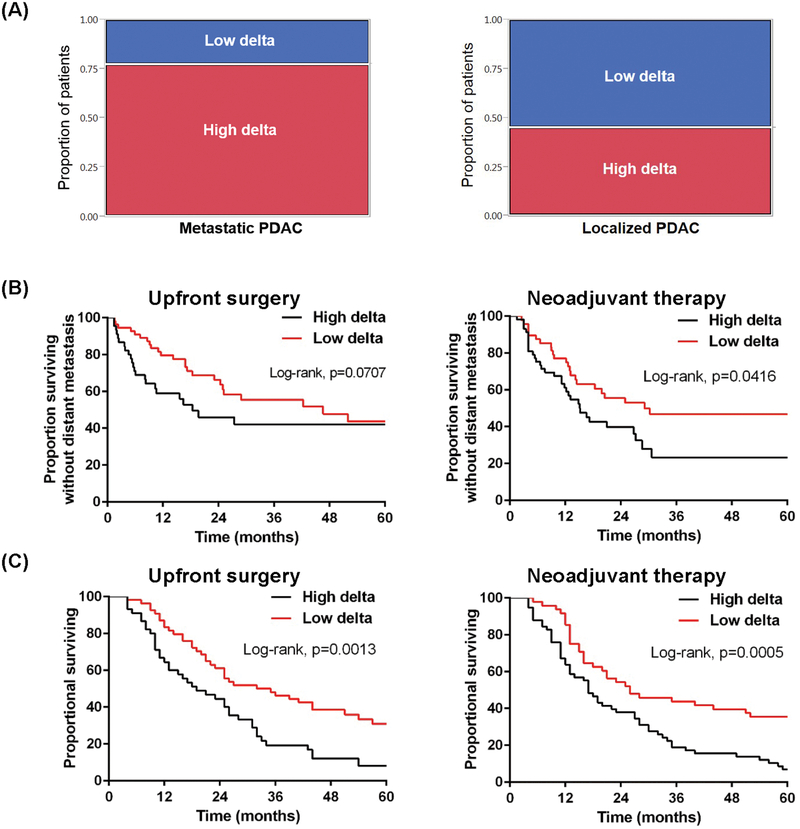
Results: In localized and metastatic PDAC, quantifying the change in enhancement on CT scans at the interface between tumor and parenchyma (delta) demonstrated that patients with conspicuous (high-delta) tumors had significantly less stroma, higher likelihood of multiple common pathway mutations, more mesenchymal features, higher likelihood of early distant metastasis, and shorter survival times compared with those with inconspicuous (low-delta) tumors. Pathologic measurements of stromal and mesenchymal features of the tumors supported the mathematical model's underlying theory for PDAC growth.

Conclusions: At baseline diagnosis, a visually striking and quantifiable CT imaging feature reflects the molecular and pathological heterogeneity of PDAC, and may be used to stratify patients into distinct subtypes. Moreover, growth patterns of PDAC may be described using physical principles, enabling new insights into diagnosis and treatment of this deadly disease.


Conflict of interest statement

Conflict of interest disclosure statement: The authors declare no potential conflicts of interest.

Figures

Fig 1.
Fig 1.
Quantification of the interface between the pancreatic tumor and surrounding normal pancreas. (A) The “delta” method to characterize the interface of pancreatic ductal adenocarcinoma (PDAC) involves contouring the tumor at the border and the normal pancreas at the border. The Hounsfield unit (HU) distribution within each contour can be compared, providing a difference in mean HU. (B) Representative CT scans with contouring of the tumor at the border (orange) and the normal pancreas at the border (green) and the corresponding HU histogram. (C) Representative images and corresponding histology of low- and high-delta tumors. H&E, hematoxylin and eosin. (D) Association of stroma and delta measurement in 12 patients on a trial of intraoperative gemcitabine infusion (Supplementary Table S1, also see Supplementary Fig. S5 for validation cohort). (E) The proportions of cellular subtypes from pathology specimens from 12 patients on a trial of intraoperative gemcitabine infusion (Supplementary Table S1) are shown for stroma cells (E) and lymphocytes (F). For validation, the same algorithm was applied to 17 more patients who underwent upfront resection (i.e., no neoadjuvant therapy) (see Supplementary Fig. S7, S8). (G) Association of high and low delta classification with T regulatory cell markers, normalized by CD4 positive cells.
Fig 2.
Fig 2.
(A) Proportions of low- and high-delta tumors in patients with co-occurring mutations, including KRAS & TP53, KRAS & PIK3CA, or KRAS & SMAD4 (Fisher’s exact test, P=0.01). (B) Next generation sequencing data of 15 patient derived xenografts, classified according to the delta on baseline CT. High delta PDAC were more likely to harbor mutations in both KRAS and TP53 than low delta PDAC (P=0.04).
Fig 3.
Fig 3.
Distinct morphologic properties of cancer cells in low and high delta tumors. (A) CT scans of 5 patients who underwent upfront surgery. (B) Cancer cell lines from the 5 patients in (A) (MDA-PATC50, −69, −66, −102, and −118). (C) The membrane axis ratio, stratified by the delta measurement (Wilcoxon test; n.s., not significant, ****P<0.0001). A high membrane axis ratio indicates a rounder shape. (D) Western blots of the 5 cell lines for markers of the epithelial-to-mesenchymal transition. (E) Nuclear morphology, measured from segmentation on histology. Left panel, nucleus axis ratio was measured from H&E-stained slides of 12 patients in a prospective protocol of intraoperative gemcitabine infusion during PDAC resection (Supplementary Table S1); (F) Physical properties of PDAC stratified by delta measurement, as measured by Volumetric AUC (VAUC) for patients in Supplementary Table S2 (left) and Supplementary Table S3 (right), and (G) by tumor axis ratio from CT scans with orthogonal measurements on a single axial slice at greatest tumor size for patients in Supplementary Table S3 (Wilcoxon test, P<0.0001).
Fig 4.
Fig 4.
Clinical outcomes associated with low and high delta tumors. (A) (Left) Proportions of low and high delta tumors in patients with metastatic PDAC at presentation (Fisher’s exact test, P=0.03; patient characteristics shown in Supplementary Table S4). (Right) Proportions of low and high delta tumors in patients with early-stage, localized PDAC (patient characteristics in Supplementary Table S2). (B) (Left) Distant metastasis-free survival (DMFS) stratified by delta measurement for patients in Supplementary Table S2. (Right) DMFS stratified by delta measurement for patients in Supplementary Table S3. (C) (Left) Overall survival (OS) stratified by delta measurement for patients in Supplementary Table S2. (Right) OS stratified by delta measurement for patients in Supplementary Table S3.
Fig 5.
Fig 5.
Computer simulations of tumor interface morphology during growth. (A, left panel) and (B, left panel) represent perfusion fields predicted by the simulations, rescaled with the perfusion value in the stroma away from the tumor. The predicted change in perfusion from surrounding parenchyma to tumor is more homogeneous in tumors with relatively low cancer cell proliferation rate (Λ=0.2) (A), whereas the perfusion gradient is steeper and deeper for tumors where the cancer cell proliferation rate is high (Λ =1.5) (B). (A, right panel) and (B, right panel) represent morphology of tumors from the same two simulations. The morphology of the simulated tumors with low stability parameter Λ shows intermingling of tumor and stroma (characterized by low-mode instabilities manifesting as large “fingers” of cell clusters (A, right inset). In contrast, for high Λ ((B, right inset), the simulation reveals a distinct interface between tumor and stroma. Representative surface profiles (HU) generated by ImageJ of the CT images are shown in the left panels of C and D with the corresponding CT images on the right. The tumor in the CT images is circled in red.

References

    1. Hidalgo M Pancreatic cancer. The New England journal of medicine 2010;362(17):1605–17 doi 10.1056/NEJMra0901557. - DOI - PubMed
    1. Koay EJ, Baio F, Ondari A, Truty MJ, Cristini V, Thomas RM, et al. Intra-tumoral heterogeneity in gemcitabine delivery and mass transport in human pancreatic cancer. Phys Bio 2014;11:065002. - PMC - PubMed
    1. Koay EJ, Truty MJ, Cristini V, Thomas RM, Chen R, Chatterjee D, et al. Transport properties of pancreatic cancer describe gemcitabine delivery and response. The Journal of clinical investigation 2014;124(4):1525–36 doi 10.1172/JCI73455. - DOI - PMC - PubMed
    1. Ferrari M Frontiers in cancer nanomedicine: directing mass transport through biological barriers. Trends in biotechnology 2010;28(4):181–8 doi 10.1016/j.tibtech.2009.12.007. - DOI - PMC - PubMed
    1. Pascal J, Bearer EL, Wang Z, Koay EJ, Curley SA, Cristini V. Mechanistic patient-specific predictive correlation of tumor drug response with microenvironment and perfusion measurements. Proceedings of the National Academy of Sciences of the United States of America 2013;110(35):14266–71 doi 10.1073/pnas.1300619110. - DOI - PMC - PubMed

Publication types

MeSH terms