. 2018 Aug 6;9(1):3091.
doi: 10.1038/s41467-018-05586-7.

AND-1 fork protection function prevents fork resection and is essential for proliferation

Affiliations

AND-1 fork protection function prevents fork resection and is essential for proliferation

Takuya Abe et al. Nat Commun. .

Abstract

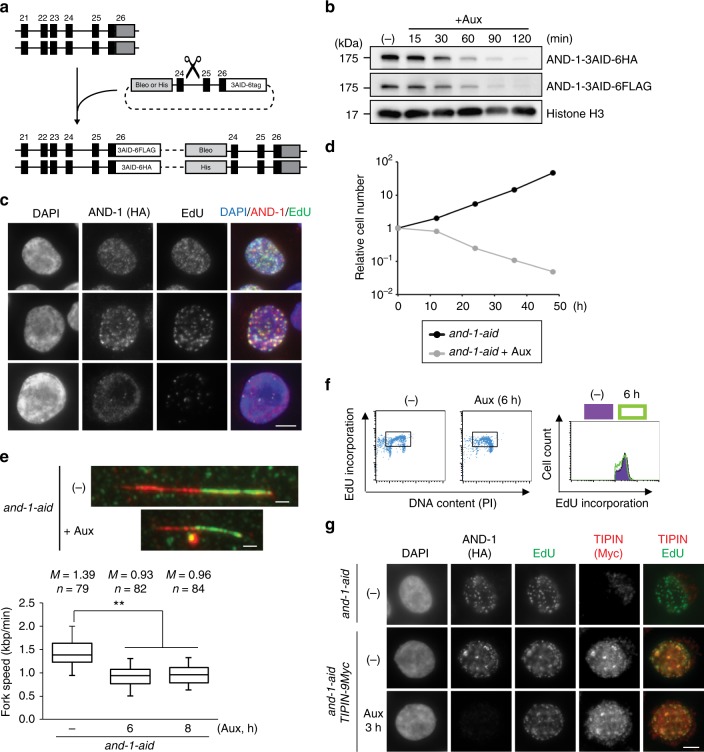
AND-1/Ctf4 bridges the CMG helicase and DNA polymerase alpha, facilitating replication. Using an inducible degron system in avian cells, we find that AND-1 depletion is incompatible with proliferation, owing to cells accumulating in G2 with activated DNA damage checkpoint. Replication without AND-1 causes fork speed slow-down and accumulation of long single-stranded DNA (ssDNA) gaps at the replication fork junction, with these regions being converted to DNA double strand breaks (DSBs) in G2. Strikingly, resected forks and DNA damage accumulation in G2, but not fork slow-down, are reverted by treatment with mirin, an MRE11 nuclease inhibitor. Domain analysis of AND-1 further revealed that the HMG box is important for fast replication but not for proliferation, whereas conversely, the WD40 domain prevents fork resection and subsequent DSB-associated lethality. Thus, our findings uncover a fork protection function of AND-1/Ctf4 manifested via the WD40 domain that is essential for proliferation and averts genome instability.


Conflict of interest statement

The authors declare no competing interests.

Figures

Fig. 1
Fig. 1
Establishment and characterization of AND-1 depletion in DT40 cell lines. a Schematic representation of the AND-1 gene locus and flip-in constructs. Black boxes indicate exons, “Bleo” and “His” indicates drug resistance markers. b Total cell lysates were prepared from and-1-aid cells expressing AND-1-3-AID-6FLAG and AND-1-3AID-6HA, which were analyzed by Western blotting at the indicated time points. c and-1-aid cells were incubated with EdU for 15 min, and replication foci (marked by EdU) and AND-1 foci were visualized by Click-iT method and immunostaining with HA antibody, respectively. Scale bar represents 5 μm. d Growth curves of and-1-aid cells. 105 cells were inoculated in 1 mL of medium and passaged every 12 h. e and-1-aid cells were cultured with or without auxin for indicated times, and DNA replication elongation rates were determined from the lengths of CldU tracks (only the ones clearly connected with IdU tracks were considered). Scale bar on the representative fiber image represents 5 kb. Middle line = median; box = 25th and 75th percentiles; bars = 5th and 95th percentiles. M indicates median values, n, the number of fibers analyzed in each condition. P values were calculated by Student’s t-test and **P ≤ 0.01. f Cell cycle distribution of AND-1 depleted cells. and-1-aid cells were incubated with auxin for 6 h, pulse-labeled with EdU for 15 min, and harvested. The cells were stained with Alexa488 azide to detect EdU uptake and with PI to detect DNA. Left panels show EdU uptake on the y-axis, and total DNA on the x-axis. Right panel shows cell number on the y-axis, and EdU uptake on the x-axis. g and-1-aid and and-1-aid TIPIN-9Myc cells were processed as in (c), with the addition of auxin treatment for 3 h, to monitor EdU, AND-1 (anti-HA), and Tipin (anti-Myc) foci. Scale bar represents 5 μm
Fig. 2
Fig. 2
AND-1 depleted DT40 cells display spontaneous accumulation of DNA double strand breaks (DSBs) and DNA damage checkpoint activation. a Cell cycle distribution of AND-1 depleted cells. and-1-aid cells were incubated with auxin for indicated times, stained with propidium iodide (PI), and DNA content was analyzed by flow cytometry. b and-1-aid cells were incubated with or without auxin for 12 h, caffeine was added, and further incubated for the indicated times. DNA content was analyzed by flow cytometry. c Total cell lysates were prepared from and-1-aid cells at the indicated time points and analyzed by Western blotting. d and-1-aid cells were incubated with or without Auxin for 12 h, caffeine and colcemid were added, and further incubated for 2 h. Metaphase spreads were prepared from and-1-aid cells. Examples of intact and damaged chromosomes (the chromosomes are identified by shape in DT40) are shown. Scale bars represent 10 μm in left panel, 1 μm in enlarged picture (chromosome 2). e and-1-aid cells were incubated with auxin for 8 h and γH2AX or RAD51 foci were visualized by immunostaining with specific antibodies. Scale bars represent 25 μm in upper panels, 5 μm in enlarged pictures. f DSB detection via PFGE. and-1-aid cells were incubated with auxin for the indicated times, collected into agarose plugs and their DNA was separated by size on an agarose gel. Under the electrophoresis conditions used, high molecular weight genomic DNA remains in the well, whereas lower molecular weight DNA fragments (several Mb to 500 kb) migrate into the gel and are compacted into a single band
Fig. 3
Fig. 3
AND-1 depleted cells accumulate ssDNA at replication forks and DSBs in G2. a, b and-1-aid cells were cultured with auxin for 8 h, and incubated with EdU for 15 min. In case of CPT treatment, 10 μM CPT was added for 6 h after EdU incorporation and cells were incubated for 5 min. Cells in S phase or with DSBs were detected by Click-iT method or immnostaining with anti-γH2AX antibody. a Scale bar represents 10 μm. b Error bars represent standard deviation (SD) from three independent experiments. ce and-1-aid cells were incubated with or without auxin for 4 h. Replication intermediates (RIs) were analyzed by transmission electron microscopy (TEM). c Representative TEM pictures (complete view and magnified image of the fork junction point) of a DNA replication fork with a single strand DNA discontinuity. The numbers 1, 2, 3 mark the three arms of the replication fork, with two arms, 2 and 3, being equal in length, using a 10% tolerance in measurements. For each TEM picture, 360 nm scale bars, corresponding to the length of 1 kb of DNA is shown. Red arrows point to the ssDNA filament, the black arrow to the fork branching point. A schematic representation of the junction point is shown, with dsDNA in black and ssDNA in red. d Chart and numbers above showing the percentages of replication forks analyzed in the indicated genetic backgrounds (the reported gapped forks have ssDNA > 300 nt). Molecules derive from two independent experiments, for a total number (n) of molecules shown in panel e. Error bars represent the SD obtained from two independent experiments. e Box plot reporting the distribution of ssDNA length at fork branching points. n is the total number of replication forks analyzed, A is the average length of ssDNA, and M is the median length of ssDNA. In the box plots, the middle line indicates the median value; the box shows the 25th and 75th percentiles; the bars, the 5th and 95th percentiles. P values were calculated by Student’s t-test. *** P ≤ 0.001
Fig. 4
Fig. 4
AND-1 prevents nucleolytic processing of the forks and subsequent damage accumulation. a Foci assay of γH2AX and RAD51. Upper panels: scheme of the experiment and cell cycle distribution at the indicated time points, when mirin was added and samples were collected for PI FACS and immunostaining. Cells untreated or treated with either or both mirin and auxin at indicated time points were stained with propidium iodide (PI), and DNA content was analyzed by flow cytometry. Bottom panels: γH2AX and RAD51 foci in G2/M cells untreated or treated with mirin, auxin, or both. Results of two experiments are shown. n represents the number of cells analyzed in the two experiments. b, c EM analysis of the replication intermediates purified from and-1-aid cells treated with auxin with or without mirin for 4 h as in Fig. 3d, e. Percentage or normal and gapped forks (b) and distribution of ssDNA length at the fork branching point (c). The reported gapped forks have ssDNA > 300 nt. Molecules derive from two independent experiments, for a total number (n) of molecules shown in c. n is the total number of replication forks analyzed, A is the average length of ssDNA, and M is the median length of ssDNA. In the box plots in c, the middle line indicates the median value; the box shows the 25th and 75th percentiles; the bars, the 5th and 95th percentiles. P values were calculated by Student’s t-test. ** P ≤ 0.01. d Fork speed measured as in Fig. 1e for and-1-AID cells untreated or treated with auxin, or auxin and mirin for 4 h as indicated in the scheme in Fig. 4b. ****P ≤ 0.0001. e Growth curves of and-1-aid cells in the indicated conditions. 105 cells were inoculated in 1 mL of medium and passaged every 24 h. Error bars represent SD obtained from three independent experiments
Fig. 5
Fig. 5
Identification of critical AND-1 domains for DNA replication and proliferation. a Schematic presentation of the generated AND-1 deletion variants. b Growth curves of cell lines of the indicated genotype. A total of 105 cells were inoculated in 1 mL of medium and passaged every 24 h. Error bars represent SD obtained from three independent experiments. c DNA replication elongation rates were determined as shown in Fig. 1e, with n representing the numbers of fibers analyzed in each condition. d Cells of the indicated genotypes were cultured in the presence of auxin for 3 h and incubated with EdU, and replication foci and AND-1 foci were visualized by Click-iT method and immunostaining with HA antibody. Scale bar represents 5 μm. e Ratio of AND-1-HA and histone H3 in chromatin fractionation. Cells of the indicated genotypes were cultured in the presence of auxin for 3 h. Chromatin bound AND-1 and histone H3 were assessed by immunoblotting. Measured chromatin bound AND-1-HA amount normalized to histone H3 in the cell lysate of three independent experiments were averaged and plotted. Error bars represent standard error of the mean (SEM) obtained from three independent experiments. P values were calculated by Student’s t-test. *P represents P values smaller than 0.05, **P values smaller than 0.01, and ***P values smaller than 0.001
Fig. 6
Fig. 6
Identification of AND-1 domains critical for proliferation and prevention of spontaneous DSB formation. a Cell cycle distribution of AND-1 deletion mutants. Cells of the indicated genotypes were incubated with auxin for indicated times, stained with propidium iodide (PI), and DNA content was analyzed by flow cytometry. b Total cell lysates were prepared from cells of the indicated genotypes and analyzed by Western blotting. c Cells of the indicated genotypes were incubated with auxin for 8 h and γH2AX and RAD51 foci were visualized by immunostaining with specific antibodies. Results of two experiments are shown. n represents the number of cells analyzed in the two experiments. d, e EM analysis of the replication intermediates purified from the cell lines of the indicated genotype as in Fig. 3d, e. Molecules derive from two independent experiments, for a total number (n) of molecules shown in e. n is the total number of replication forks analyzed, A is the average length of ssDNA, and M is the median length of ssDNA. Error bars in d represent SDM obtained from two independent experiments. In the box plots in e, the middle line indicates the median value; the box shows the 25th and 75th percentiles; the bars, the 5th and 95th percentiles. P values were calculated by Student’s t-test. ***P  ≤ 0.001

References

    1. Gambus A, et al. GINS maintains association of Cdc45 with MCM in replisome progression complexes at eukaryotic DNA replication forks. Nat. Cell Biol. 2006;8:358–366. doi: 10.1038/ncb1382. - DOI - PubMed
    1. Gerbi SA, Bielinsky AK. DNA replication and chromatin. Curr. Opin. Genet. Dev. 2002;12:243–248. doi: 10.1016/S0959-437X(02)00292-7. - DOI - PubMed
    1. Branzei D, Foiani M. Maintaining genome stability at the replication fork. Nat. Rev. Mol. Cell Biol. 2010;11:208–219. doi: 10.1038/nrm2852. - DOI - PubMed
    1. Spencer F, Gerring SL, Connelly C, Hieter P. Mitotic chromosome transmission fidelity mutants in Saccharomyces cerevisiae. Genetics. 1990;124:237–249. - PMC - PubMed
    1. Kouprina N, et al. CTF4 (CHL15) mutants exhibit defective DNA metabolism in the yeast Saccharomyces cerevisiae. Mol. Cell. Biol. 1992;12:5736–5747. doi: 10.1128/MCB.12.12.5736. - DOI - PMC - PubMed

Publication types