. 2018 Aug 6;9(1):3081.
doi: 10.1038/s41467-018-05526-5.

Social interactions impact on the dopaminergic system and drive individuality

Affiliations

Social interactions impact on the dopaminergic system and drive individuality

N Torquet et al. Nat Commun. .

Abstract

Individuality is a striking feature of animal behavior. Individual animals differ in traits and preferences which shape their interactions and their prospects for survival. However, the mechanisms underlying behavioral individuation are poorly understood and are generally considered to be genetic-based. Here, we devised a large environment, Souris City, in which mice live continuously in large groups. We observed the emergence of individual differences in social behavior, activity levels, and cognitive traits, even though the animals had low genetic diversity (inbred C57BL/6J strain). We further show that the phenotypic divergence in individual behaviors was mirrored by developing differences in midbrain dopamine neuron firing properties. Strikingly, modifying the social environment resulted in a fast re-adaptation of both the animal's traits and its dopamine firing pattern. Individuality can rapidly change upon social challenges, and does not just depend on the genetic status or the accumulation of small differences throughout development.


Conflict of interest statement

The authors declare no competing interests.

Figures

Fig. 1
Fig. 1
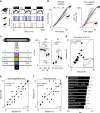
The Souris City environment. a Souris City setup with connectable sub-compartments, gates, and antennas. The setup is divided in two main parts: a social cage and a test zone. The social cage is divided in four sub-compartments: NC, which contains a nest, FC where mice have free and uncontrolled access to food, CC, and a stair (St) to get access to the gate (Supplementary Fig. 1). NC, FC, and CC are located in a 1 m ×1 m square, on which St is connected by a tube. Mice are tagged with RFID chips and detected by floor or tubes RFID antennas. A gate separates the test zone (here a T-maze) from the social cage. Two infrared beams (red dashed line) are used to detect mice in the T-maze. b (Left) Histogram of all the detection events from tubes (10 min time bins). (Right) Distribution of the time spent in each sub-compartment (log-scale, bandwidth = 0.1). c Circular plots showing the starting time (on a 24 h dial) and duration (log distance of the point to the center) of each visit (a dot) for NC and FC. Three circles indicate the 15′ (blue), 1 h (red), and 10 h (green) limits. d Analysis of social behavior: (Left) Peri-event time histogram (PETH density, bandwidth = 2 s) of transitions for distinct mice to the same sub-compartment (all sub-compartments pooled), indicating successive transitions within a 10 s window. (Right) Follower and leader mice, based on the ratio between the number of leads over the number of follows from sub-compartment transition episodes in a time window of 5 s. n = 49 mice from five experiments. e Chasing episodes are defined by concomitant detections of the same two mice on at least two consecutive antennas. (Right) Follower and leader mice, based on the ratio between the number of leads over the number of follows. n = 49 mice from five experiments. d, e Data were normalized with the duration of the session
Fig. 2
Fig. 2
Consistency of behavior across situations. a Example of atypical behaviors. Top: density of mice in NC. Below: Presence ( = 1) of two mice (#1 and #13) in NC. b Cumulative distributions of entropy (left) and of the proportion of time spent in FC (right). c (Left) Diagram representing the five sessions. Variation across sessions (mean ± sem) of (middle) the proportion of time spent in NC (n = 18, F(4,68) = 22.69, p < 0.001; and post-hoc test) and (right) in St (n = 18, F(3,51) = 30.52, p < 0.001; and post-hoc test). d Correlation between proportion of time spent in St for individual mice in session 1 (S1) against session 2 (S2) (Spearman correlation coefficient, n = 18, fitted line = solid line, identity line = dotted line). Inset displays ranks instead of values with the correlation line. e, f Same as d inset for e the rank based on the ratio of leading over following and f the rank based on the proportion of time spent alone. g Rank correlations (rho) for two consecutive periods, for ten individual and social behaviors: lead/follow (see Fig. 1e); Antenna 16: number of detections on antenna #16 (floor antenna in the top right of the social cage, in CC); Events 9:0-15:0: number of events between 9:00 and 15:00; Alone: time spent in a sub-compartment with no other mice; Time in FC; With 1: time spent in a sub-compartment with one other mouse; Time in T: time spent in the T-maze; Entropy (see Methods); Events per day: number of tube antenna detections per day; Entries in T: number of entries in the T-maze. All these data were corrected by the duration of the session. For eg, n = 30 mice from three independent experiments. ***p < 0.001,**p < 0.01,*p < 0.05
Fig. 3
Fig. 3
Decision-making. a T-maze occupancy (in %) on a 24 h cycle. b Probability to choose the highest rewarded arm (A) in sessions S1, S2, and S3. For S2 and S3, the first choice corresponds to the one after the bottles have been swapped. c Win-Stay strategy: probability to switch side when the latest choice (in x-axis) is sucrose (S) or water (W) for S2 and water (W) or nothing (N) for S3. (W = 4393 and 675.5, p = 0.0012 and p < 0.001). d Cumulative left (L.) or right (R.) turns for two different mice (# i and j), upon water and sucrose bottle swapping in S2 (symbols on top, indicating bottle content on the R. side). e Principal component analysis based on a, SW; α and β, (n = 86 from 9 experiments) from which we clustered three different groups (G1, G2, and G3). Insets on the right show normalized plots equivalent to d. f The three groups are well characterized by their difference in SW (i.e., low (LS), intermediate (IS), and high switch (HS) rates). Data c, f are presented as mean ± sem; ***p < 0.001, **p < 0.01, *p < 0.05
Fig. 4
Fig. 4
Correlation between specific cognitive behaviors and electrophysiological properties of the DA system. a Different groups of mice (10 groups, n = 124 mice) were tracked during the S2 in Souris City and classified according to their SW in three groups (i.e., low (LS), intermediate (IS), and high switch (HS) rates). Sixteen variables categorized in three groups were estimated: general activity, social, and T-maze access variables. b (Top) Correlation between principal component PC1 and PC2 for typical behaviors and SW. (Bottom) Correlation circle plots for the first two principal components (PC1 and PC2) with the different variables represented by their projections. (Left) General activity variables (X2 = 13.101, df = 2, p-value = 0.0014 for PC2). (Middle) Social variables (X2 = 14.972, df = 2, p-value = 0.00056 for PC2). (Right) T-access variables (X2 = 32.046, df = 2, p-value < 0.001 for PC1; X2 = 18.86, df = 2, p-value < 0.001 for PC2). c (Left) Spontaneous DA cell activity in standard cages with water (StC), sucrose (5%) or in Souris City (SCity) (frequency: X2 = 32.714, df = 2, p-value < 0.001; %SWB: X2 = 17.172, df = 2, p-value < 0.001). d (Left) Representative electrophysiological recordings of DA cells from LS (above) and HS mice (below). (Right) VTA DA neuron firing activity of the three groups (X2 = 13.601, df = 2, p-value = 0.0011 for frequency, X2 = 26.919, df = 2, p-value < 0.001 for %SWB). All Kruskal–Wallis were followed by a pairwise Wilcoxon post-hoc test with a Holm’s correction. All data are presented as mean ± sem, ***p < 0.001, **p < 0.01, *p < 0.05
Fig. 5
Fig. 5
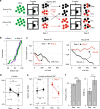
Influence of the group on individual behaviors and on the DA system. a Experimental paradigm: two different groups of mice were studied in parallel in two Souris City environments (1 and 2). After 5 weeks, their switching pattern were evaluated (step 1). Mice from each Souris City were split in lowest (red) and highest (black) switchers. The two populations were then mixed and the lowest switchers from the two environments were grouped together (same for the highest switchers). After three weeks of sucrose versus water, the switching patterns were re-evaluated (step 2) for both residents (Res.) and incomers (Inc.). b Cumulative distribution of SW for steps 1 (purple) and 2 (green) (D = 0.2069, p = 0.57). c Cumulative left or right turns for two different mice upon water and sucrose bottle swapping in step 1 (black) and step 2 (red). The incomer mouse #5 switched less, whereas the resident mouse #6 switched more in step 2 compared to step 1. d Switch variation between step 1 and 2 (∆SW) for incomers and residents (two-sample t-test, t(27) = 2.9401). e (Left) No difference in SW in step 1 between lowest switchers of the two different Souris City, whether they will be subsequently considered as incomers or residents. (Right) SW is different for the same two groups after step 2 (Two-sample t-test (t = 3.5914, **p < 0.01)). f Firing activity of VTA DA neurons from incomers and residents (frequency and SWB: two-sample Wilcoxon, W = 17,750 and W = 18,319 respectively, p < 0.001). ***p < 0.001, **p < 0.01, *p < 0.05

References

    1. Sih A, Bell A, Johnson JC. Behavioral syndromes: an ecological and evolutionary overview. Trends Ecol. Evol. 2004;19:372–378. doi: 10.1016/j.tree.2004.04.009. - DOI - PubMed
    1. Bach JF. The biological individual—the respective contributions of genetics, environment and chance. Comptes rendus-Biol. 2009;332:1065–1068. doi: 10.1016/j.crvi.2009.09.010. - DOI - PubMed
    1. Bergmüller R, Taborsky M. Animal personality due to social niche specialisation. Trends Ecol. Evol. 2010;25:504–511. doi: 10.1016/j.tree.2010.06.012. - DOI - PubMed
    1. Duckworth RA. Evolution of personality: developmental constraints on behavioral flexibility. Auk. 2010;127:752–758. doi: 10.1525/auk.2010.127.4.752. - DOI
    1. Wolf M, Weissing FJ. An explanatory framework for adaptive personality differences. Philos. Trans. R. Soc. Lond. B. 2010;365:3959–3968. doi: 10.1098/rstb.2010.0215. - DOI - PMC - PubMed

Publication types