. 2018 Aug 6;9(1):3083.
doi: 10.1038/s41467-018-05322-1.

Myeloid apolipoprotein E controls dendritic cell antigen presentation and T cell activation

Affiliations

Myeloid apolipoprotein E controls dendritic cell antigen presentation and T cell activation

Fabrizia Bonacina et al. Nat Commun. .

Abstract

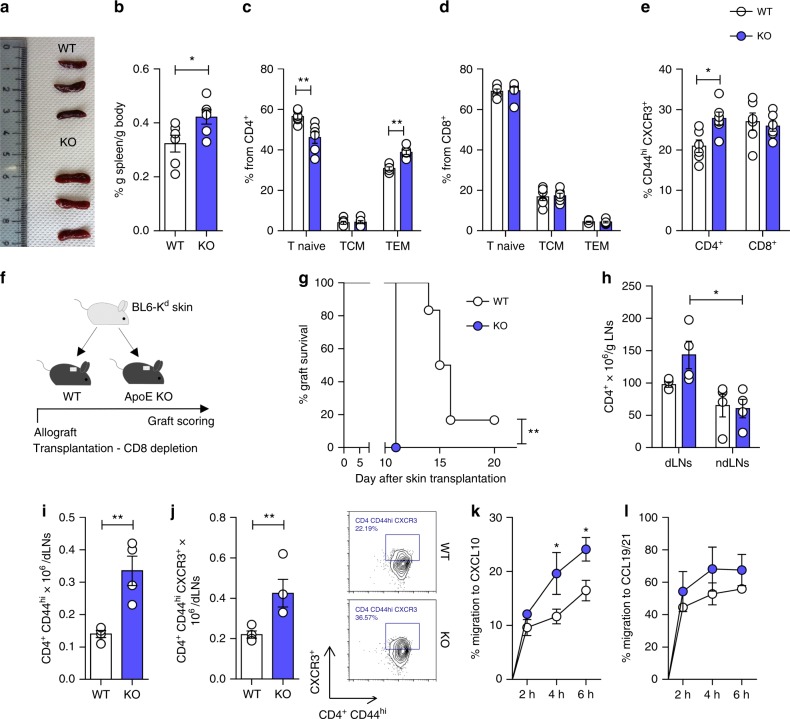
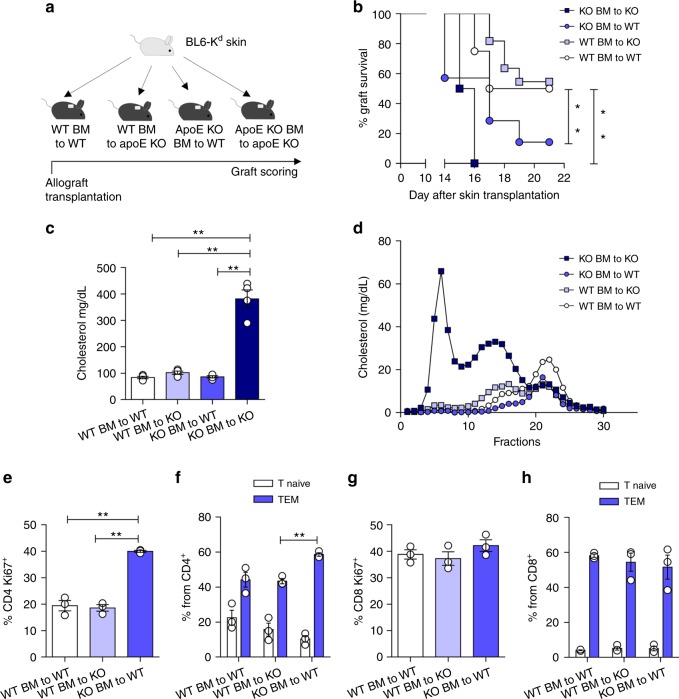
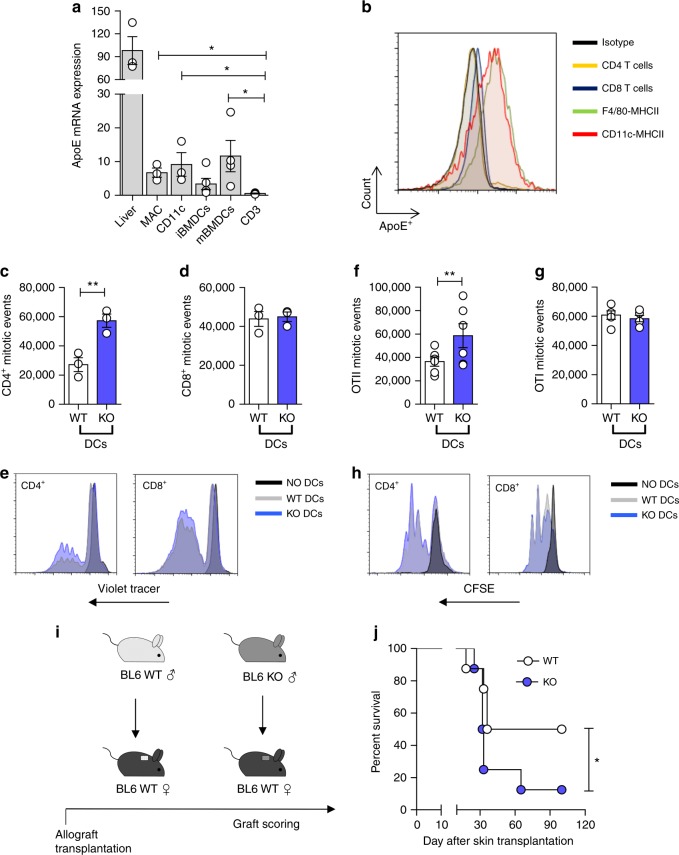
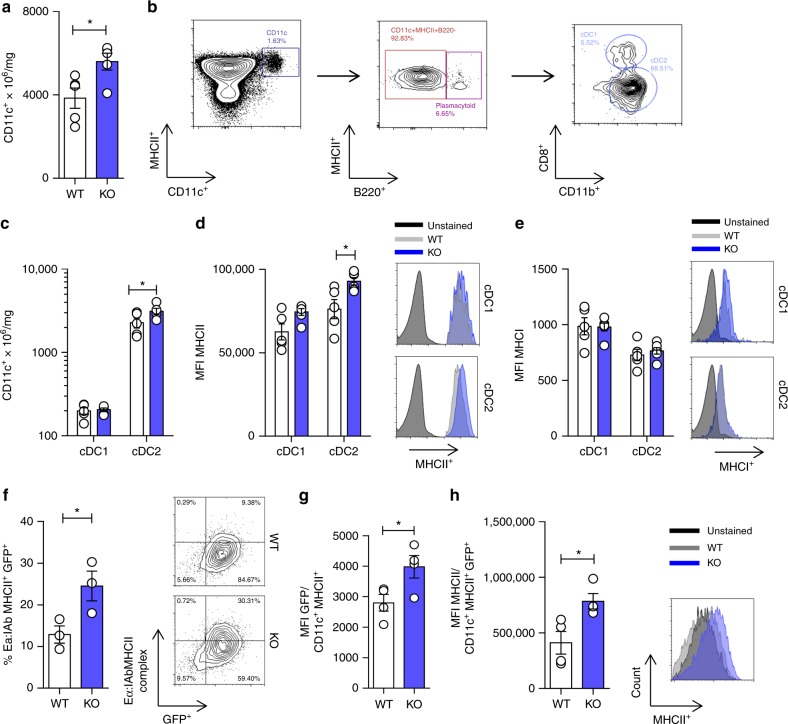
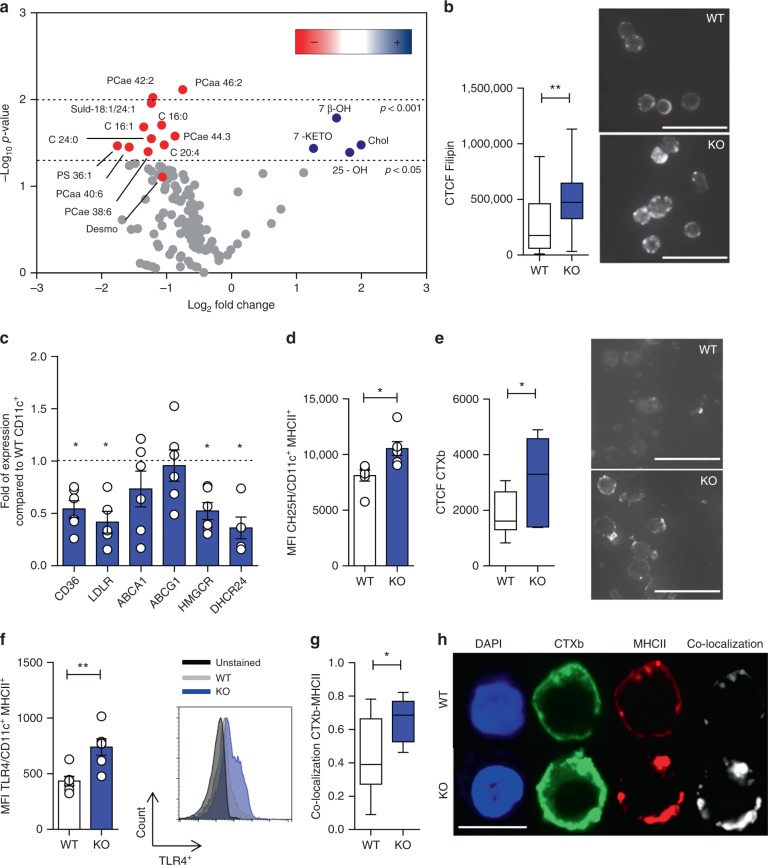
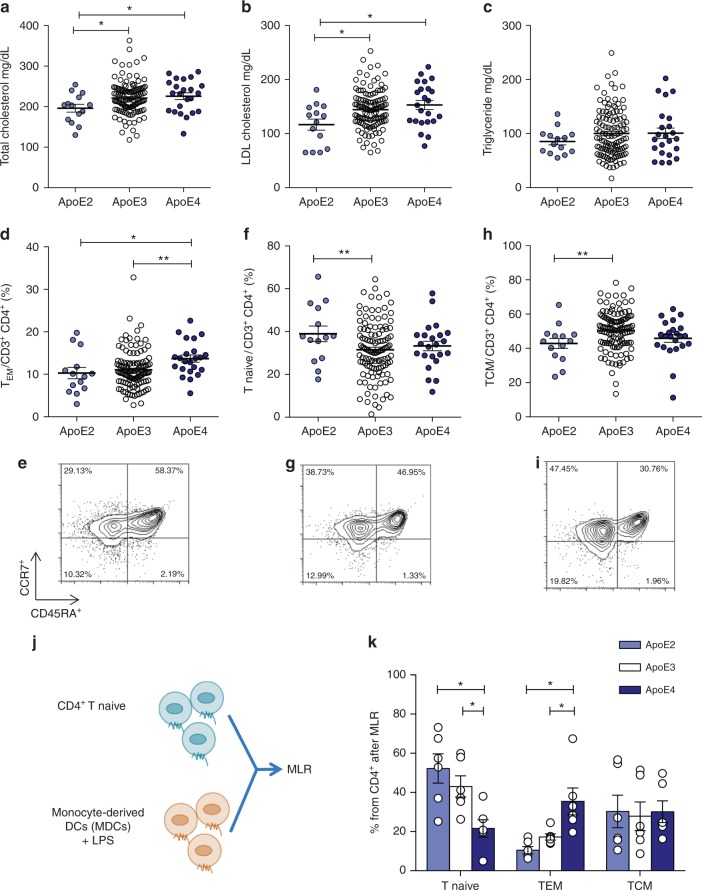
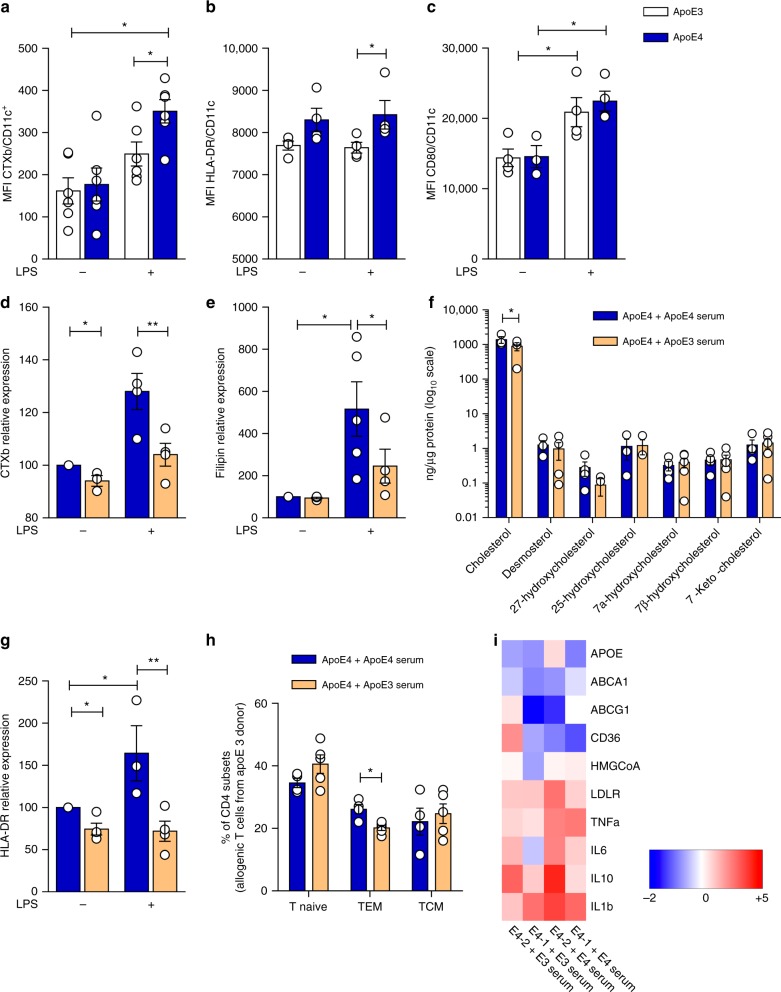
Cholesterol homeostasis has a pivotal function in regulating immune cells. Here we show that apolipoprotein E (apoE) deficiency leads to the accumulation of cholesterol in the cell membrane of dendritic cells (DC), resulting in enhanced MHC-II-dependent antigen presentation and CD4+ T-cell activation. Results from WT and apoE KO bone marrow chimera suggest that apoE from cells of hematopoietic origin has immunomodulatory functions, regardless of the onset of hypercholesterolemia. Humans expressing apoE4 isoform (ε4/3-ε4/4) have increased circulating levels of activated T cells compared to those expressing WT apoE3 (ε3/3) or apoE2 isoform (ε2/3-ε2/2). This increase is caused by enhanced antigen-presentation by apoE4-expressing DCs, and is reversed when these DCs are incubated with serum containing WT apoE3. In summary, our study identifies myeloid-produced apoE as a key physiological modulator of DC antigen presentation function, paving the way for further explorations of apoE as a tool to improve the management of immune diseases.


Conflict of interest statement

The authors declare no competing interests.

Figures

Fig. 1
Fig. 1
ApoE deficiency promotes CD4+ T-cell activation and skin allograft rejection. ab Representative images (a) and percentage of spleen weight corrected for body weight (b) from WT and apoE KO mice. cd Frequency of CD4+ (c) and CD8+ (d) T-cells subsets in the spleen of WT and apoE KO mice. e Frequency of CD4+ and CD8+ activated CD44hi CXCR3+ T cells in the spleen of WT and apoE KO mice. f Graphic representation of a typical skin allograft transplantation experiment: a piece of tail skin from C57BL/6Kd donor was transplanted on the back of WT or apoE KO mice and graft survival was scored up to 3 weeks. g Graft survival following skin allotransplantation. Survival of less than 50% of the donor skin was recorded as rejection. h Number of CD4+ T cells infiltrating the lymph nodes (axillary and brachial) draining (dLNs) and (contra-lateral inguinal) non-draining (ndLNs) the graft, corrected for LNs weight. ij Number of activated CD4+ T cells CD44hi (i) and CD44hi CXCR3+ (j) in the dLNs after allograft rejection; representative dot plots are shown. kl Migratory response of T lymphocytes isolated from draining lymph nodes, after allograft rejection, to the chemokines CXCL10 (k) and CCL19/21 (l) measured by transwell. N = 4 (gl) or 6 (ae) per group. Statistical analysis was performed with unpaired T-test (b, i, j), Gehan-Breslow-Wilcoxon test (g) and two-way Anova (ce, h, k, l). Data are reported as mean ± SEM; *p < 0.05, **p < 0.01
Fig. 2
Fig. 2
Hematopoietic deficiency of apoE promotes allograft rejection and allogenic T-cell expansion. a Graphic representation of skin allograft transplantation experiment: a piece of tail skin from C57BL/6Kd donor was transplanted on the back of bone marrow transplanted (BMT) WT and apoE KO (BMT) mice; graft survival was scored up to 3 weeks. b Percentage of graft survival following skin allotransplantation in BMT mice. Survival of <50% of the donor skin was recorded as rejection. c Plasma cholesterol determination (mg/dL) after allograft rejection in BMT mice. d FPLC profiles of cholesterol distribution in the different lipoprotein subclasses (VLDL, LDL and HDL) from pooled plasma of grafted BMT mice (n = 4 for each group). e and g Proliferation of CD4+ (e) and CD8+ (g) lymphocytes isolated from draining lymph nodes of BMT-grafted mice, determined as Ki67+ staining following challenge with splenocytes isolated from C57BL/6Kd donor. f and h Polarization of CD4+ (f) and CD8+ (h) lymphocytes isolated from draining lymph nodes of BMT-grafted mice toward TEM subset after challenge with splenocytes isolated from C57BL/6Kd donor. N = 4 per group. Statistical analysis was performed with Gehan-Breslow-Wilcoxon test (b) and two-way Anova (c, eh). Data are reported as mean ± SEM; *p < 0.05, **p < 0.01
Fig. 3
Fig. 3
ApoE regulates DC activation. a mRNA expression relative to RPL (L Ribosomal Protein) of apoE in the liver, resident peritoneal macrophages (MAC), spleen-derived DCs (CD11c+), bone marrow derived DCs (immature iBMDCs and mature mBMDCs) and T cells (CD3+) of WT animals. b representative histogram showing apoE protein determination through flow cytometry in T cells (CD4+ and CD8+), macrophages (F4/80+ MHCII+) and DCs (CD11c+ MHCII+) of WT mice. ce Proliferation of allogenic BALB/c CD4+ (c) and CD8+ (d) T cells with spleen-derived DCs from WT and apoE KO C57BL/6 mice; representative histograms are presented in e. fh Proliferation of transgenic OTII CD4+ (f) and OTI CD8+ (g) T cells with BMDCs isolated from WT and apoE KO mice and pulsed with OTII or OTI peptide; representative histograms are presented in h. i Graphic representation of skin allograft transplantation: a piece of tail skin from a C57BL/6 male donor either WT or apoE KO was transplanted on the back of WT female mice; graft survival was scored up to 100 days. j Percentage of graft survival following skin transplantation. Graft survival of <50% of the donor skin was recorded as rejection. N = 3 (in triplicates cd), N = 4 (a), N = 6 (fg), N = 8 (j) per group. Statistical analysis was performed with unpaired T-test (a, c, d, f, g), Gehan-Breslow-Wilcoxon test (j). Data are reported as mean ± SEM; *p < 0.05, **p < 0.01
Fig. 4
Fig. 4
ApoE deficiency alters the phenotype of spleen-derived DCs. a Number of CD11c+ from WT and apoE KO spleen normalized by spleen weight. b Gating strategy for DC subsets phenotyping. c Number of cDC1 (CD11c+MHCII+B220-CD11bCD8+) and cDC2 (CD11c+MHCII+B220CD11b+CD8) corrected for spleen weight of WT or apoE KO mice. d Median fluorescence intensity (MFI) of MHCII in cDC1s and cDC2s from WT or apoE KO mice; representative histograms are shown. e Median fluorescence intensity (MFI) of MHCI in cDC1s and cDC2s from WT or apoE KO mice; representative histograms are shown. f Percentage of double positive GFP+/Eα:I MHCII+ BMDCs after in vitro antigen uptake and presentation assay with Eα peptide; representative contour plots are shown. g-h Median fluorescence intensity (MFI) of GFP (h) and MHCII (i) in DCs after in vivo antigen uptake and presentation assay with Eα peptide; representative contour plots and histograms are presented. N = 3 (f), N = 4 (gh), N = 5 (ae) per group. Statistical analysis was performed with unpaired T-test. Data are reported as mean ± SEM; *p < 0.05
Fig. 5
Fig. 5
ApoE deficiency affects lipid composition of DCs. a Volcano plot from extensive lipidomic analysis (fatty acids, phospholipids and oxysterols) in purified CD11c+ DCs isolated from the spleen of WT or apoE KO mice. The volcano plot correlates fold-change expression (expressed as log2) and significance between two groups (WT vs. apoE KO), using a scatter plot view. The y-axis is the negative log10 of p-values (a higher value indicates greater significance as indicated by dashed lines) and the x-axis is the difference in levels of metabolites between two experimental groups. Metabolites which are significantly increased are shown by blue dots while red dots represent those decreased. b Total cell fluorescence (CTCF) of free cholesterol (filipin staining) in purified CD11c+ DCs isolated from the spleen of WT or apoE KO mice, calculated with ImageJ software; representative pictures are shown (×20 magnification, scale bar 25 µm). c Expression of CD36, LDLR, ABCA1, ABCG1, HMGCR and DHCR24 mRNA by purified CD11c+ DCs isolated from the spleen of WT or apoE KO mice. d Mean fluorescence intensity (MFI) of CH25H in CD11c+ MHCII+ DCs of WT and apoE KO determined by flow cytometry. e Total cell fluorescence (CTCF) of lipid rafts (CTXb) in purified CD11c+ DCs isolated from the spleen of WT or apoE KO mice, calculated with ImageJ software; representative pictures are presented (×20 magnification, scale bar 25 µm). f Median fluorescence intensity (MFI) of TLR4 expression in CD11c+ MHCII+ DCs of WT and apoE KO determined by flow cytometry; representative histograms are shown. g and h Pearson’s correlation coefficient between lipid rafts (CTXb) and MHCII calculated with ImageJ software (g) in purified CD11c+ DCs isolated from the spleen of WT or apoE KO mice; representative pictures from confocal microscopy staining for CTXb (green), MHCII (red) and DAPI (nucleus, blu) are presented in h (×63 magnification, scale bar 10 µm). N = 4 (a, b, e) and N = 6 (c, d, fh) per group. Statistical analysis was performed with unpaired T-test. Data are reported as mean ± SEM; box and whiskers shown min to max values; *p < 0.05, **p < 0.01
Fig. 6
Fig. 6
Human carriers of apoE4 isoform present a more activated immune profile as compared to carriers of the wild-type apoE3 isoform. ac Plasma levels of total cholesterol (a), LDL-cholesterol (b) and triglycerides (c) from human carriers of apoE isoforms. di Percentage of circulating TEM (CD45RA-CCR7lo) (d), Tnaive (CD45RA + CCR7hi) (f) and TCM (CD45RA-CCR7hi) (h) CD4+ in carriers of the different apoE isoforms; representative dot plots are reported (e, g, i). j Graphic representation of mixed lymphocyte reaction (MLR) by CD4+ T naïve cells stimulated with monocyte-derived DCs (MDCs) pulsed with LPS (1 µg/mL for 2 days) from human carriers of apoE isoforms. k Polarization of CD4+ T cells after MLR between mature MDCs and syngenic T naive cells. N = 6 per group (k). Statistical analysis was performed with two-way Anova. Data are reported as mean ± SEM; *p < 0.05, **p < 0.01
Fig. 7
Fig. 7
Lowering cellular cholesterol rescues the phenotype of apoE4 MDCs. ac Median fluorescence intensity (MFI) of lipid rafts (CTXb, a), HLA-DR (b), CD80 (c) in immature (LPS−) and mature (LPS+) MDCs. d and e Relative quantification of lipid rafts (CTXb, d) and free cholesterol (filipin, e) in immature (LPS−) or mature (LPS+) apoE4 MDCs cultured with serum derived from an allogenic apoE4 donor as compared to an apoE3 donor. Data are presented as relative expression compared to immature apoE4 MDCs cultured with serum from an allogenic apoE4 donor. f Determination (ng/µg) of sterols and oxysterols by gas chromatography-mass spectrometry of mature (LPS+) apoE4 MDCs cultured with serum from an allogenic apoE4 or apoE3 donor. g Relative expression of HLA-DR in immature (LPS−) or mature (LPS+) apoE4 MDCs cultured with serum derived from an apoE4 donor as compared to immature (LPS−) apoE4 MDCs cultured with serum from an apoE4 donor; data are presented as relative expression (calculated from HLA-DR+ cells) compared to immature apoE4 MDCs cultured with serum from an apoE4 donor. h Differentiation of CD4+ T naive cells from a carrier of apoE3 isoform with allogenic mature (LPS+) apoE4 MDCs cultured with serum from an apoE4 or apoE3 donor. i Heat-map of lipid-related and inflammatory genes in mature (LPS+) MDCs from apoE4 carriers cultured in the presence of serum from allogenic apoE4 or an apoE3 donor; data are presented as relative to mean expression in apoE3 DCs (log2 scale). N = 4–6 per group. Statistical analysis was performed with two-way Anova. Data are reported as mean ± SEM; *p < 0.05, **p < 0.01

References

    1. Norata GD, et al. The cellular and molecular basis of translational immunometabolism. Immunity. 2015;43:421–434. doi: 10.1016/j.immuni.2015.08.023. - DOI - PubMed
    1. O’Neill LA, Pearce EJ. Immunometabolism governs dendritic cell and macrophage function. J. Exp. Med. 2016;213:15–23. doi: 10.1084/jem.20151570. - DOI - PMC - PubMed
    1. York AG, et al. Limiting cholesterol biosynthetic flux spontaneously engages type I IFN signaling. Cell. 2015;163:1716–1729. doi: 10.1016/j.cell.2015.11.045. - DOI - PMC - PubMed
    1. Yang W, et al. Potentiating the antitumour response of CD8(+) T cells by modulating cholesterol metabolism. Nature. 2016;531:651–655. doi: 10.1038/nature17412. - DOI - PMC - PubMed
    1. Ito A, et al. Cholesterol accumulation in CD11c+ immune cells is a causal and targetable factor in autoimmune disease. Immunity. 2016;45:1311–1326. doi: 10.1016/j.immuni.2016.11.008. - DOI - PMC - PubMed

Publication types

MeSH terms