. 2018 Aug 6;9(1):3117.
doi: 10.1038/s41467-018-05544-3.

Potential-induced nanoclustering of metallic catalysts during electrochemical CO2 reduction

Affiliations

Potential-induced nanoclustering of metallic catalysts during electrochemical CO2 reduction

Jianfeng Huang et al. Nat Commun. .

Abstract

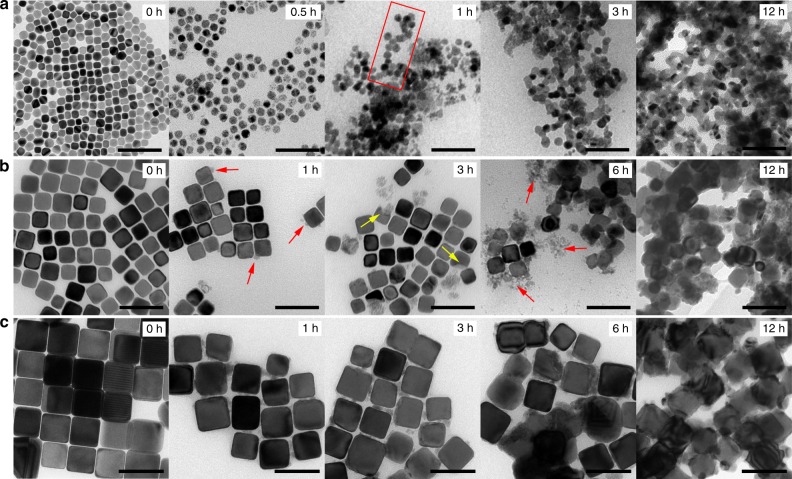
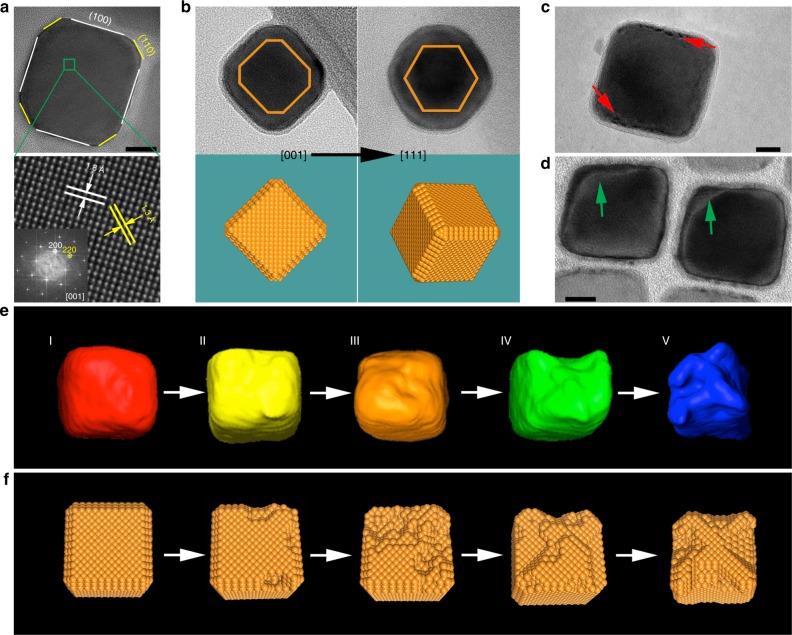
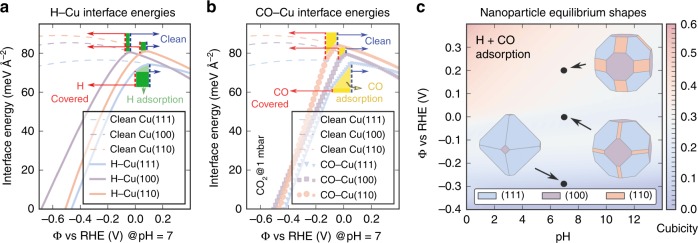
In catalysis science stability is as crucial as activity and selectivity. Understanding the degradation pathways occurring during operation and developing mitigation strategies will eventually improve catalyst design, thus facilitating the translation of basic science to technological applications. Herein, we reveal the unique and general degradation mechanism of metallic nanocatalysts during electrochemical CO2 reduction, exemplified by different sized copper nanocubes. We follow their morphological evolution during operation and correlate it with the electrocatalytic performance. In contrast with the most common coalescence and dissolution/precipitation mechanisms, we find a potential-driven nanoclustering to be the predominant degradation pathway. Grand-potential density functional theory calculations confirm the role of the negative potential applied to reduce CO2 as the main driving force for the clustering. This study offers a novel outlook on future investigations of stability and degradation reaction mechanisms of nanocatalysts in electrochemical CO2 reduction and, more generally, in electroreduction reactions.


Conflict of interest statement

The authors declare no competing interests.

Figures

Fig. 1
Fig. 1
Morphological evolution of the CuNCs during electrolysis. ac Representative CuNCs of three different sizes: a 16 nm, b 41 nm, and c 65 nm, imaged with TEM at different operation times. The rectangle in a encloses an aggregated assembly of particles. The red and yellow arrows in b indicate small clusters and broken CuNCs, respectively. Scale bars: 100 nm
Fig. 2
Fig. 2
Characterizations of the Cu nanoclusters formed during electrolysis. ae High-resolution HAADF-STEM images of a, b Cu nanoclusters (<3 nm) and ce Cu nanoparticles (~5 nm) formed from the 41 nm CuNCs during electrolysis for 4.5 h under CO2RR conditions. Circles in a, b, and c enclose regions containing nanoclusters and nanoparticles, respectively. e is a high-magnification view of the region boxed in d. f FFT of the HR-STEM image shown in e. Simulated electron diffraction pattern (blue rings: ring sampling diffraction planes; red spectrum: intensity profile) of Cu are included for reference. Scale bars: a 3 nm, b, c, e 5 nm, d 50 nm, and f 5 nm−1
Fig. 3
Fig. 3
Electrocatalytic performance over time of the CuNCs. ac Faradaic efficiency of gaseous products and current density from CuNCs of three different sizes: a 16 nm, b 41 nm, c 65 nm, collected during a 12 h-course of CO2RR. Shaded areas of each line show standard deviations from three independent measurements
Fig. 4
Fig. 4
Crystalline facets and degradation pathway. a Top, HR-TEM image of one 41 nm CuNC along the [001] crystallographic direction; Bottom, an enlarged view of the region marked in the top panel. The inset shows the fast Fourier transformation (FFT) of the HR-TEM image. b TEM images and corresponding morphological models of one CuNC along two crystallographic directions, [001] and [111], from left to right. c, d TEM image of one CuNC electrolyzed for c 1 h and d 3 h. The arrows point to the positions where the degradations take place. e Tomographic reconstruction of the CuNCs and f corresponding schematic morphological models at different stages during a 12 h-course of CO2RR. Scale bars: 10 nm
Fig. 5
Fig. 5
Theoretical DFT investigations. a, b Grand potential interface energies for a H-covered and b CO-covered Cu surfaces in aqueous solution. c pH and potential dependence of the Wulff-shape of Cu nanoparticles including H, CO, and mixed H + CO covered surfaces. Please note that the inaccuracy of our potential scale is around 0.3 V (see Supplementary Methods for details). The cubicity is defined as the relative contribution of Cu (100) surfaces to the Wulff-shape
Fig. 6
Fig. 6
Overview of the degradation mechanism of CuNCs during CO2RR. Schematic representation of the degradation mechanism that includes nanoclustering (Stage I) followed by a coalescence at a later stage (Stage II)

References

    1. Spori C, Kwan JTH, Bonakdarpour A, Wilkinson DP, Strasser P. The stability challenges of oxygen evolving catalysts: towards a common fundamental understanding and mitigation of catalyst degradation. Angew. Chem. Int. Ed. 2017;56:5994–6021. doi: 10.1002/anie.201608601. - DOI - PubMed
    1. Kondratenko EV, Mul G, Baltrusaitis J, Larrazábal GO, Pérez-Ramírez J. Status and perspectives of CO2 conversion into fuels and chemicals by catalytic, photocatalytic and electrocatalytic processes. Energy Environ. Sci. 2013;6:3112. doi: 10.1039/c3ee41272e. - DOI
    1. Peterson AA, Abild-Pedersen F, Studt F, Rossmeisl J, Nørskov JK. How copper catalyzes the electroreduction of carbon dioxide into hydrocarbon fuels. Energy Environ. Sci. 2010;3:1311. doi: 10.1039/c0ee00071j. - DOI
    1. Kuhl KP, et al. Electrocatalytic conversion of carbon dioxide to methane and methanol on transition metal surfaces. J. Am. Chem. Soc. 2014;136:14107–14113. doi: 10.1021/ja505791r. - DOI - PubMed
    1. Perez-Gallent E, Figueiredo MC, Calle-Vallejo F, Koper MT. Spectroscopic observation of a hydrogenated CO dimer intermediate during CO reduction on Cu(100) electrodes. Angew. Chem. Int. Ed. 2017;56:3621–3624. doi: 10.1002/anie.201700580. - DOI - PubMed

Publication types

LinkOut - more resources