. 2018 Sep;21(9):1251-1259.
doi: 10.1038/s41593-018-0195-0. Epub 2018 Aug 6.

Hierarchy of transcriptomic specialization across human cortex captured by structural neuroimaging topography

Affiliations

Hierarchy of transcriptomic specialization across human cortex captured by structural neuroimaging topography

Joshua B Burt et al. Nat Neurosci. 2018 Sep.

Abstract

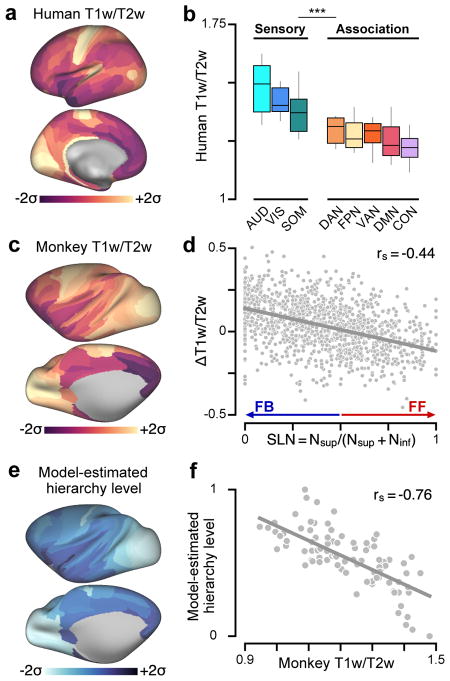
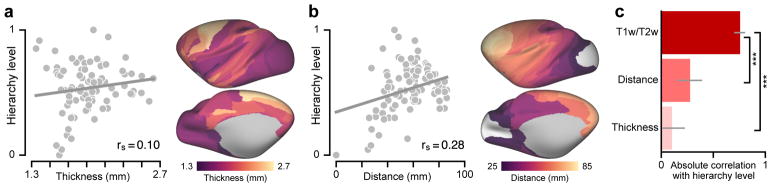
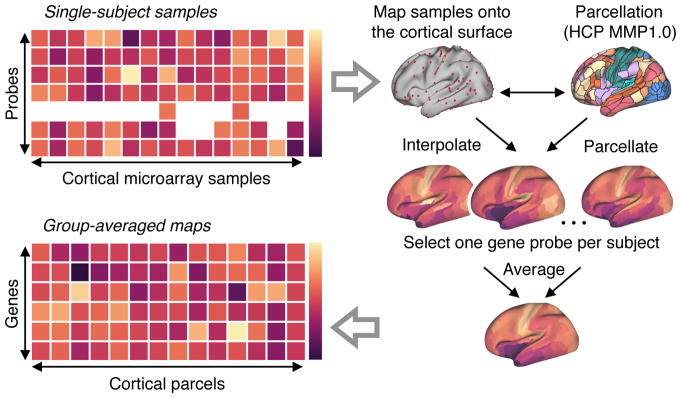
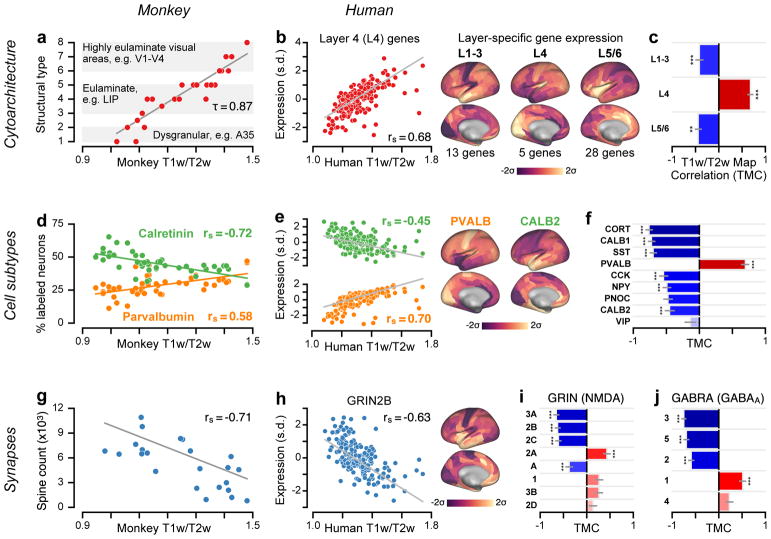
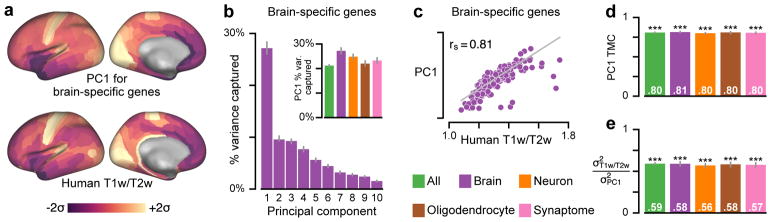
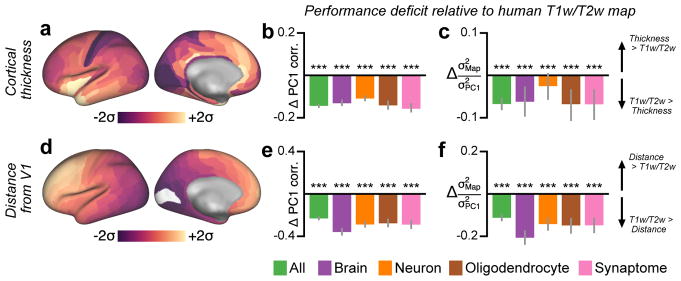
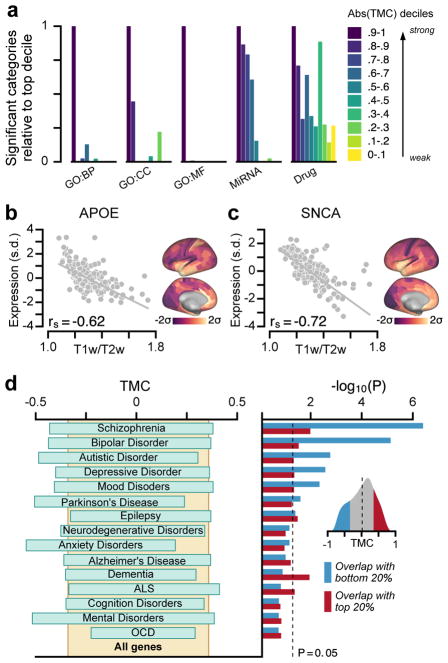
Hierarchy provides a unifying principle for the macroscale organization of anatomical and functional properties across primate cortex, yet microscale bases of specialization across human cortex are poorly understood. Anatomical hierarchy is conventionally informed by invasive tract-tracing measurements, creating a need for a principled proxy measure in humans. Moreover, cortex exhibits marked interareal variation in gene expression, yet organizing principles of cortical transcription remain unclear. We hypothesized that specialization of cortical microcircuitry involves hierarchical gradients of gene expression. We found that a noninvasive neuroimaging measure-MRI-derived T1-weighted/T2-weighted (T1w/T2w) mapping-reliably indexes anatomical hierarchy, and it captures the dominant pattern of transcriptional variation across human cortex. We found hierarchical gradients in expression profiles of genes related to microcircuit function, consistent with monkey microanatomy, and implicated in neuropsychiatric disorders. Our findings identify a hierarchical axis linking cortical transcription and anatomy, along which gradients of microscale properties may contribute to the macroscale specialization of cortical function.


Conflict of interest statement

Competing Financial Interests

The authors declare the following competing interests: This research was partly funded by BlackThorn Therapeutics. W.J.M. is an employee for BlackThorn Therapeutics. A.A. and J.D.M. are consultants for BlackThorn Therapeutics. W.J.M., A.A., and J.D.M. are co-inventors on a provisional patent application #62567087 related to using gene expression topography for predictive therapeutic applications.

Figures

Figure 1
Figure 1
T1w/T2w neuroimaging maps noninvasively capture the hierarchical organization of primate cortex. (a) The parcellated group-averaged (N=339) human T1w/T2w map exhibits high values in primary sensory cortical areas relative to association areas. (b) Human T1w/T2w map values are significantly lower in functionally defined association networks than in sensory networks (P < 10−5; two-sided Wilcoxon signed-rank test on N=6608 paired differences) (Supplementary Fig. 1c, d). Box plots mark the median and inner quartile ranges for areas in each network, and whiskers indicate the 95% confidence interval. (c) The parcellated group-averaged (N=19) macaque monkey T1w/T2w map topography is similar to that of the human. (d) Interareal variation in the T1w/T2w map correlates with the laminar specificity of directed feedforward (FF) and feedback (FB) projections in monkey cortex, as quantified by the fraction of labeled supragranular layer neurons (SLN) in the source area. High and low SLN correspond to FF and FB projection motifs, respectively. SLN significantly correlates with pairwise difference (target minus source) in areal T1w/T2w map values across N=1243 directed projections (rs = −0.44, P < 10−5; Spearman rank correlation). (e) Anatomical hierarchy levels across cortical areas are estimated by fitting a generalized linear model to predict projections’ SLNs as a function of pairwise hierarchical distance. (f) Model-estimated anatomical hierarchy levels are highly anti-correlated with T1w/T2w map values across N=89 areas of monkey cortex (rs = −0.76, P < 10−5). T1w/T2w map values and model-estimated hierarchy levels in panels a, c, and e are standardized (i.e., z-scored) and shown in units of standard deviations (σ) from the mean.
Figure 2
Figure 2
Model-estimated anatomical hierarchy in monkey cortex is better captured by the group-averaged T1w/T2w map than by two other candidate proxy measures derived from structural MRI. (a) Correlation between hierarchy and cortical thickness. (b) Correlation between hierarchy and geodesic distance from primary visual cortex (V1), which follows a rostro-caudal gradient. (c) Comparison of hierarchy correlation values for the T1w/T2w map, cortical thickness map, and map of geodesic distance from area V1. The T1w/T2w map is much more strongly correlated with model-estimated anatomical hierarchy than the other two maps (P < 10−5 for both maps). Grey lines mark the jackknife estimate of standard error. Statistical significance is calculated by a two-sided test of the difference between dependent correlations (*, P < 0.05; **, P < 10−2; ***, P < 10−3). Correlations and statistical significance values were computed across N=89 cortical areas.
Figure 3
Figure 3
Procedure for generating group-averaged parcellated maps of gene expression levels. All analyses of gene expression patterns used group-averaged parcellated expression maps derived from the Allen Human Brain Atlas (AHBA) (see Methods for details). The AHBA contains genes expression levels measured with DNA microarray probes and sampled from hundreds of neuroanatomical structures in the left hemisphere across six normal post-mortem human brains. First, cortical samples for each subject were mapped from volumetric space onto that subject’s native reconstructed two-dimensional cortical surface. Second, parcellated gene expression maps were constructed, for each subject, using the Human Connectome Project’s (HCP) Multi-Modal Parcellation (MMP1.0) of the left cortical surface into 180 contiguous areas. For genes profiled by multiple microarray probes, we selected a single representative probe for each subject. Finally, a group-level parcellated expression map for each unique gene was computed by averaging parcellated expression levels across subjects’ selected gene probes (see Methods).
Figure 4
Figure 4
Group-averaged T1w/T2w maps capture specialization of cortical microcircuitry in humans and nonhuman primates. (a) Cortical cytoarchitectural type is very strongly correlated with the macaque monkey T1w/T2w map across N=29 areas (τ = 0.87; P < 10−5; two-sided Kendall’s tau-b correlation) (rs = 0.96; P < 10−5; Spearman rank correlation). (b) The average expression map of 5 genes preferentially expressed in human granular layer 4 (L4) is positively correlated with the human cortical T1w/T2w map (rs = 0.68; P < 10−5; Spearman rank correlation), consistent with a more prominent granular L4 in sensory than association cortex. Expression is plotted in units of standard deviations (s.d.; σ) from the mean. (c) Average expression maps of laminar-specific genes show significant T1w/T2w map correlations (TMCs). L1–3: supragranular layers 1–3 (rs = −0.42; P < 10−5); L5/6: infragranular layers 5 and 6 (rs = −0.44; P = 2.49 * 10−3). (d) The T1w/T2w map captures areal variation in the relative proportions of calretinin- (rs = −0.72; P < 10−5) and parvalbumin-expressing (rs = 0.58; P = 1.7 * 10−5) inhibitory interneurons across N=47 areas of monkey cortex. (e) Genes coding for calretinin (CALB2; rs = −0.45; P < 10−5) and parvalbumin (PVALB; rs = 0.70; P < 10−5) exhibit homologous hierarchical gradients in human cortex. (f) TMCs of genes coding for markers of specific inhibitory interneuron cell types. (g) Basal-dendritic spine counts on pyramidal cells are significantly anti-correlated with the monkey T1w/T2w map across N=23 areas (rs = −0.71; P = 1.6 * 10−4). (h) The gene coding for the NMDA receptor subunit NR2B (GRIN2B) exhibits a negative TMC (rs = −0.63; P < 10−5). (i, j) TMCs of genes coding for distinct subunits of the excitatory NMDA receptor and inhibitory GABAA receptor. For comparison with monkey measurements in panels a, d, and g, Spearman rank correlations with model-estimated hierarchy levels (instead of T1w/T2w map values) were −0.92 for cytoarchitectural type; 0.72 (−0.77) for relative calretinin (parvalbumin) expressing interneuron proportion; and 0.78 for spine count. Statistical significance in panels c, f, i, and j is calculated using a spatial autoregressive model to account for spatial autocorrelation, Bonferroni-corrected by the number of genes in each set (*, P < 0.05; **, P < 10−2; ***, P < 10−3), and grey lines mark the jackknife estimate of standard error (see Methods).
Figure 5
Figure 5
The group-averaged T1w/T2w map captures the dominant axis of gene expression variation across human cortex. (a) The first principal component (PC1), here for a set of brain-specific genes, is the areal map that linearly captures the maximum variation in gene expression. Both maps are standardized (i.e., z-scored) and shown in units of standard deviations (σ) from the mean. (b) PC1 captures a large fraction of total gene expression variance. Inset: Variance captured by PC1 for five categorical gene sets: all genes, and genes preferentially expressed in brain, neurons, oligodendrocytes, and synaptic processes (see Methods). (c) PC1 for the brain-specific gene set is highly correlated with the T1w/T2w map (rs = 0.81; P < 10−5; Spearman rank correlation). (d) Across all sets, PC1 exhibits a highly similar areal topography to the T1w/T2w map (TMC range: 0.80–0.81; P < 10−5 for each). (e) Gene expression variance captured by the T1w/T2w map ( σT1w/T2w2) relative to PC1 ( σPC12). Statistical significance in panels d and e is calculated through permutation testing with surrogate maps that preserve spatial autocorrelation structure (*, P < 0.05; **, P < 10−2; ***, P < 10−3), and grey lines in panels b, d, and e mark the bootstrap estimated 95% confidence interval (see Methods).
Figure 6
Figure 6
Principal component analysis (PCA) shows that the dominant mode of gene expression variation (PC1) is better captured by the group-averaged T1w/T2w map than by other candidate proxies. (a) Parcellated group-averaged (N=339) map of human cortical thickness. (b) The difference in correlation with PC1 between the T1w/T2w map and the cortical thickness map, i.e., (rs(T1w/T2w, PC1) − rs(Thickness, PC1)), across several categorical gene sets. Negative values indicate that the T1w/T2w map is more strongly correlated with PC1 than is the thickness map. (c) The difference in the fraction of gene expression variance captured, relative to the variance captured by PC1, between the T1w/T2w map and the cortical thickness map, i.e., (σT1w/T2w2-σThickness2)/σPC12, across several categorical gene sets. Negative values indicate that the T1w/T2w map captures more gene expression variance than does the thickness map. (d) Parcellated map of geodesic distance from primary visual cortical area V1. Maps in panels a and d are standardized (i.e., z-scored) and shown in units of standard deviations (σ) from the mean. (e) The difference in correlation with PC1 between the T1w/T2w map and the map of distance from area V1. (f) The difference in the fraction of gene expression variance captured, relative to the variance captured by PC1, between the T1w/T2w map and the map of distance from V1. Statistical significance in panels b and e is calculated by a two-sided test of the difference between dependent correlations (N=180), and in panels c and f, through permutation testing with surrogate maps that preserve spatial autocorrelation structure (*, P < 0.05; **, P < 10−2; ***, P < 10−3). Grey lines in panels b, c, e, and f mark the bootstrap estimated 95% confidence interval.
Figure 7
Figure 7
Expression profiles of genes which exhibit strong hierarchical gradients tend to be relatively stable across individuals. (a) Differential stability across cortex (DSC), defined as the mean pairwise Spearman rank correlation between subjects’ cortical gene expression maps, as a function of the magnitude of the T1w/T2w map correlation (TMC) for all 16088 genes (rs = 0.66, P < 10−5; Spearman rank correlation). Each gray dot represents a single gene. The black line indicates the average value in a sliding window of size 600 points. (b) Filtering genes by a threshold on DSC alters the shape of the TMC distribution. Increasing the DSC threshold filters out genes whose cortical expression profiles are not relatively consistent across subjects. The trough which develops near TMC=0 suggests that high-DSC genes preferentially exhibit strong hierarchical gradients. (c) Thresholding genes by DSC substantially increases variance captured by the first principal component (PC1) of gene expression variation (blue), whereas it has little effect on PC1’s TMC (red). Shaded regions in panels b and c mark the bootstrap estimated 95% confidence interval. Number of genes which exceed each DSC threshold: 0, 14509; 0.025, 12169; 0.05, 9494; 0.075, 7332; 0.1, 5853.
Figure 8
Figure 8
Hierarchical variation relates to enrichment in neurobiological function and brain disorders. (a) Genes with strong TMCs are overrepresented in functional annotations across multiple gene ontologies (GOs). BP, biological process; CC, cellular component; MF, molecular function; MiRNA, microRNA binding sites; Drug, drug targets. (b, c) Two key risk genes for neurodegenerative disorders, APOE for Alzheimer’s disease and SNCA for Parkinson’s disease, exhibit strongly negative TMCs, with higher expression levels in association cortex relative to sensory cortex (APOE: rs = −0.62, P < 10−5; SNCA: rs = −0.72, P < 10−5; Spearman rank correlation). APOE is a leading risk gene for Alzheimer’s disease. The ε4 allele of APOE is the largest genetic risk factor for late-onset Alzheimer’s disease. SNCA (PARK1/PARK4) is a key risk gene for Parkinson’s disease. Duplication of SNCA is risk factor for familial Parkinson’s disease with dominant inheritance. SNCA codes for the alpha-synuclein protein which is the primary component of Lewy bodies, a biomarker of Parkinson’s disease. (d) Genes with strong negative TMCs are overrepresented in multiple gene sets associated with neuropsychiatric disorders. Left: 20–80% percentile range of TMCs for each disease gene set. Right: Enrichment is quantified by the hypergeometric test, which assesses the statistical significance of overlap between each gene set and the top (red) or bottom (blue) 20% TMC genes. Inset: Distribution of TMCs across all genes. Expression in panels b and c is plotted in units of standard deviations (s.d.; σ) from the mean for each map.

References

    1. Lennie P. Single units and visual cortical organization. Perception. 1998;27:889–935. - PubMed
    1. Hasson U, Yang E, Vallines I, Heeger DJ, Rubin N. A hierarchy of temporal receptive windows in human cortex. J Neurosci. 2008;28:2539–2550. - PMC - PubMed
    1. Lerner Y, Honey CJ, Silbert LJ, Hasson U. Topographic mapping of a hierarchy of temporal receptive windows using a narrated story. J Neurosci. 2011;31:2906–15. - PMC - PubMed
    1. Murray JD, et al. A hierarchy of intrinsic timescales across primate cortex. Nat Neurosci. 2014;17:1661–3. - PMC - PubMed
    1. Honey CJ, et al. Slow cortical dynamics and the accumulation of information over long timescales. Neuron. 2012;76:423–434. - PMC - PubMed

Publication types