. 2018 Nov 1;526(16):2585-2611.
doi: 10.1002/cne.24512. Epub 2018 Oct 18.

Neuroarchitecture of the Drosophila central complex: A catalog of nodulus and asymmetrical body neurons and a revision of the protocerebral bridge catalog

Affiliations

Neuroarchitecture of the Drosophila central complex: A catalog of nodulus and asymmetrical body neurons and a revision of the protocerebral bridge catalog

Tanya Wolff et al. J Comp Neurol. .

Abstract

The central complex, a set of neuropils in the center of the insect brain, plays a crucial role in spatial aspects of sensory integration and motor control. Stereotyped neurons interconnect these neuropils with one another and with accessory structures. We screened over 5,000 Drosophila melanogaster GAL4 lines for expression in two neuropils, the noduli (NO) of the central complex and the asymmetrical body (AB), and used multicolor stochastic labeling to analyze the morphology, polarity, and organization of individual cells in a subset of the GAL4 lines that showed expression in these neuropils. We identified nine NO and three AB cell types and describe them here. The morphology of the NO neurons suggests that they receive input primarily in the lateral accessory lobe and send output to each of the six paired noduli. We demonstrate that the AB is a bilateral structure which exhibits asymmetry in size between the left and right bodies. We show that the AB neurons directly connect the AB to the central complex and accessory neuropils, that they target both the left and right ABs, and that one cell type preferentially innervates the right AB. We propose that the AB be considered a central complex neuropil in Drosophila. Finally, we present highly restricted GAL4 lines for most identified protocerebral bridge, NO, and AB cell types. These lines, generated using the split-GAL4 method, will facilitate anatomical studies, behavioral assays, and physiological experiments.

Keywords: AB_1549585; AB_1625981; AB_2314866; AB_915420; Drosophila brain; GAL4; MCFO; asymmetrical body; central complex; nodulus; protocerebral bridge.


Figures

Figure 1
Figure 1
The central complex and accessory neuropils. (a) Neuropils of the central complex and accessory regions. Frontal view as seen from the anterior. Neuropil masks were created in FluoRender (https://bmcbioinformatics.biomedcentral.com/articles/10.1186/s12859-017-1694-9 or (Wan, Otsuna, Chien, & Hansen, 2009, 2012) and were aligned in the JRC 2013 brain. The color coding is as follows. PB: dark blue; FB = green; EB = orange; NO = teal; AB = rose (dorsal to NO); LAL = lilac; GA = burgundy (“shoulders” of LAL); crepine (CRE) = light blue; round body (ROB) = yellow; brain = gray. Scale bar = 20 μ. (b) Frontal (left) and sagittal (right) views of central complex neuropils. Anterior is to the right in the sagittal view. PB = purple; FB = green, EB = orange; NO = cyan; AB = rose. Scale bar = 20 μ. (c) The same images as shown in (b), with the PB and EB removed to better visualize the location of the AB (rose). Scale bar = 20 μ. (d) Sagittal view of one set of noduli. The dorsal nodulus, NO1 (1), is not horizontally segmented. The medial nodulus, NO2, has two subcompartments, dorsal (D) and ventral (V). The ventral nodulus, NO3, has three subcompartments, anterior (A), medial (M), and posterior (P)
Figure 2
Figure 2
Expression patterns of PB, NO, and AB split‐GAL4 lines in brain and VNC. Expression of 20xUAS‐CsChrimson‐mVenus (insertion in attP18; labeled with anti‐GFP antibody, green) driven by split‐GAL4 lines indicated in panels. Neuropil was visualized using anti‐Brp, shown in magenta. The sparsest lines for each cell type are shown. Confocal stacks for these and additional lines noted in Table 2 can be viewed and lines can be ordered at http://www.janelia.org/split-GAL4. This website will be updated with additional clean lines as they become available. Scale bar = 100 μ
Figure 3
Figure 3
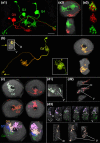
Nodulus neurons. (a) LAL.s‐GAi.s‐NO1i.b, the only NO1 neuron identified to date. The arbors in the GA and LAL are predominantly input, populate the entire gall (length is highlighted by green line) and just the lateral margin of the LAL. Inset, sagittal view of noduli. NO1, the dorsal nodulus, receives the output from this neuron. GA = gall. Scale bar = 30 μ. [MCFO image from line R76E11]. (b) LAL.s‐NO2i.b neuron. The LAL arbor is more robust than the NO1 cell shown in (a). Inset, both dorsal and ventral compartments of NO2, the medial nodulus, are filled with boutons. Scale bar = 20 μ [MCFO image from line R41H08]. (c) LAL.s‐GAi.s‐CREi.s‐NO2i.b‐FBℓ3i.b‐CREi.b neuron. The presumed output arbor in the crepine is substantial whereas just a few fine, thin terminals project into a different region of this neuropil and represent apparent offshoots from the LAL arbor, which tracks primarily along the lateral margin. The GA arbor fills both domains of the GA. CRE = crepine. Scale bar = 20 μ [MCFO image from line SS04682]. (d) LAL.s‐GAi.s‐CREi.s‐NO2i.b‐FBℓ3.b neuron. The FB arbor most likely should extend the full span of FBℓ3. The CRE arbor in this cell is similar to the input CRE arbor of the cell in (c) in that it is minimal and appears to extend from the more elaborate LAL arbor. CRE = crepine; WED = wedge. Scale bar = 20 μ [MCFO image from line SS04682]. (e) LAL.s‐NO2i.b‐SCLi.b‐CREc.b neuron. Minimal fine terminals extend into the GA and only one bouton populates the contralateral CRE. SCL = superior clamp. Scale bar = 20 μ. [MCFO image from line SS04682]. (f) LAL.s‐GAi.s‐NO2i.b‐FBℓ3i.b‐LALi.b neuron. Either the FB arbor is columnar or it is also artificially truncated, as is expected to be the case with the neuron shown in panel d. Scale bar = 20 μ [MCFO image from line SS04682]. (g) LAL.s‐NO3Ai.b neuron. This LAL arbor's flocculent texture distinguishes it from the other NO neurons. Inset, as indicated by the cell's name, only the anterior compartment of NO3 (NO3A) is targeted by this cell. Scale bar = 20 μ [MCFO image from line R12G04]. (h) LAL.s‐CREi.s‐NO3P/Mi.b neuron. The distribution of the spiny arbor is widespread throughout the LAL and reaches into the CRE, which lies anterior to the bulk of the LAL arbor and is therefore not identified in the figure. As with all of the NO cell types described here, the nodulus arbor is predominantly composed of boutons, and, in this case, fills both the medial and posterior NO3 compartments, as shown in the inset. The asterisk identifies NO3A in the inset. Scale bar = 20 μ [MCFO image from line SS04689]. (i) This LAL.s‐CREc.s‐NO3Pc.b neuron is unique among the identified NO neurons in that it crosses the midline between the LAL and NO. It is from the same brain as the neuron shown in (h); both neurons are shown in left inset. The distinction between these two neurons, particularly the ipsilateral versus contralateral circuitry, is evident in the left inset. Right inset illustrates this neuron's absence from NO3M [note the gap between the filled NO3P neuropil and NO3A, marked by an asterisk, a gap that is filled with the yellow arbor in the inset in (h)]. Scale bar = 20 μ [MCFO image from line SS04689]
Figure 4
Figure 4
Registered images of NO cell types. Examples of the five most commonly seen NO neurons were aligned to standard brain JRC2013 and rendered in three dimension using FluoRender (https://bmcbioinformatics.biomedcentral.com/articles/10.1186/s12859-017-1694-9; (Wan et al., 2009, 2012). FB = green; NO = cyan; GA = maroon; LAL = lilac; CRE = blue. Scale bar = 20 μ. (a) LAL.s‐GAi.s‐NO1i.b. (b) LAL.s‐NO2i.b. (c) LAL.s‐NO3Ai.b. (d) LAL.s‐CREi.s‐NO3P/Mi.b. As noted above (Figure 3H), the minimal fine terminals that arborize in the crepine are not visible from this angle. (e) LAL.s‐CREc.s‐NO3Pc.b
Figure 5
Figure 5
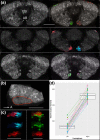
The asymmetrical body is a bilateral and asymmetric structure. (a) Confocal images illustrate the asymmetrical body is a bilateral structure and that the fly's right AB (on right in figure) is larger than its left AB. Frontal sections through the FB and EB from three brains are shown. The reference channel (anti‐Brp) is shown in the left panel of each set and the corresponding signal (neuron) channels are shown in the right panels. The signal channels identify the AB neuropils and demonstrate that both the left and right ABs are innervated. FB = fan‐shaped body; EB = ellipsoid body; AB = asymmetrical bodies. Scale bar = 20 μ [MCFO images from lines SS00241 and R41H08]. (b) The AB, outlined in red, is oblong in shape and is nestled ventral to teeth 2, 3, and 4 of the FB (see Wolff et al., 2015 for description of FB teeth). This sagittal view illustrates the length of the right AB. Scale bar = 10 μ. (c) The AB may be a compartmentalized structure. Two instances are shown in which the asymmetrical body is targeted by two neurons with nonoverlapping arbors (sagittal view). Neuron types are described in detail below. The arbors are shown together (top) and separately (middle and lower panels). In the left series of photos, AB.s.b‐FBℓ1c.b‐FBℓ8c.b (blue) and AB.s.b‐FBℓ8i.b (red) neurons occupy adjacent regions of the AB. Scale bar = 20 μ. In the right panel, AB.s.b‐FBℓ1i.b‐FBℓ8i.b and AB.s.b‐FBℓ1c.b‐FBℓ8c.b target nonoverlapping dorsal and ventral regions of the AB. Scale bar = 20 μ [MCFO images from line VT020016]. (d) Paired dot plot of left and right AB volumes (measured in μ3) overlaid on a box plot. While there is a great deal of variability in AB volume both between brains and between hemispheres, the left AB is consistently on average 25% of the volume of the right AB, but ranged from 10 to 53%
Figure 6
Figure 6
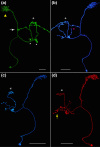
SLP‐AB neuron. This neuron exhibits a bias toward the right AB and comes in three forms. Arrows indicate the midline in each panel. (a) SLP.s‐ABi.b is the ipsilateral version with predominantly fine terminals in the SLP and boutons in the AB. Scale bar = 30 μ [MCFO image from line VT016127]. (b) SLP.s‐ABc.b is the contralateral form that only targets the right AB and therefore always the left SLP. The polarity is the same as described in a, above. Scale bar = 30 μ [MCFO image from line VT016127]. (c) SLP.s‐ABic.b, the dually innervated form. Apparent input from either the left or right SLP is delivered to both the left and right AB. Scale bar = 30 μ [MCFO image from line SS04458]
Figure 7
Figure 7
Registered images of AB neurons. Selected representative AB neurons were aligned to a standard brain (JRC2013) and rendered in three dimensions using the FluoRender software (https://bmcbioinformatics.biomedcentral.com/articles/10.1186/s12859-017-1694-9). Scale bar = 20 μ. (a1) SLP.s‐ABi.b. (a2) SLP.s‐ABc.b. (a3) SLP.s‐ABic.b. (b1) AB.s.b‐FBℓ8i.b. (b2) AB.s.b‐FBℓ8i.b‐FBℓ8c.b. (c) SLP.s‐ABic.b‐FBℓ8.b
Figure 8
Figure 8
AB‐FBℓ8 neuron family. Three recurring forms of this family have been seen, and it seems likely additional subtly distinct forms exist. The common themes among members of this family are the mixed terminals in the AB, boutons in FBℓ8, and columnar arbors in the FB. (a) The “basic form” that defines this family: AB.s.b‐FBℓ8i.b. The cell shown here arborizes in the left AB. Inset: AB; note the presence of spines and boutons. Scale bar = 20 μ MCFO image from line SS02718. (b) The basic form shown in panel a plus a sparsely populated FBℓ1 and two, adjacent arbors in layer 8 of the FB: AB.S.B‐FBℓ1i.b‐FBℓ8i.b‐FBℓ8c.b. This neuron was rotated to enable the various arbors to be distinguished from one another. The FBℓ1 arbors are minimal, often just a single bouton or spine and rarely as many as five boutons. The AB and FBℓ1 arbors are virtually always in the same hemisphere. All asterisks identify boutons in FBℓ1; the yellow asterisk corresponds to the arbor in FBℓ1 in the inset. Arrow identifies the left AB. Scale bar = 20 μ [MCFO image from line SS02738]. (c) This family member, AB.s.b‐FBℓ8i.b‐FBℓ8c.b, projects two separate FBℓ8 arbors, one to each hemisphere, and one mixed arbor to the left AB. Scale bar = 20 μ [MCFO image from line SS00241]
Figure 9
Figure 9
SLP‐AB‐FBℓ8 family. The range of overlapping phenotypes seen in this set of neurons links them together as a family. All neurons in the family exhibit spiny arbors in the SLP, boutons in one or both ABs, and boutons in FBℓ8. Additional neurites decorated with boutons project into various layers of the FB, and examples shown are named to reflect these features, although there are likely so many subtly different forms that the generic “SLP‐AB‐FBℓ8” neuron is more practical. White asterisks indicate midline. (a) The minimal features of this family of neurons are displayed by this SLP.s‐ABic.b‐FBℓ8.b neuron. Yellow arrowhead = SLP; white arrowheads = ABs; white arrow = FBℓ8. Scale bar = 20 μ [MCFO image from line SS02922]. (b) Additional boutons populate several FB layers, including layers 1, 4, 5, and 8 (e.g., red asterisk) in this family member. The characteristic thin fibers in the SLP are evident. Scale bar = 30 μ [MCFO image from VT060202]. (c) This SLPi.s‐AB.b‐FBℓ1.b‐FBℓ8.b neuron illustrates the more restricted FBℓ8 arbor described in the text. Scale bar = 40 μ [MCFO image from line VT060202]. (d) SLP.s‐ABi.b‐FBℓ1.b‐FBℓ2.b‐FBℓ5.b‐FBℓ8.b also has an FBℓ8 arbor that is constrained to the midline (white asterisk, which also identifies midline) and a more extensive FBℓ1 (yellow arrow). Scale bar = 30 μ [MCFO image from line SS04423]
Figure 10
Figure 10
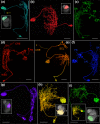
Overview of an octopaminergic‐like family of cells that innervate the PB. The arbors of this neuron family are broadly distributed throughout the brain and resemble previously described octopaminergic neurons (Aso et al., 2014; Busch et al., 2009). Only a subset of arborization patterns is shown in the following images, generated using the MCFO technique. Some of the neurites in these examples do not originate from the octopaminergic neuron innervating the PB cell. The Janelia workstation was used to trace the neurites in three dimensions in confocal images and fragments that were clearly not projections from the cell in question were erased, either in the workstation or using Photoshop. Those neurites that could not be definitively determined to project from other cells were not erased. (a) Most of the arbor in this image appears to belong to the PB octopaminergic cell. The ventral‐most arbors likely emanate from the two cell bodies seen at lower left and right (arrows). Inset: PB (gray) and PB arbor for this cell (extraneous nc82‐positive neuropil was erased using Photoshop in order to highlight the PB.) scale bar = 50 μ [from line VT016610]. (b) This neuron arborizes throughout just half of the PB (asterisk and inset) and most likely projects to the optic lobe. The prominent projection along the dorsal midline (arrow) does not appear to be part of the PB neuron. Scale bar = 50 μ [from line R64F06]. (c) All the neurites seen here appear to be part of the same neuron that innervates the PB. Inset highlights the PB arbor. Scale bar = 50 μ. [from line R12G04]. (d) Additional examples of the range of PB arbors seen in the PB octopaminergic neurons. Neurons shown are from the following lines: (d1) TDC2. (d2) R20F06. (d3) VT027001. (d4) VT004439
Figure 11
Figure 11
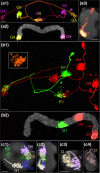
The tile cell: PBG1‐9.s‐EBt.b‐D/V GA.b. This cell type was found to target G9 in addition to G1–G8. The new nomenclature reflects this correction. Images obtained using MCFO are shown. (a1) The “new cell” (see text) targets all nine glomeruli of the PB. Two cells that project to G9, where they have spiny arbors, the dorsal gall (GA), and ventral EB tile at 6:00, both filled with varicosities, are shown. Scale bar = 10 μ; also applies to panel a2 [from line SS02191]. (a2) The PB shown here, stained with the α‐nc82 antibody, corresponds to the PB in a1 and is aligned with the glomeruli in a1. This panel illustrates the lateral location of the neurons in the PB. (a3) The yellow and pink EB arbors from the G9 cells shown in (a1) and (a2) are confined to the posterior shell, seen in this sagittal view. Anterior is to the right. Scale bar = 10 μ. (b1) MCFO image showing three tile cells innervating G1, G4, and G9. The tile cells that target G1 and G9 occupy the same domain in the EB, although their arbors are slightly offset on opposite sides of the midline. This G1 cell extends tendrils from its EB arbor (green asterisk) whereas its red neighbor does not. See b2 legend for feature highlighted by red arrow [from line SS02191]. Inset shows an EB arbor with the largest number of tendrils seen to date in a tile cell. Scale bar = 10 μ; also applies to panel b2 [from line SS02191]. (b2) α‐nc82 label is included as a reference to illustrate the glomeruli targeted by the PBG1‐9.s‐EBt.b‐D/VGA.b cells shown in (b1). The PB in (b2) is aligned with the PB in (b1). PB arbors sometimes extend into neighboring glomeruli (red arrow in b1 and b2). (c1) The odd/even glomerulus:gall rule is obeyed by the tile cell. The projections of three cells are followed from the EB to the gall in (c). Input for these cells comes from PB G1 (yellow), G3 (orange), and G6 (pink). Their EB tile domain arbors are shown in frontal (c1) and sagittal (c2) views. The EB arbors of the cells that project to G7 (green) and G3 (orange) of the PB occupy the same tile domain in the EB. Scale bar = 10 μ; also applies to panel c2 [from line SS27853]. (c2) Sagittal view of the EB shown in (c1) illustrates the depth of the EB arbors is confined to the posterior shell, which occupies the posterior third of the EB. Anterior is to the right. (c3) Projections of the G1 (yellow) and G6 (pink) cells in c1 to their respective gall domains. Cells that target the odd glomeruli, G1 (yellow) and G3 (orange, panel c4), project to the dorsal gall domain (D), whereas the cell that targets the even‐numbered glomerulus, G6 (pink), projects to the ventral gall domain (V). Images are rotated to reveal that these arbors fill their respective compartments. D = dorsal gall. V = ventral gall. Scale bar = 10 μ; also applies to (c4). (c4) Same as described for c3, but in this case, the dorsal gall is arborized by the PB cell that targets G3 (orange)
Figure 12
Figure 12
Population‐wide view of tile and canal cells. (a1) SS02191‐driven expression of a membrane‐targeted epitope (blue) and a presynaptically‐targeted epitope (red). Line SS02191 shows expression in only the tile cell: PBG1‐9.S‐EBt.B‐D/V GA.B. Asterisks identify cell bodies; red asterisk identifies primary neurite that is missing its cell body, which are sometimes lost in dissection (red syt signal seen in the cell bodies is likely due to protein trapped in the golgi, as is frequently seen with exogenously expressed proteins). Scale bar = 20 μ. (a2) Cells in PB are labeled with a membrane marker (blue) and reference channel is identified with α‐nc82 label (gray). All 18 glomeruli of the PB are targeted by this cell type. Scale bar = 20 μ; also applies to a3 and a4. (a3) The radius (left) and depth (right; sagittal view of EB) of the EB arbor are shown; the reference channel is included to identify the EB boundary. The arbor does not extend to the canal and populates only the posterior third of the EB (anterior is to the right in sagittal view). (a4) Both compartments of the gall are densely packed with boutons. White line delineates the boundary between the dorsal and ventral gall compartments. α‐nc82 label to the right of the gall is not part of the gall. (b1) SS02195‐driven expression of the canal cell: PBG1‐9.S‐EBc.B‐D/V GA.B. Markers are the same as described in Figure 12a1 legend. Cell bodies were identified in the confocal stack and their locations are indicated by asterisks in this maximum intensity projection, where they are difficult to resolve. Faintly stained ramifications belong to an unrelated cell type (arrow). Scale bar = 20 μ. (b2) The canal cell also populates all 18 glomeruli of the PB. Cells are labeled with a membrane marker, PB labeled with α‐nc82. Scale bar = 20 μ; also applies to (b3) and (b4). (b3) The canal cell EB arbor is offset toward the canal (left) and extends the depth of the EB (right, sagittal view, anterior is to the right). (b4) Also in contrast to the tile cell, the canal cell gall arbor does not fill the dorsal and ventral domains. The ventral gall arbor clearly wraps around the ventral gall. Refer to MCFO images in Figure 13 to better visualize the distribution of the dorsal gall arbor
Figure 13
Figure 13
The canal cell: PBG1‐9.s‐EBc.b‐D/V GA.b. (a1) Line SS02198 shows expression in both the canal and tile cells and enables a direct comparison between the two cell types. Shoots from the EB arbors of the two green canal cells enwrap the EB canal (yellow asterisk; see also a2) whereas such filamentules are notably absent from this red tile cell (and most tile cells). Note the distinct difference in density of the gall arbors: the red tile cell arbor has more boutons than the sparse canal arbors (green asterisks). G3, G4, and G9 identify the glomeruli of the PB that are targeted by these cells. Scale bar = 20 μ [from line SS02198]. (a2) Footprints of the tile (red) and canal (green) cells differ in radius (top, frontal view) and depth (bottom, sagittal view). Both cell types occupy the posterior shell of the EB; the canal cell projects even deeper, into the medial and sometimes even the anterior shells, although only a few boutons reach the anterior shell. Anterior is to the right in bottom panel. (a3) Canal cell gall arbors (green) are sparser than tile cell gall arbors (red) and generally even less dense than in this sample, for example, as seen in Figure 13b,d. (b) A canal cell that targets G4 in the PB. As noted for the tile cell, PB arbors from canal cells can also spill into neighboring glomeruli, shown in the right inset, in which G9's arbor extends fine, sparse shoots into G8 (asterisk). The canal cell was named for the filamentules that project from the EB arbor toward the central canal (top right). Sagittal view of the EB (lower right) illustrates that the bulk of the canal arbor is concentrated at the posterior of the EB, with a few branches reaching more anteriorly (anterior is to the right). Note that this cell, which targets an even‐numbered PB glomerulus, projects to just the tip of the ventral gall and sends a small projection more ventrally (arrows). The canal cell gall arbor is not as robust as the tile cell's gall arbor in that it does not fill the gall. The dorsal gall is in a different plane of view than is shown in the inset and does not receive input from this cell [from line SS02195]. (c) The distribution of the canal cell's EB arbor is variable; in some cells, boutons almost completely enwrap the canal (G5 and G6, in this figure), in others, a uniform swath extends the radius of the EB (G7), and in still others, the greatest density of boutons is offset toward the canal (G1). Several additional examples and the depth to which they penetrate the EB are shown in the lower panel; only the orange cell (G6) reaches the anterior shell, as seen in the side view (anterior is to the right). The projections of these cells to the dorsal/ventral gall are shown in (d) [SS02195, SS02198, SS04776]. (d) The profile of the canal cell's gall arbor is distinct from that of the tile cell but like the tile cell, it follows the odd/even glomerulus to D/V gall projection rule. D = dorsal gall. V = ventral gall. (d1) The mint green G6 cell from (c) projects to the ventral gall (V) in panel d1 but rather than filling this neuropil, as does the tile cell (e.g., red cell in Figure 13a3), it appears to track along this neuropil's surface [SS02198]. (d2) The red G1 cell shown in (c) also exhibits this tracking behavior in the gall. This three‐panel series from posterior (top panel) to anterior illustrates that this red arbor snakes between the dorsal (D) and ventral (V) gall compartments. Note the main body of the DGA (D) is void of boutons. Instead, the varicosities coat the surface of the DGA that juxtaposes the VGA (V; note the VGA peeking through as the DGA gives way to the underlying VGA in the middle panel). There are no boutons within or on the surface of the VGA [SS02195]. (d3) These gall arbors correspond to the cells shown in (c). Again, the two series shown run from posterior (left) to anterior. Upper panel, the pink cell (originates from PB G5) targets the dorsal gall (D), the green cell (originates from G2) targets the ventral gall (V). Lower panel, the orange cell (originates from G6) targets the ventral gall (V). The GA arbors appear to mostly “surround” the gall compartments more than fill them. This is particularly evident in the right panels of the lower series, in which the ventral gall‐seeking cell does not fill the VGA (gray neuropil) but instead tracks along its anterior surface. The white lines delineate boundary between dorsal and ventral gall compartments. Scale bar = 20 μ [SS04776]

References

    1. Aso, Y. , Hattori, D. , Yu, Y. , Johnston, R. M. , Iyer, N. A. , Ngo, T. T. , …, Rubin, G. M. (2014). The neuronal architecture of the mushroom body provides a logic for associative learning. eLife, 3, e04577. - PMC - PubMed
    1. Aso, Y. , Sitaraman, D. , Ichinose, T. , Kaun, K. R. , Vogt, K. , Belliart‐Guerin, G. , … Rubin, G. M. (2014). Mushroom body output neurons encode valence and guide memory‐based action selection in Drosophila. eLife, 3, e04580. - PMC - PubMed
    1. Baker, D. A. , Beckingham, K. M. , & Armstrong, J. D. (2007). Functional dissection of the neural substrates for gravitaxic maze behavior in Drosophila melanogaster . The Journal of Comparative Neurology, 501(5), 756–764. - PubMed
    1. Bidaye, S. S. , Machacek, C. , Wu, Y. , & Dickson, B. J. (2014). Neuronal control of Drosophila walking direction. Science, 344(6179), 97–101. - PubMed
    1. Bouhouche, A. , Vaysse, G. , & Corbiere, M. (1993). Immunocytochemical and learning studies of a Drosophila melanogaster neurological mutant, no‐bridgeKS49 as an approach to the possible role of the central complex. Journal of Neurogenetics, 9(2), 105–121. - PubMed

MeSH terms

LinkOut - more resources