Multicenter Study
. 2019 Jan 1;36(1):100-110.
doi: 10.1089/neu.2017.5449. Epub 2018 Sep 27.

Testing a Multivariate Proteomic Panel for Traumatic Brain Injury Biomarker Discovery: A TRACK-TBI Pilot Study

Collaborators, Affiliations
Multicenter Study

Testing a Multivariate Proteomic Panel for Traumatic Brain Injury Biomarker Discovery: A TRACK-TBI Pilot Study

J Russell Huie et al. J Neurotrauma. .

Abstract

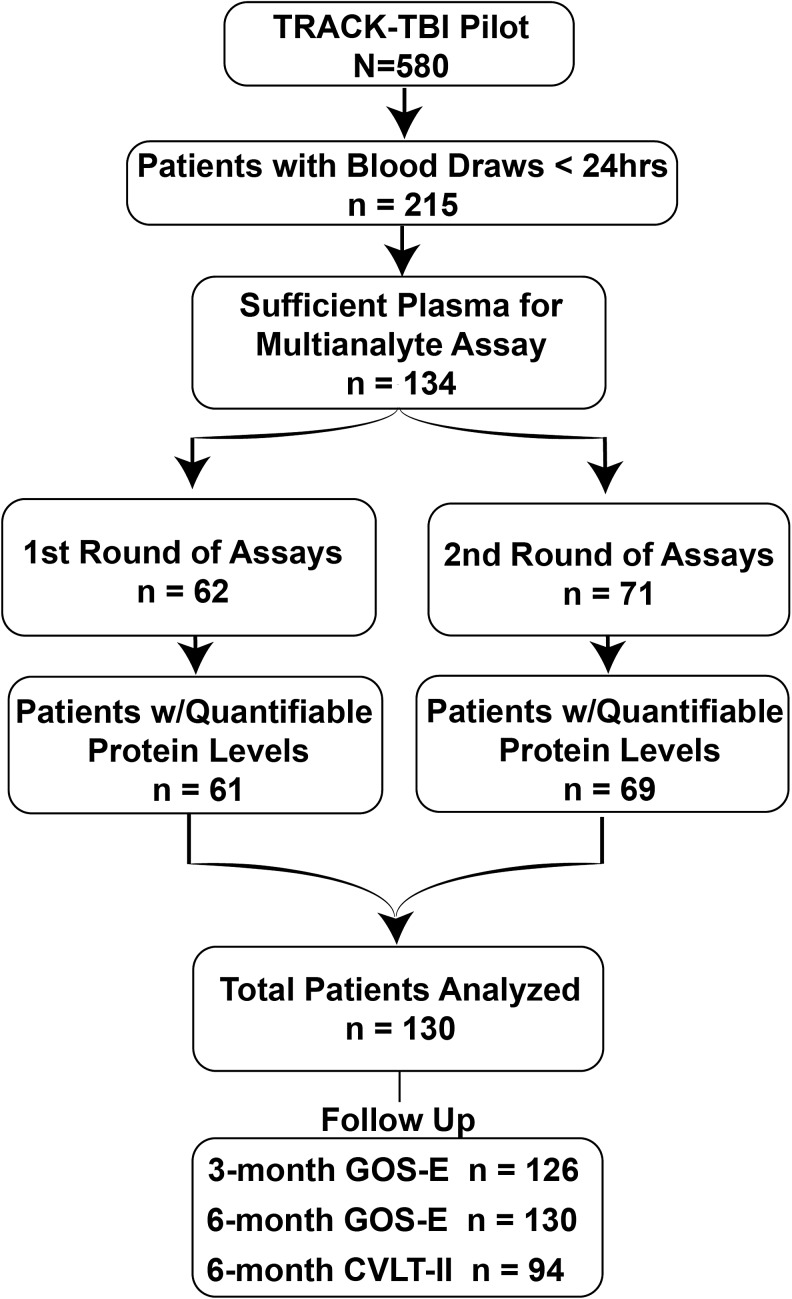
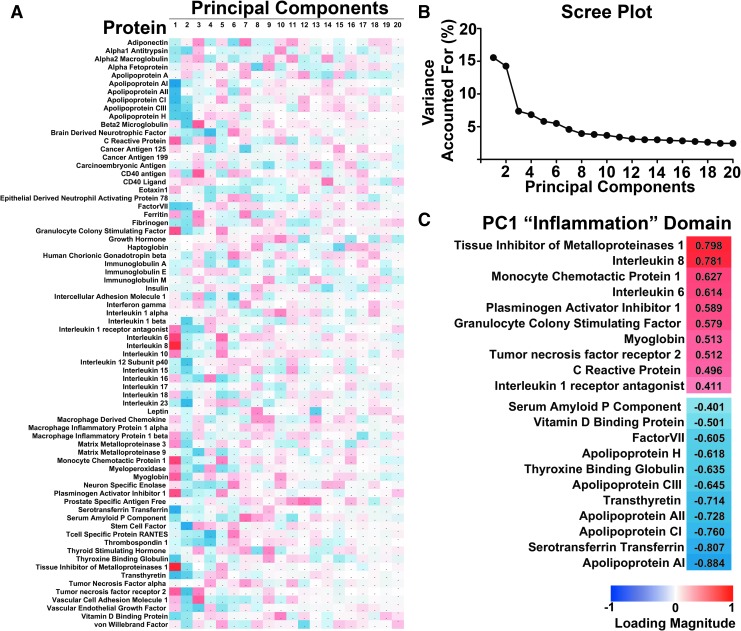
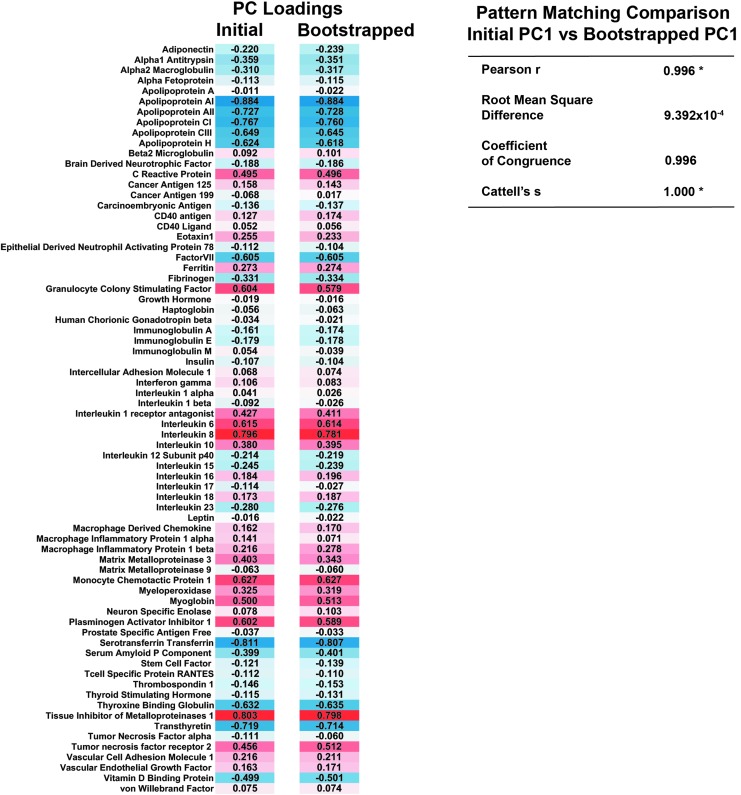
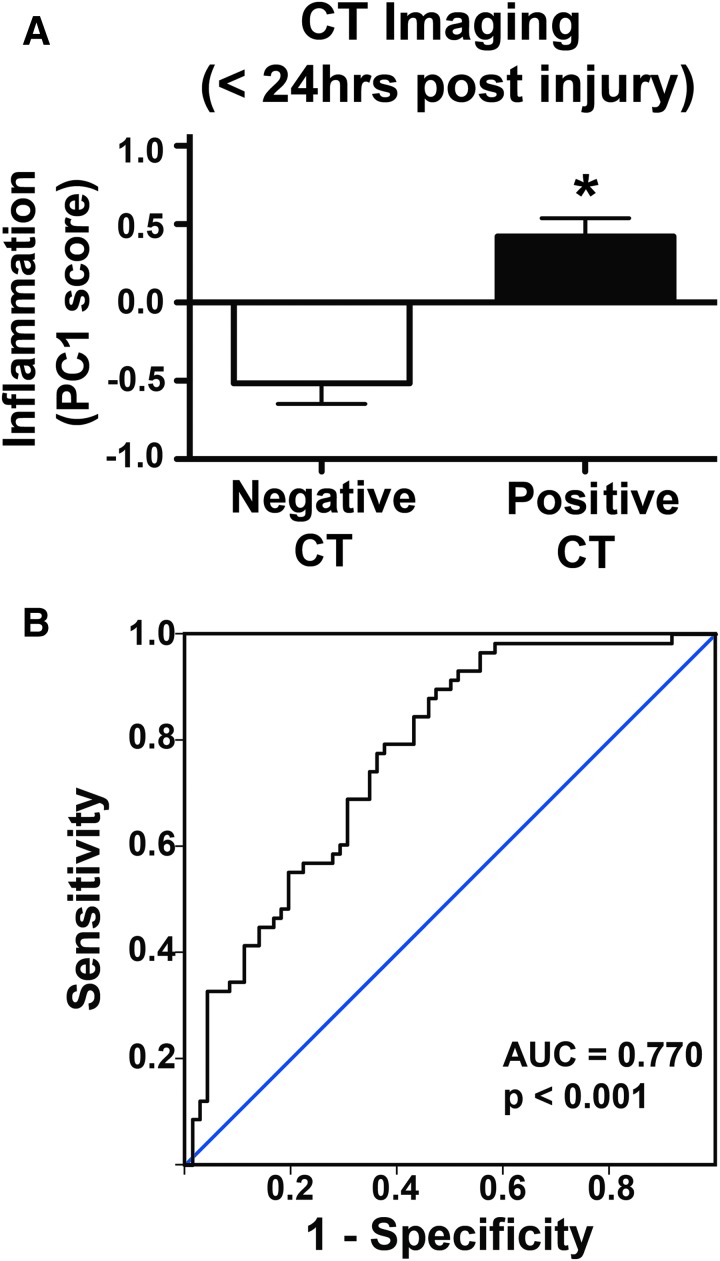
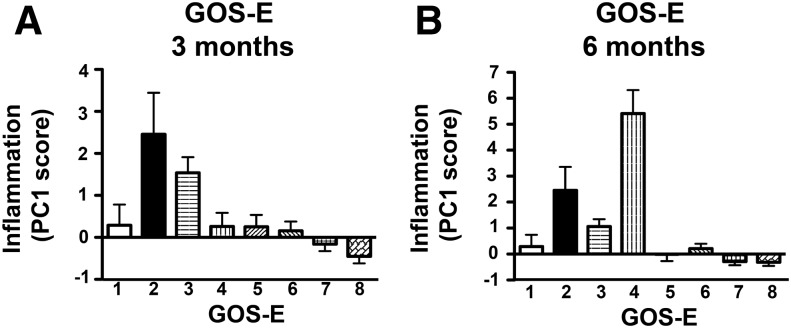
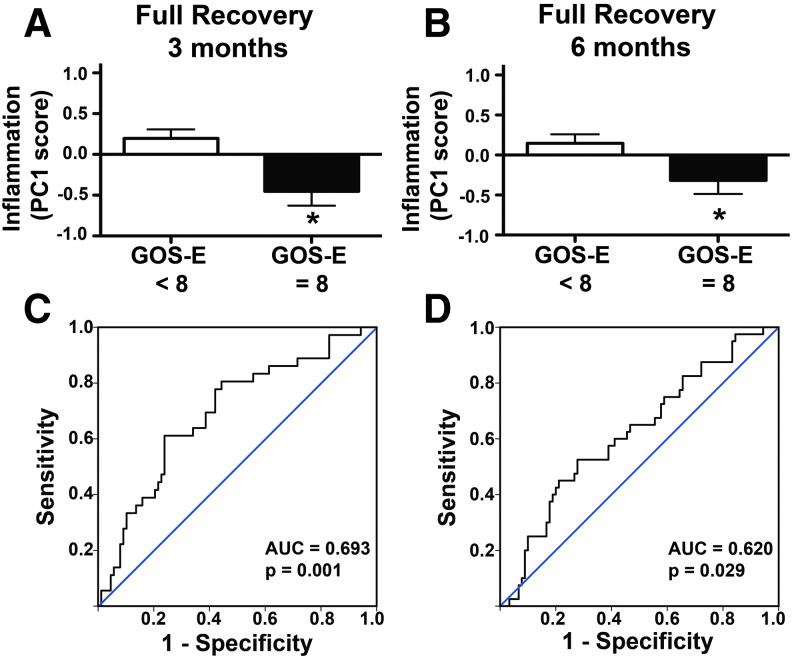
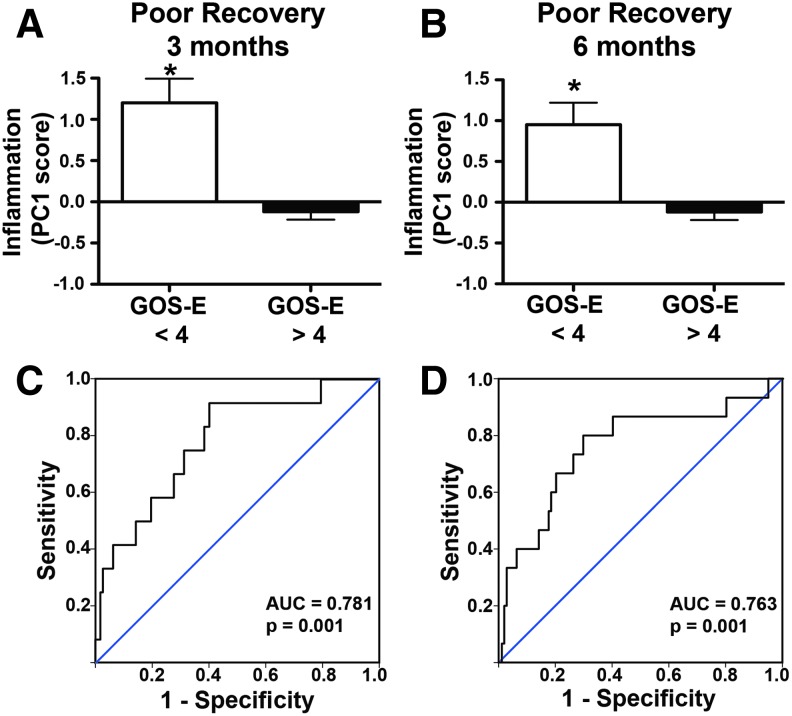
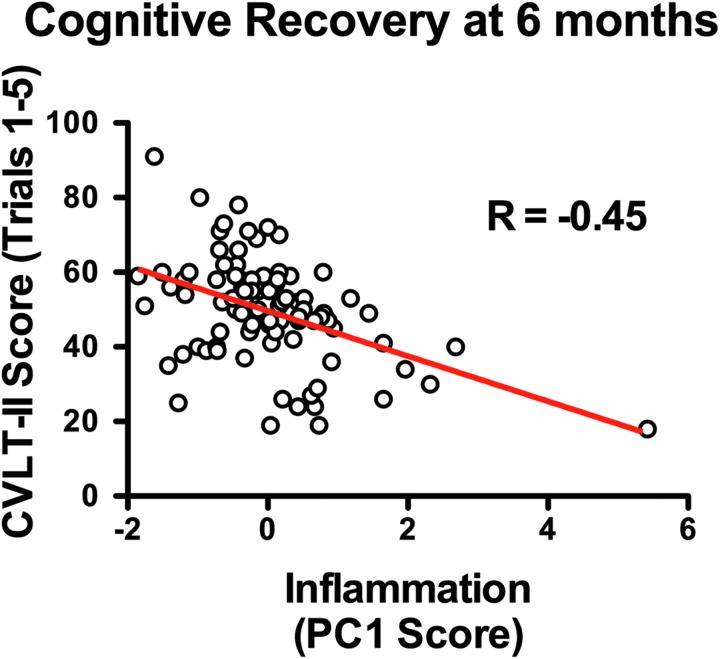
The complex and heterogeneous nature of traumatic brain injury (TBI) has rendered the identification of diagnostic and prognostic biomarkers elusive. A single acute biomarker may not be sufficient to categorize injury severity and/or predict outcome. Using multivariate dimension reduction analyses, we tested the sensitivity and specificity of a multi-analyte panel of proteins as an ensemble biomarker for TBI. Serum was collected within 24 h of injury in a cohort of 130 patients enrolled in the multi-center prospective Transforming Research and Clinical Knowledge in Traumatic Brain Injury Pilot (TRACK-TBI Pilot) study and run on an array that measured 72 proteins. Using unsupervised principal components analysis, we first identified the subset of protein changes accounting for the most variance across patients. This yielded a group of 21 proteins that reflected an inverse relationship between inflammatory cytokines and regulators of anti-inflammation, and generated an individual inflammatory profile score for each patient. We then tested the association between these scores and computed tomography (CT) findings at hospital admission, as well as their prognostic association with functional recovery at 3 and 6 months (Glasgow Outcome Scale-Extended), and cognitive recovery at 6 months (California Verbal Learning Test, Second Edition) after injury. Inflammatory signatures were significantly increased in patients with positive CT findings, as well as in those who showed poor or incomplete recovery. Inflammation biomarker scores also showed significant sensitivity and specificity as a discriminator of these outcome measures (all areas under the curve [AUCs] >0.62). This proof of concept for the feasibility of multivariate biomarker identification demonstrates the prognostic validity of using a proteomic panel as a potential biomarker for TBI.

Keywords: TBI; biomarkers; proteomics.


Conflict of interest statement

The TRACK-TBI authors declare no competing financial interests in Myriad/RBM including equity, consulting fees, or stock ownership.

Figures

<b>FIG. 1.</b>
FIG. 1.
Flow chart of patients from the Transforming Research and Clinical Knowledge in Traumatic Brain Injury (TRACK-TBI) Pilot who were included in the current study. Patients were chosen based on sufficient volume of plasma available for multi-analyte assay. Assays were run in two rounds, with one patient from the first round, and two patients from the second round with insufficient plasma for detection. Total number of patients in the current study was 130.
<b>FIG. 2.</b>
FIG. 2.
Non-linear principal components analysis (PCA) of multi-analyte proteomic data from traumatic brain injury (TBI) patient plasma. (A) PCA matrix of 20 components by 72 proteins from the commercially available multi-analyte array (RBM, HumanMAP v2.0). Red indicates positive magnitude of loadings, blue indicates negative magnitude. (B) Scree plot showing variance accounted for by each orthogonal component. The first principal component (PC1) accounted for 16.2% of the variance. (C) After thresholding loadings at an absolute value of 0.4, the subset of proteins with strong loadings are identified as being predominantly associated with inflammation, with pro- and anti-inflammatory markers loading in opposite directions. Color image is available online at www.liebertpub.com/neu
<b>FIG. 3.</b>
FIG. 3.
Internal cross-validation of protein loading pattern. Comparison of initial first principal component (PC1) loadings for each protein against the mean loading value of 1000 bootstrapping iterations shows a very high degree of similarity, indicative of a robust and stable loading pattern (*p < 0.05). Color image is available online at www.liebertpub.com/neu
<b>FIG. 4.</b>
FIG. 4.
Relationship between computed tomography (CT) findings and Inflammation biomarker component. (A) Patients categorized by either positive or negative CT pathology findings have significantly different mean Inflammation principal component (PC) scores, with patients who have positive CT findings exhibiting higher inflammation scores (p < 0.01). (B) Receiver operating characteristic (ROC) analysis shows that Inflammation PC score is significantly predictive of whether CT finding is positive or negative (area under the curve [AUC] = 0.770, p < 0.001). Color image is available online at www.liebertpub.com/neu
<b>FIG. 5.</b>
FIG. 5.
Relationship between inflammation component and Glasgow Outcome Scale-Extended (GOS-E). A significant main effect of principal component (PC) score was seen across GOS-E categories with patients with lower GOS-E (indicative of poor recovery) showing the highest PC scores (p < 0.01) at both 3 months (A) and 6 months (B) post-injury (p < 0.01). These findings indicate that lower acute ensemble biomarker scores may be predictive of improved future recovery.
<b>FIG. 6.</b>
FIG. 6.
Relationship between inflammation component and full recovery at 3 and 6 months after traumatic brain injury (TBI). Patient scores on the Glasgow Outcome Scale-Extended (GOS-E) were dichotomized into either full (GOS-E = 8) or incomplete (GOS-E < 8) recovery. (A) Patients who made a full recovery by 3 months had significantly lower Inflammation component scores (*p < 0.05). (B) Patients who made full recovery by 6 months also had significantly lower Inflammation component scores (*p < 0.05). (C) Receiver operating characteristic (ROC) analysis shows Inflammation principal component (PC) score to be significantly predictive of whether or not recovery at 3 months is complete (area under the curve [AUC] = 0.693, p < 0.01). (D) ROC analysis shows Inflammation PC score to be significantly predictive of whether or not recovery at 6 months is complete (AUC = 0.620, p < 0.05). Color image is available online at www.liebertpub.com/neu
<b>FIG. 7.</b>
FIG. 7.
Relationship between inflammation component and poor recovery at 3 and 6 months after traumatic brain injury (TBI). To assess poor recovery, patient Glasgow Outcome Scale-Extended (GOS-E) scores were dichotomized into either poor recovery (GOS-E < 4) or not (GOS-E > 4). (A) Patients who had poor recovery at 3 months had significantly higher Inflammation component scores (*p < 0.05). (B) Patients who had poor recovery at 6 months also had significantly higher Inflammation component scores (*p < 0.05). (C) Receiver operating characteristic (ROC) analysis shows Inflammation principal component (PC) score to be significantly predictive of poor recovery at 3 months (area under the curve [AUC] = 0.781, p < 0.001). (D) ROC analysis shows Inflammation PC score to be significantly predictive of poor recovery at 6 months (AUC = 0.763, p < 0.05). Color image is available online at www.liebertpub.com/neu
<b>FIG. 8.</b>
FIG. 8.
Relationship between inflammation component and cognitive recovery at 6 months after traumatic brain injury (TBI). Linear regression shows inflammation principal component (PC) score to be significantly predictive of California Verbal Learning Test-Second Edition (CVLT-II) score (R = -0.45, p < 0.01). Results indicate that higher acute inflammation PC score predicts lower cognitive recovery at 6 months post-TBI. Color image is available online at www.liebertpub.com/neu

References

    1. Taylor C.A., Bell J.M., Breiding M.J., and Xu L. (2017). Traumatic brain injury–related emergency department visits, hospitalizations, and deaths — United States, 2007 and 2013. MMWR Surveill. Summ. 66, 1–16 - PMC - PubMed
    1. Mittl R.L., Grossman R.I., Hiehle J.F., Hurst R.W., Kauder D.R., Gennarelli T.A., and Alburger G.W. (1994). Prevalence of MR evidence of diffuse axonal injury in patients with mild head injury and normal head CT findings. AJNR Am. J. Neuroradiol. 15, 1583–1589 - PMC - PubMed
    1. Thurman D.J., Alverson C., Browne D., Dunn K.A., Guerrero J., Johnson R., Johnson V., Longlois J.A., Pilkey D., and Sniezek J.E., (1999). Traumatic brain injury in the United States: A report to Congress. Division of Acute Care, Rehabilitation Research, and Disability Prevention, National Center for Injury Prevention and Control, Centers for Disease Control and Prevention, US Department of Health and Human Services
    1. McNett M. (2007). A review of the predictive ability of Glasgow Coma Scale scores in head-injured patients. J. Neurosci. Nurs. 39, 68–75 - PubMed
    1. Reith F.C., Synnot A., van den Brande R., Gruen R.L., and Maas A.I. (2017). Factors influencing the reliability of the Glasgow Coma Scale: a systematic review. Neurosurgery 80, 829–839 - PubMed

Publication types