. 2018 Oct 15;24(20):5037-5047.
doi: 10.1158/1078-0432.CCR-18-0784. Epub 2018 Jul 3.

Consensus on Molecular Subtypes of High-Grade Serous Ovarian Carcinoma

Affiliations

Consensus on Molecular Subtypes of High-Grade Serous Ovarian Carcinoma

Gregory M Chen et al. Clin Cancer Res. .

Abstract

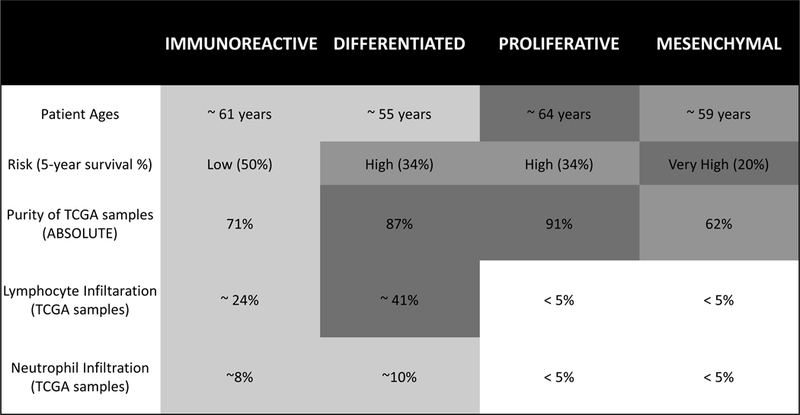
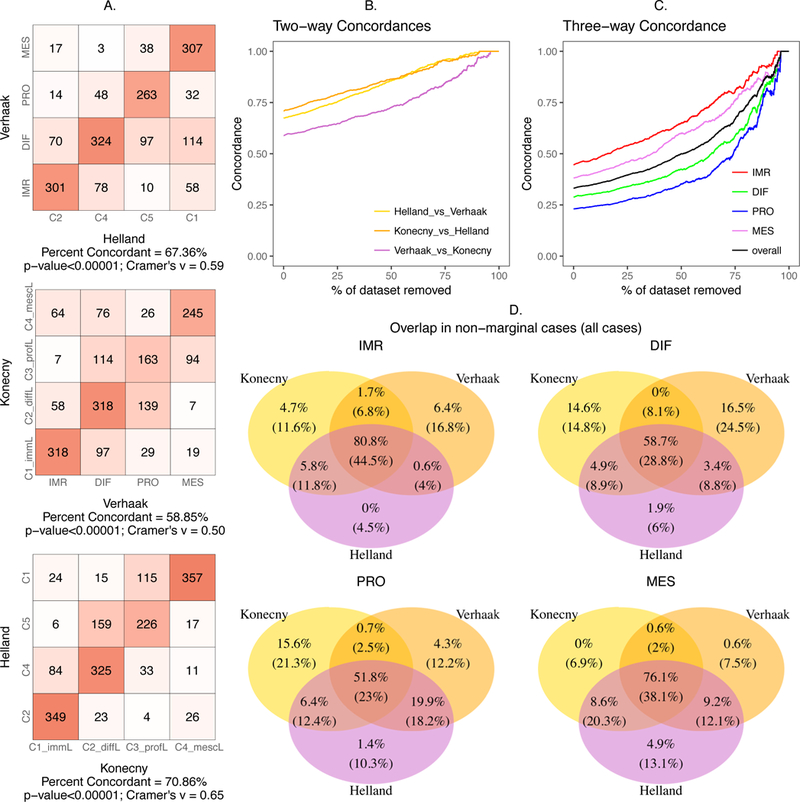
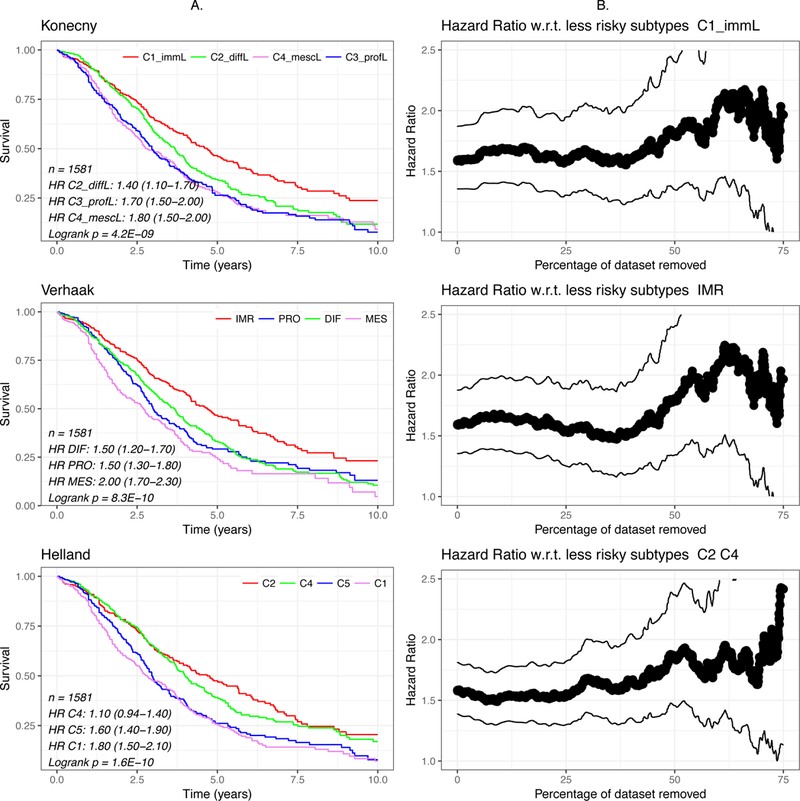
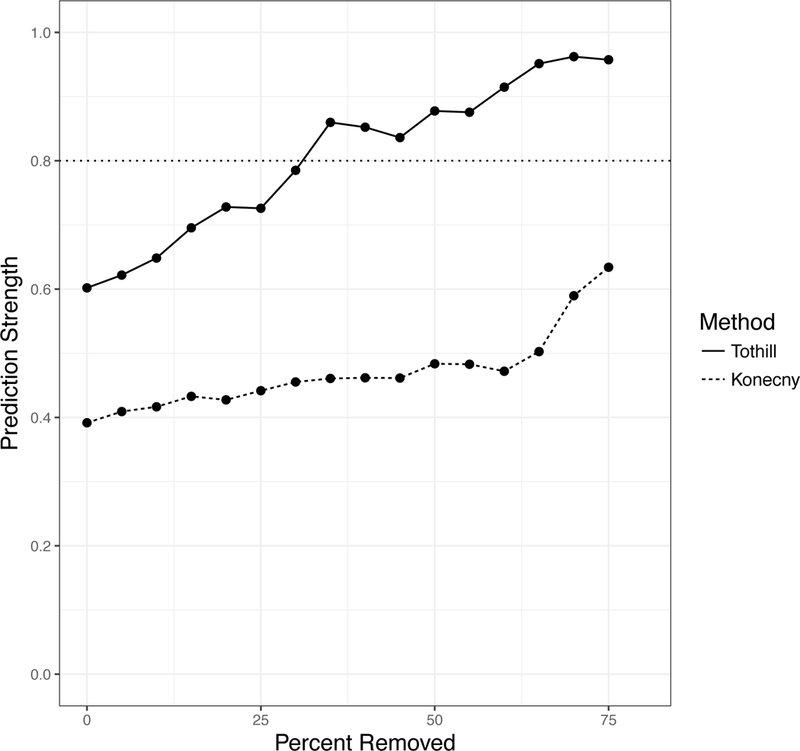
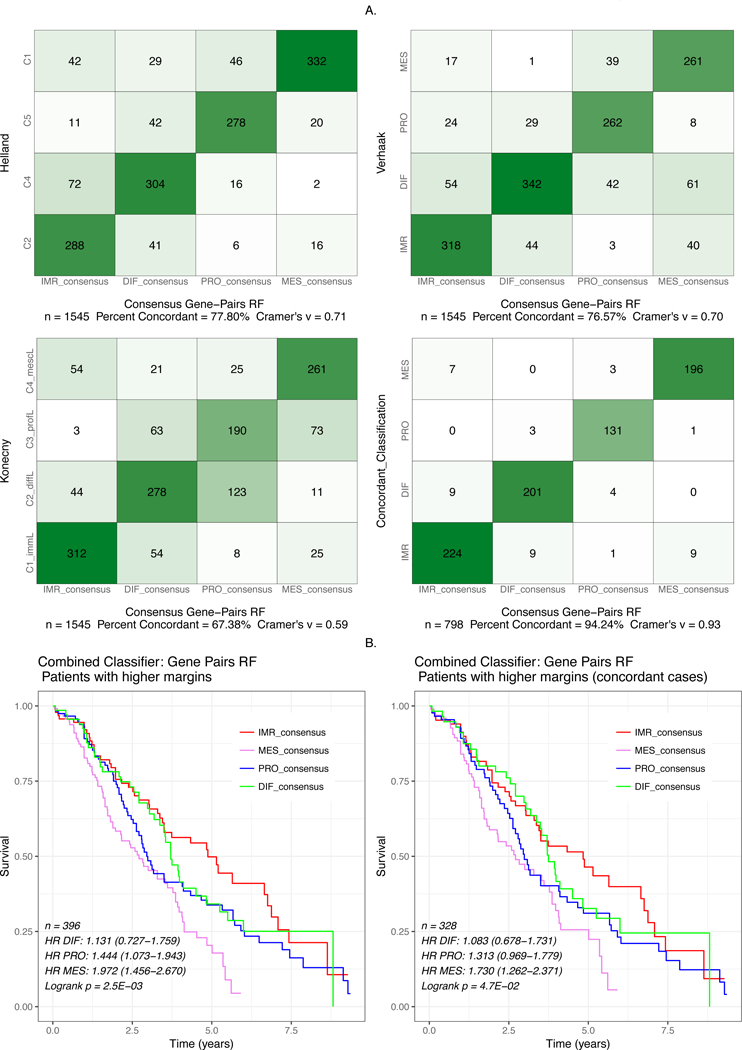
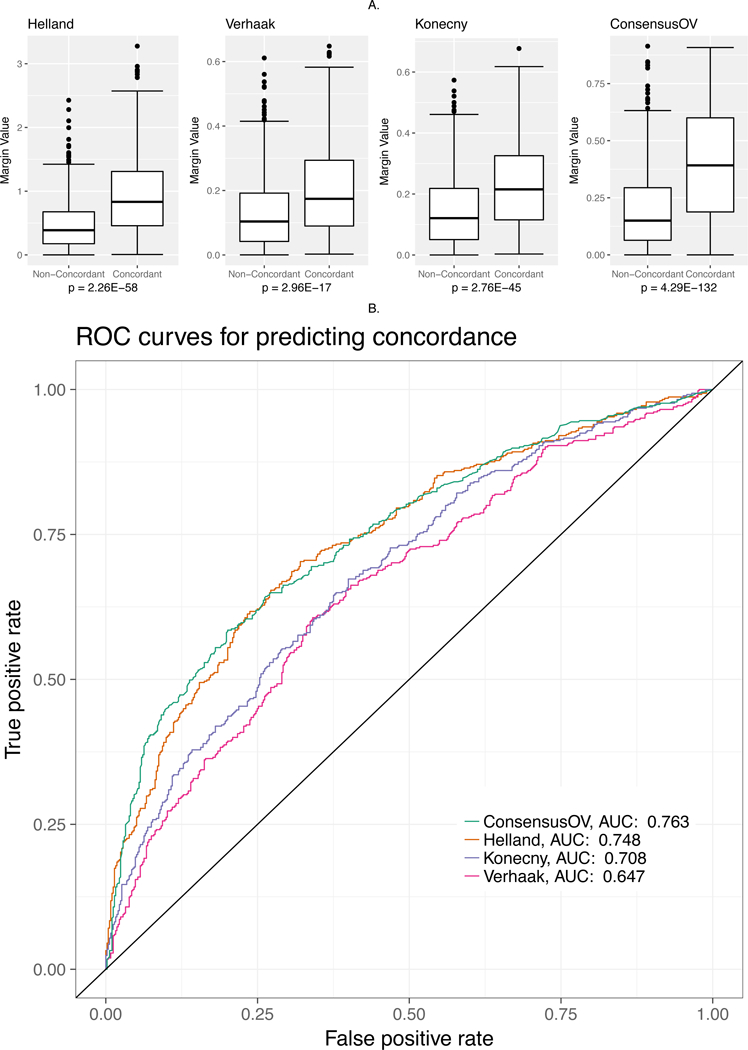
Purpose: The majority of ovarian carcinomas are of high-grade serous histology, which is associated with poor prognosis. Surgery and chemotherapy are the mainstay of treatment, and molecular characterization is necessary to lead the way to targeted therapeutic options. To this end, various computational methods for gene expression-based subtyping of high-grade serous ovarian carcinoma (HGSOC) have been proposed, but their overlap and robustness remain unknown.Experimental Design: We assess three major subtype classifiers by meta-analysis of publicly available expression data, and assess statistical criteria of subtype robustness and classifier concordance. We develop a consensus classifier that represents the subtype classifications of tumors based on the consensus of multiple methods, and outputs a confidence score. Using our compendium of expression data, we examine the possibility that a subset of tumors is unclassifiable based on currently proposed subtypes.Results: HGSOC subtyping classifiers exhibit moderate pairwise concordance across our data compendium (58.9%-70.9%; P < 10-5) and are associated with overall survival in a meta-analysis across datasets (P < 10-5). Current subtypes do not meet statistical criteria for robustness to reclustering across multiple datasets (prediction strength < 0.6). A new subtype classifier is trained on concordantly classified samples to yield a consensus classification of patient tumors that correlates with patient age, survival, tumor purity, and lymphocyte infiltration.Conclusions: A new consensus ovarian subtype classifier represents the consensus of methods and demonstrates the importance of classification approaches for cancer that do not require all tumors to be assigned to a distinct subtype. Clin Cancer Res; 24(20); 5037-47. ©2018 AACR.


Figures

Figure 1:
Figure 1:. Properties of Subtypes identified by Consensus Classifier
Subtype associations with patient age and overall survival were assessed across our compendium of microarray datasets; association with tumor purity and immune cell infiltration was assessed using the TCGA dataset. Tumor purity was estimated from genotyping data in TCGA; lymphocyte infiltration was based on pathology estimates from TCGA. Patient age (p < 0.001), overall survival (p < 0.005), and ABSOLUTE purity (p < 0.001) were statistically significant across subtypes. When compared to all other groups, the Immunoreactive subtype had elevated infiltration of lymphocytes (p < 0.05) and neutrophils (p < 0.10). Mean monocyte infiltration was less than 5% across all subtypes, and was excluded from this analysis. Classification was performed using default parameters, and mean values of each variable are shown.
Figure 2:
Figure 2:. Concordance Analysis
(A) Contingency table showing concordance of subtypes while comparing the methods pairwise (B) Pairwise concordance between the methods versus percentage of the dataset with samples of lower subtype margins removed, (C) three-way overall concordance between the methods and that of the individual subtypes versus percentage removed, (D) The classification of patients by three published algorithms as a Venn diagram for each of the four subtypes. Each area shows percentages of patients when all patients are classified (below, in parentheses) and after refusing to classify 75% of the most marginally classified tumors by any of the three methods (above). Thus, the numbers on the top of the three-way intersection are the concordant tumors according to the three original algorithms. Bottom numbers indicate relatively unambiguous subtype predictions by all three algorithms and which are also concordant with the others.
Figure 3:
Figure 3:. Survival Analysis
(A) Kaplan-Meier curves of subtypes of the 1581 patients with survival data under different methods. (B) Hazard ratios and 95% confidence intervals of the lowest-risk subtype (Konecny and Verhaak) or two subtypes (Helland) compared to the remaining subtypes.
Figure 4:
Figure 4:. Robustness Analysis of published classifiers, by Prediction Strength
In each dataset, concordance was calculated between the published classifier and a classifier re-trained on the validation dataset. The TCGA dataset also classified using the published classifiers of Helland and Konecny (no re-training was done for the classifiers). The TCGA dataset was also clustered using the methods of Tothill and Konency (in red and blue respectively). Samples were removed from Prediction Strength calculations starting with the most ambiguous samples (with the smallest difference between the top subtype prediction and runner-up subtype prediction); the x-axis shows the percent removed before computing prediction strength. Each algorithm improves in robustness when allowed to leave ambiguous samples, that it is less certain in its classification, unclassified.
Figure 5:
Figure 5:. Concordance and Survival Stratification of consensusOV
(A) Contingency plots showing concordance of subtype classification between consensusOV and the classifiers of Helland, Verhaak, Konecny. The fourth (bottom-right) plot shows the concordance between the consensus classifier and the patients concordantly classified between the three classifiers. (B) Survival curves for the pooled dataset provided by consensusOV. Classification was performed using leave-one-dataset-out validation. For the bottom two figures, classification with consensusOV was performed with the default cutoff, in which 75% of patients with the lowest margin are not classified.
Figure 6:
Figure 6:. Margin Analysis
(A) Boxplots indicating the margin values assigned by each classifier to concordant and discordant cases. All statistical tests were performed using the Wilcoxon rank-sum test. (B) ROC curve for assessing the ability of margin values to discriminate between concordant and discordant cases.

References

    1. Liu J, Matulonis UA. New strategies in ovarian cancer: translating the molecular complexity of ovarian cancer into treatment advances. Clin Cancer Res. 2014;20:5150–6. - PubMed
    1. Bonome T, Levine DA, Shih J, Randonovich M, Pise-Masison CA, Bogomolniy F, et al. A gene signature predicting for survival in suboptimally debulked patients with ovarian cancer. Cancer Res. 2008;68:5478–86. - PMC - PubMed
    1. Tothill RW, Tinker AV, George J, Brown R, Fox SB, Lade S, et al. Novel molecular subtypes of serous and endometrioid ovarian cancer linked to clinical outcome. Clin Cancer Res. 2008;14:5198–208. - PubMed
    1. Cancer Genome Atlas Research Network. Integrated genomic analyses of ovarian carcinoma. Nature. 2011;474:609–15. - PMC - PubMed
    1. Verhaak RGW, Tamayo P, Yang J-Y, Hubbard D, Zhang H, Creighton CJ, et al. Prognostically relevant gene signatures of high-grade serous ovarian carcinoma. J Clin Invest. 2013;123:517–25. - PMC - PubMed

Publication types

Substances