Clinical Trial
. 2018 Oct 1;128(10):4573-4587.
doi: 10.1172/JCI121957. Epub 2018 Aug 7.

PD-1 blockade partially recovers dysfunctional virus-specific B cells in chronic hepatitis B infection

Affiliations
Clinical Trial

PD-1 blockade partially recovers dysfunctional virus-specific B cells in chronic hepatitis B infection

Loghman Salimzadeh et al. J Clin Invest. .

Abstract

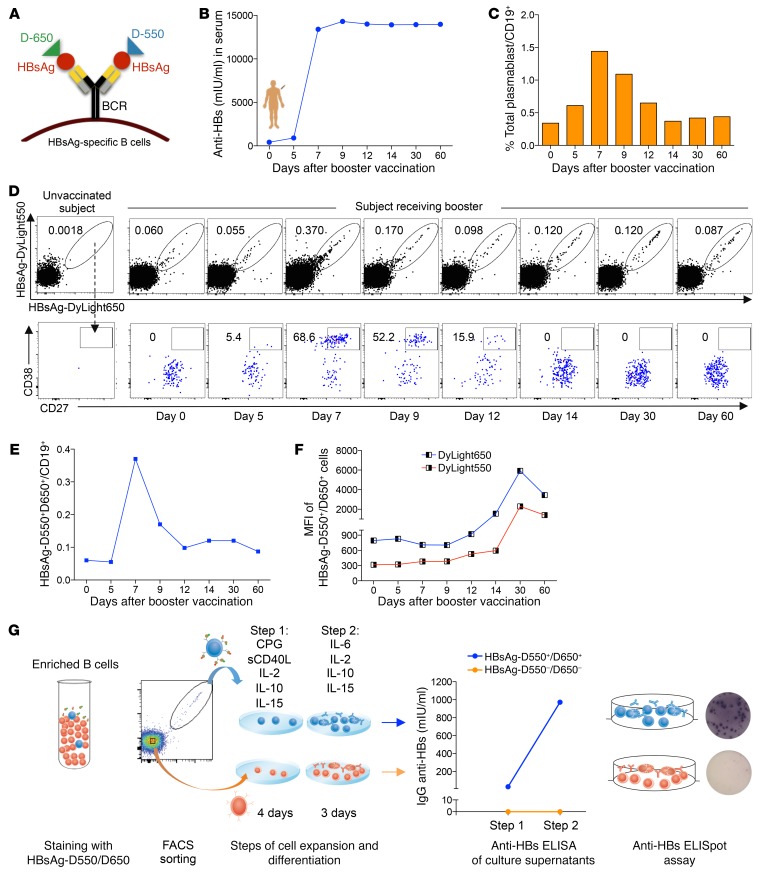
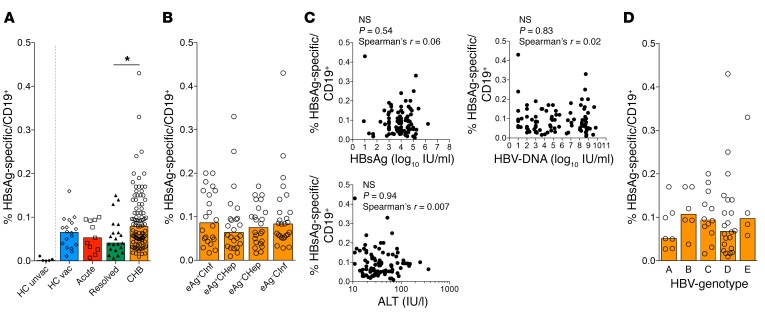
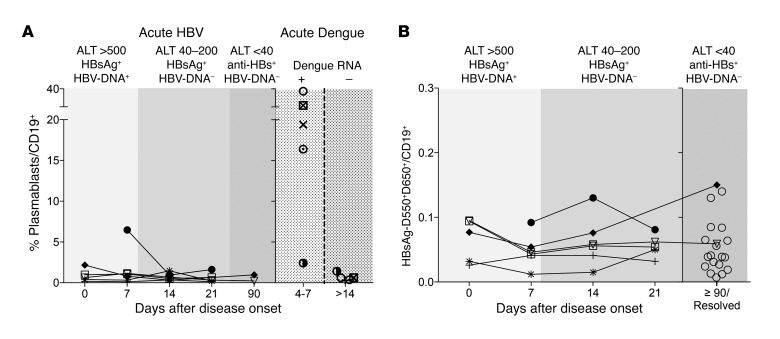
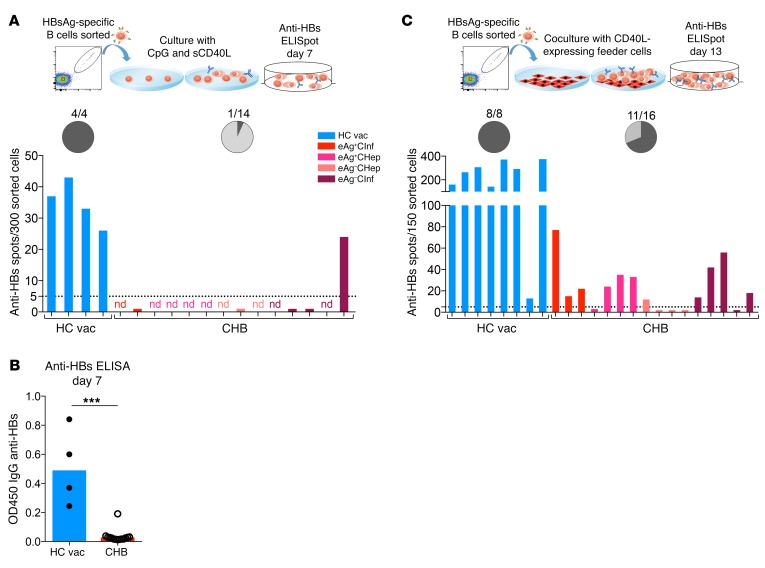
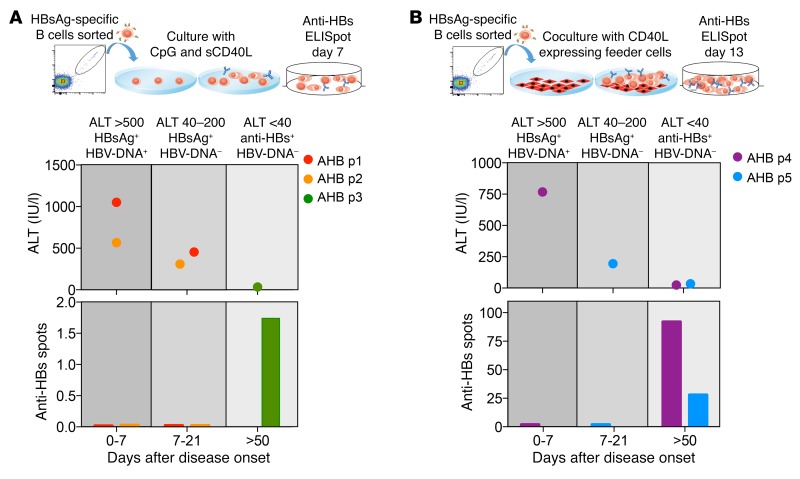
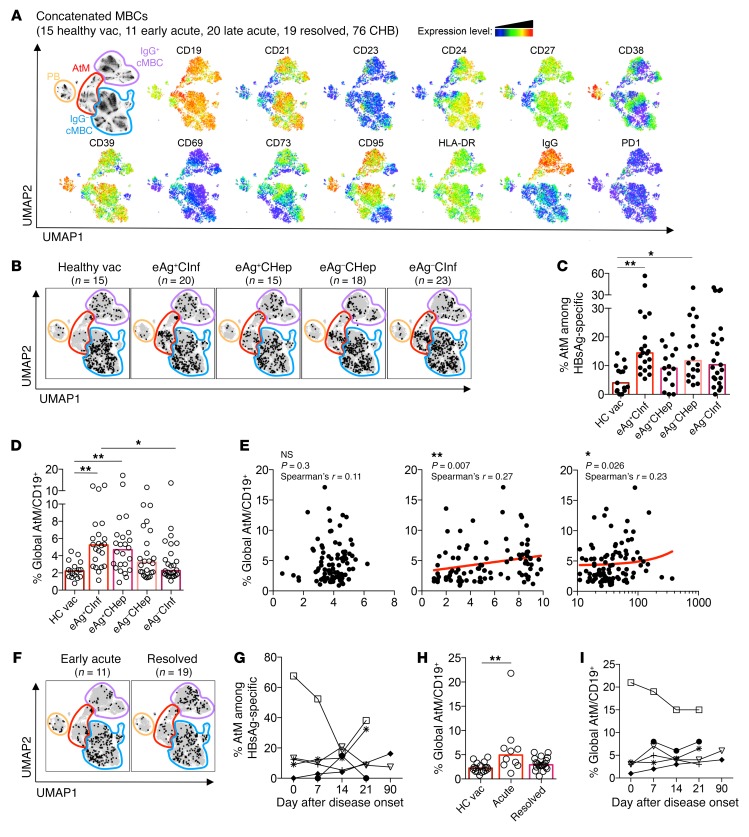
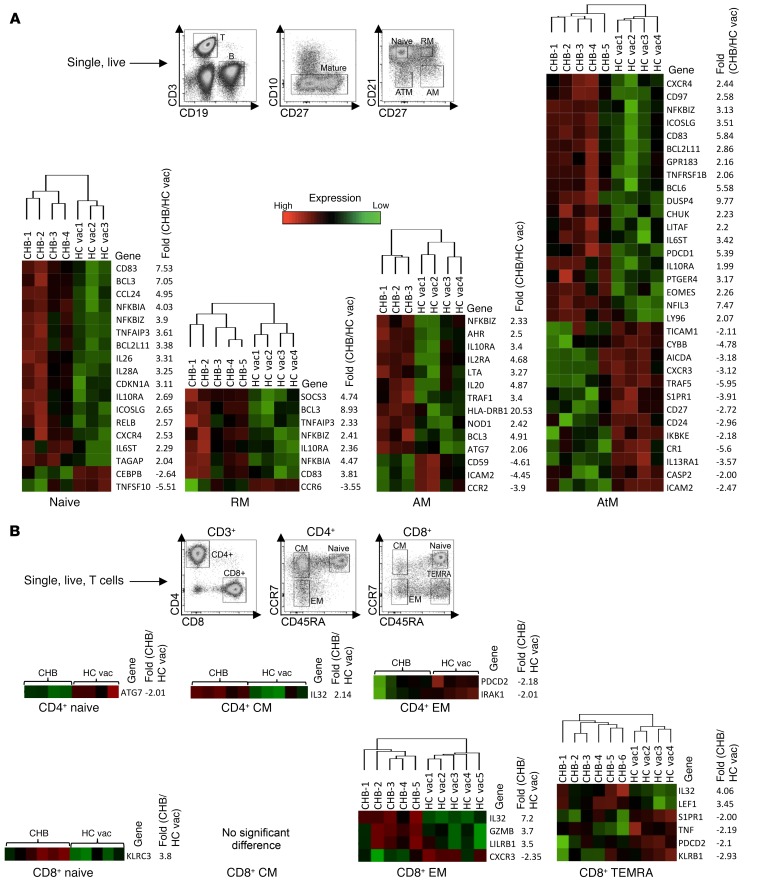
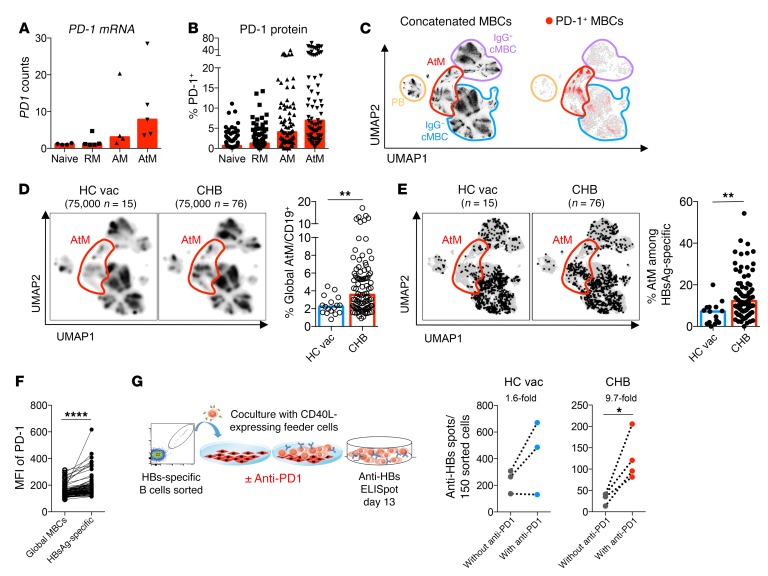
Chronic HBV (CHB) infection suppresses virus-specific T cells, but its impact on humoral immunity has been poorly analyzed. Here, we developed a dual-staining method that utilizes hepatitis B virus (HBV) surface antigens (HBsAg) labeled with fluorochromes as "baits" for specific ex vivo detection of HBsAg-specific B cells and analysis of their quantity, function, and phenotype. We studied healthy vaccinated subjects (n = 18) and patients with resolved (n = 21), acute (n = 11), or chronic (n = 96) HBV infection and observed that frequencies of circulating HBsAg-specific B cells were independent of HBV infection status. In contrast, the presence of serum HBsAg affected function and phenotype of HBsAg-specific B cells that were unable to mature in vitro into Ab-secreting cells and displayed an increased expression of markers linked to hyperactivation (CD21lo) and exhaustion (PD-1). Importantly, B cell alterations were not limited to HBsAg-specific B cells, but affected the global B cell population. HBsAg-specific B cell maturation could be partially restored by a method involving the combination of the cytokines IL-2 and IL-21 and CD40L-expressing feeder cells and was further boosted by the addition of anti-PD-1 Abs. In conclusion, HBV infection has a marked impact on global and HBV-specific humoral immunity, yet HBsAg-specific B cells are amenable to a partial rescue by B cell-maturing cytokines and PD-1 blockade.

Keywords: B cells; Hepatitis; Hepatology; Infectious disease.


Conflict of interest statement

Conflict of interest: AB receives research support from Gilead Sciences Inc. to test the effect of HBV antigens on immune cell function. He acted as a consultant for and served on the advisory boards of Gilead Sciences Inc., MedImmune, Janssen-Cilag, Abivax, and HUMABS. He is also a cofounder of Lion TCR, a biotech company developing T cell receptors for treatment of virus-related cancers. PTFK has collaborative grant funding from Gilead Sciences Inc., participates on the advisory board of and provides consultancy to Gilead Sciences Inc. and Janssen-Cilag, and is an investigator for industry-led trials with Gilead Sciences Inc., Janssen-Cilag, Alere, and Assembly Biosciences. CF, MH, NN, and SF are employed by Gilead Sciences Inc.

Figures

Figure 1
Figure 1. Fluorescently labeled HBsAg baits bind specifically to HBsAg-specific B cells.
(A) Schematic representation of fluorescently labeled HBsAg baits binding to the BCR on the surface of HBsAg-specific B cells. A healthy subject received an HBV booster vaccination. Serum and blood samples were analyzed from day 0 to day 60 after vaccination. (B) Anti-HBs titers in the serum from day 0 to day 60 after vaccination. (C) Frequency of total plasmablasts (CD19+CD10CD21–/loCD27++CD38++) out of total B cells measured longitudinally. (D) Flow cytometry plots show the frequency of HBsAg double-binding MBCs (top panel) and their percentages displaying a plasmablast phenotype (bottom panel). The first plot at the left shows data of a healthy unvaccinated subject. The other plots show data of a healthy vaccinated subject at the indicated time points before and after the HBV booster vaccination. (E) Frequency of HBsAg double-binding MBCs over time. (F) MFI of HBsAg-D550 and HBsAg-D650 on HBsAg-specific B cells at different time points. (G) Equal numbers of HBsAg-D550+D650+ and HBsAg-D550D650 MBCs were FACS sorted from PBMCs of day 60 after booster vaccination and triggered for Ab production by CpG and sCD40L polyclonal activation. Cells were cultured in 2 different steps with different cytokine mixtures. Subsequently, anti-HBs ELISA and anti-HBs ELISpot assays were performed on culture supernatants and on the cells, respectively.
Figure 2
Figure 2. Similar frequency of HBsAg-specific B cells in diverse cohorts of HBV-infected patients.
(A) Frequency of HBsAg-specific B cells in 5 healthy HBV-unvaccinated (HC unvac), 18 healthy HBV-vaccinated (HC vac), 11 acute HBV, 21 resolved HBV, and 96 CHB patients out of total CD19+ B cells. (B) Frequency of HBsAg-specific B cells out of total CD19+ B cells in different phases of CHB: 22 HBeAg+ chronic infection (eAg+CInf), 24 HBeAg+ chronic hepatitis (eAg+CHep), 24 HBeAg chronic hepatitis (eAgCHep), and 26 HBeAg chronic infection (eAgCInf). (C) No correlation between frequency of HBsAg-specific B cells and serum levels of HBsAg, HBV DNA, and ALT. (D) Frequency of HBsAg-specific B cells among 51 CHB patients infected with 5 different HBV genotypes. Data are presented as median, and statistical analysis was performed by the Kruskal-Wallis test followed by Dunn’s multiple comparisons test. *P < 0.05 (A, B, and D); Spearman’s rank correlation (C).
Figure 3
Figure 3. Longitudinal profile of B cell responses in acute HBV patients.
(A) Frequency of global plasmablasts (CD19+CD10CD21CD27++CD38++) out of total B cells (CD19+) were analyzed at the indicated different time points in 6 patients with acute HBV (left) and in 5 patients with acute dengue infection (right). Time points are indicated as days after onset of clinical symptoms. Virological features of acute HBV and dengue are indicated at the top of the figures. (B) Longitudinal frequency of HBsAg-specific B cells in the 6 acute hepatitis B patients compared with the frequency obtained in 21 subjects with resolved HBV infection (anti-HBc+, anti-HBs+; open circles). HBsAg-specific B cells were calculated as the frequency of memory double-positive HBsAg-D550+D650+ B cells out of total CD19+ B cells. Each symbol represents a single patient.
Figure 4
Figure 4. HBsAg-specific B cells from CHB patients are dysfunctional and require coculture with CD40L-expressing feeder cells for survival, expansion, and anti-HBs production.
(A) HBsAg-specific B cells from 4 healthy vaccinated donors and 14 CHB patients were FACS sorted and cultured in the presence of CpG, sCD40L, IL-2, IL-10, and IL-15 for 4 days and subsequently with IL-2, IL-6, IL-10, and IL-15 for another 3 days before the anti-HBs ELISpot assays were performed. nd, not done due to low cell number. The chart shows the percentage of anti-HBs producers. Dark gray indicates positive. (B) Supernatants of the cultured specific B cells (from A) were taken after 7 days culture, and anti-HBs levels were measured by ELISA. Data are presented as median, and statistical analysis was performed by Mann-Whitney U test. ***P < 0.001. (C) HBsAg-specific B cells from 8 healthy vaccinated donors and 16 CHB patients were FACS sorted and cocultured with CD40L-expressing feeder cells in the presence of IL-2 and IL-21 for 13 days before anti-HBs ELISpot assays were performed. Chart shows the percentage of anti-HBs producers. Dark gray indicates positive.
Figure 5
Figure 5. Functional characterization of HBsAg-specific B cells during acute hepatitis B.
(A) HBsAg-specific B cells were sorted from PBMCs of 3 patients at different time points after onset of acute hepatitis B (AHB). The schematic graph on the top indicates the different serological and clinical parameters (ALT, HBsAg, and HBV DNA) at which PBMCs were collected. Sorted HBsAg-specific B cells were polyclonal stimulated with CpG, sCD40L, IL-2, IL-10, and IL-15 for 4 days and subsequently cultured with IL-2, IL-6, IL-10, and IL-15 for another 3 days. After 7 days, culture supernatants were collected and tested in an anti-HBs–specific ELISA. Bars indicate the optical density of detected anti-HBs Ab. (B) HBsAg-specific B cells were sorted from PBMCs of 2 additional acute hepatitis B patients at the indicated time points. Sorted HBsAg-specific B cells were expanded on CD40L-expressing fibroblasts with the addition of IL-2 and IL-21 for 13 days. Expanded cells were tested on anti-HBs B cell ELISpot. Bars indicate the numbers of spots obtained.
Figure 6
Figure 6. HBsAg-specific and global B cells of CHB patients are enriched for an AtM phenotype.
(A) Flow cytometric data of MBCs from 15 healthy vaccinated, 11 early acute, 20 late acute, 19 resolved, and 76 CHB patients were analyzed by the dimensionality reduction algorithm UMAP and concatenated. Four different MBC subsets were delineated (left panel) based on the expression heatmaps of 13 markers (right panels). (B) HBsAg-specific B cells from 15 healthy vaccinated, 20 HBeAg+ chronic infection, 15 HBeAg+ chronic hepatitis, 18 HBeAg chronic hepatitis, and 23 HBeAg chronic infection patients were concatenated, normalized to their correct frequency, and overlaid onto the UMAP plot of global concatenated MBCs. (C) Frequency of AtM B cells among HBsAg-specific B cells within the different cohorts. (D) Frequency of global AtM B cells among total B cells (CD19+) present in the subjects of the different cohorts. (E) Correlation of frequency of global AtM among total B cells with serum HBsAg (left), HBV DNA (middle), and ALT (right) levels. (F) Overlay of HBsAg-specific B cells on global MBCs of 11 concatenated acute (left) and 19 resolved (right) HBV patients. (G) Percentage of HBsAg-specific B cells with an AtM phenotype in 6 acute HBV patients at different time points from disease onset. Each symbol represents a single patient. (H) Percentage of global AtM B cells among total B cells (CD19+) of healthy vaccinated, acute, and resolved HBV patients. (I) Percentage of global AtM B cells in 6 acute HBV patients at different time points from disease onset. Bar graphs present median, and statistical analysis was performed by the Kruskal-Wallis test followed by Dunn’s multiple comparisons test (C, D, and H) and Spearman’s rank correlation (E). *P < 0.05; **P < 0.01.
Figure 7
Figure 7. Transcriptional alteration of global B cell subsets by CHB infection.
(A) Four different mature (CD19+CD10) B cell populations from 5 CHB patients (CHB; eAg+CInf) and 4 healthy vaccinated subjects were FACS sorted based on their expression of CD21 and CD27 (see gating strategy). Cells were lysed, and mRNA expression levels of 588 immune-related genes were measured by NanoString. Heatmaps showing immune genes that are significantly different between CHB and healthy vaccinated subjects (P < 0.05, ≥2-fold different) within the 4 different B cell subsets, naive, RM, AM, and AtM. (B) Four different subsets of global CD4+ and CD8+ T cells (CD3+) were sorted from 6 CHB patients and 5 healthy vaccinated controls based on their expression of CCR7 and CD45RA (see gating strategy) and analyzed by NanoString. EM, effector memory; CM, central memory. Heatmaps showing immune genes that are significantly different between CHB and healthy vaccinated subjects (P < 0.05, ≥2-fold different) within the different T cell subsets.
Figure 8
Figure 8. PD-1 blockage partially recovers dysfunctional HBsAg-specific B cells of CHB patients.
(A) mRNA expression of PD-1 in the indicated B cell subsets of 5 CHB patients measured by NanoString. (B) Surface PD-1 expression on the B cell subsets of 96 CHB patients measured by flow cytometry. (C) Flow cytometric data of MBCs from 141 samples analyzed by UMAP and concatenated. Four subsets of MBCs were delineated (left, plots reshown from Figure 6A), and PD-1+ MBCs are shown (right). (D) MBCs of 15 healthy vaccinated (left) and 76 CHB patients (right) were downsampled to equal cell numbers. Density UMAP plots are shown; the cluster of AtM B cells is highlighted in red. Right bar graph shows percentage of global MBCs with an AtM phenotype in 17 healthy vaccinated and 96 CHB patients. (E) Double-positive HBsAg-D550+D650+ B cells from 15 healthy vaccinated (left) and 76 CHB patients (right) were concatenated, downsampled to normalized frequencies, and overlaid onto the UMAP plot of global concatenated MBCs; the cluster of AtM B cells is highlighted in red. Right bar graph shows percentage of HBsAg-specific B cells with an AtM phenotype in healthy vaccinated and CHB patients. (F) MFI of PD-1 on global MBCs and HBsAg-specific MBCs of 96 CHB patients. (G) Double-positive HBsAg-D550+D650+ MBCs from 4 CHB patients and 3 healthy vaccinated subjects were FACS sorted and cocultured for 13 days with CD40L-expressing feeder cells in the presence of IL-2 and IL-21, with or without anti–PD-1 Ab (schematic at left). Subsequently, anti-HBs–secreting cells were detected by ELISpot assay (right). Average fold changes in the number of anti-HBs spots are shown above the plots. Data are presented as median, and statistical analysis was performed by the Mann-Whitney U test (D and E) and Wilcoxon’s paired t test (F and G). *P < 0.05; **P < 0.01; ****P < 0.0001.

Comment in

References

    1. Oxenius A, Zinkernagel RM, Hengartner H. Comparison of activation versus induction of unresponsiveness of virus-specific CD4+ and CD8+ T cells upon acute versus persistent viral infection. Immunity. 1998;9(4):449–457. doi: 10.1016/S1074-7613(00)80628-7. - DOI - PubMed
    1. Wherry EJ, et al. Molecular signature of CD8+ T cell exhaustion during chronic viral infection. Immunity. 2007;27(4):670–684. doi: 10.1016/j.immuni.2007.09.006. - DOI - PubMed
    1. Moir S, et al. Evidence for HIV-associated B cell exhaustion in a dysfunctional memory B cell compartment in HIV-infected viremic individuals. J Exp Med. 2008;205(8):1797–1805. doi: 10.1084/jem.20072683. - DOI - PMC - PubMed
    1. Portugal S, et al. Malaria-associated atypical memory B cells exhibit markedly reduced B cell receptor signaling and effector function. Elife. 2015;4:e07218. - PMC - PubMed
    1. Sullivan RT, et al. FCRL5 delineates functionally impaired memory B cells associated with Plasmodium falciparum exposure. PLoS Pathog. 2015;11(5):e1004894. doi: 10.1371/journal.ppat.1004894. - DOI - PMC - PubMed

Publication types