Analysis of retrotransposon abundance, diversity and distribution in holocentric Eleocharis (Cyperaceae) genomes
- PMID: 30084890
- PMCID: PMC6070107
- DOI: 10.1093/aob/mcy066
Analysis of retrotransposon abundance, diversity and distribution in holocentric Eleocharis (Cyperaceae) genomes
Abstract
Background and aims: Long terminal repeat-retrotransposons (LTR-RTs) comprise a large portion of plant genomes, with massive repeat blocks distributed across the chromosomes. Eleocharis species have holocentric chromosomes, and show a positive correlation between chromosome numbers and the amount of nuclear DNA. To evaluate the role of LTR-RTs in karyotype diversity in members of Eleocharis (subgenus Eleocharis), the occurrence and location of different members of the Copia and Gypsy superfamilies were compared, covering interspecific variations in ploidy levels (considering chromosome numbers), DNA C-values and chromosomal arrangements.
Methods: The DNA C-value was estimated by flow cytometry. Genomes of Eleocharis elegans and E. geniculata were partially sequenced using Illumina MiSeq assemblies, which were a source for searching for conserved proteins of LTR-RTs. POL domains were used for recognition, comparing families and for probe production, considering different families of Copia and Gypsy superfamilies. Probes were obtained by PCR and used in fluorescence in situ hybridization (FISH) against chromosomes of seven Eleocharis species.
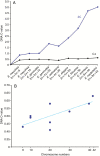
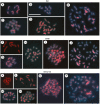
Key results: A positive correlation between ploidy levels and the amount of nuclear DNA was observed, but with significant variations between samples with the same ploidy levels, associated with repetitive DNA fractions. LTR-RTs were abundant in E. elegans and E. geniculata genomes, with a predominance of Copia Sirevirus and Gypsy Athila/Tat clades. FISH using LTR-RT probes exhibited scattered and clustered signals, but with differences in the chromosomal locations of Copia and Gypsy. The diversity in LTR-RT locations suggests that there is no typical chromosomal distribution pattern for retrotransposons in holocentric chromosomes, except the CRM family with signals distributed along chromatids.
Conclusions: These data indicate independent fates for each LTR-RT family, including accumulation between and within chromosomes and genomes. Differential activity and small changes in LTR-RTs suggest a secondary role in nuclear DNA variation, when compared with ploidy changes.
Figures


Similar articles
-
Correlated evolution of LTR retrotransposons and genome size in the genus Eleocharis.BMC Plant Biol. 2010 Nov 30;10:265. doi: 10.1186/1471-2229-10-265. BMC Plant Biol. 2010. PMID: 21118487 Free PMC article.
-
Major repeat components covering one-third of the ginseng (Panax ginseng C.A. Meyer) genome and evidence for allotetraploidy.Plant J. 2014 Mar;77(6):906-16. doi: 10.1111/tpj.12441. Epub 2014 Feb 24. Plant J. 2014. PMID: 24456463
-
Chromosomal distribution and evolution of abundant retrotransposons in plants: gypsy elements in diploid and polyploid Brachiaria forage grasses.Chromosome Res. 2015 Sep;23(3):571-82. doi: 10.1007/s10577-015-9492-6. Chromosome Res. 2015. PMID: 26386563
-
Co-evolution of plant LTR-retrotransposons and their host genomes.Protein Cell. 2013 Jul;4(7):493-501. doi: 10.1007/s13238-013-3037-6. Epub 2013 Jun 23. Protein Cell. 2013. PMID: 23794032 Free PMC article. Review.
-
LINEs, SINEs and repetitive DNA: non-LTR retrotransposons in plant genomes.Plant Mol Biol. 1999 Aug;40(6):903-10. doi: 10.1023/a:1006212929794. Plant Mol Biol. 1999. PMID: 10527415 Review.
Cited by
-
A multidisciplinary and integrative review of the structural genome and epigenome of Capsicum L. species.Planta. 2025 Mar 9;261(4):82. doi: 10.1007/s00425-025-04653-w. Planta. 2025. PMID: 40057910 Review.
-
Genome relationships and LTR-retrotransposon diversity in three cultivated Capsicum L. (Solanaceae) species.BMC Genomics. 2020 Mar 17;21(1):237. doi: 10.1186/s12864-020-6618-9. BMC Genomics. 2020. PMID: 32183698 Free PMC article.
-
Low coverage sequencing for repetitive DNA analysis in Passiflora edulis Sims: citogenomic characterization of transposable elements and satellite DNA.BMC Genomics. 2019 Apr 2;20(1):262. doi: 10.1186/s12864-019-5576-6. BMC Genomics. 2019. PMID: 30940088 Free PMC article.
-
Full-length LTR retroelements in Capsicum annuum revealed a few species-specific family bursts with insertional preferences.Chromosome Res. 2021 Dec;29(3-4):261-284. doi: 10.1007/s10577-021-09663-4. Epub 2021 Jun 4. Chromosome Res. 2021. PMID: 34086192
-
The Evolutionary Dynamics of Repetitive DNA and Its Impact on the Genome Diversification in the Genus Sorghum.Front Plant Sci. 2021 Aug 12;12:729734. doi: 10.3389/fpls.2021.729734. eCollection 2021. Front Plant Sci. 2021. PMID: 34475879 Free PMC article.
References
-
- Arabidopsis Genome Initiative 2000. Analysis of the genome sequence of the flowering plant Arabidopsis thaliana. Nature 408: 796–815. - PubMed
-
- Belyayev A, Raskina O, Nevo E. 2001. Chromosomal distribution of reverse transcriptase-containing retroelements in two Triticeae species. Chromosome Research 9: 129–136. - PubMed
-
- Bennetzen JL. 2000. Transposable element contributions to plant gene and genome evolution. Plant Molecular Evolution 42: 251–269. - PubMed
-
- Bennetzen JL. 2005. Transposable elements, gene creation and genome rearrangement in flowering plants. Current Opinion in Genetics and Development 15: 1–7. - PubMed
Publication types
MeSH terms
Substances
LinkOut - more resources
Full Text Sources
Other Literature Sources

