. 2018 Sep 1;141(9):2685-2699.
doi: 10.1093/brain/awy193.

Induction of a transmissible tau pathology by traumatic brain injury

Affiliations

Induction of a transmissible tau pathology by traumatic brain injury

Elisa R Zanier et al. Brain. .

Abstract

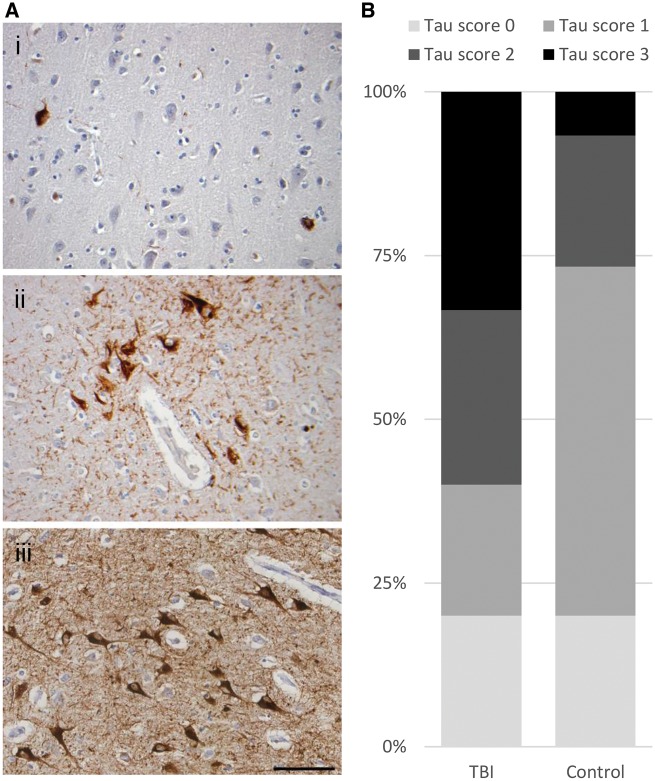
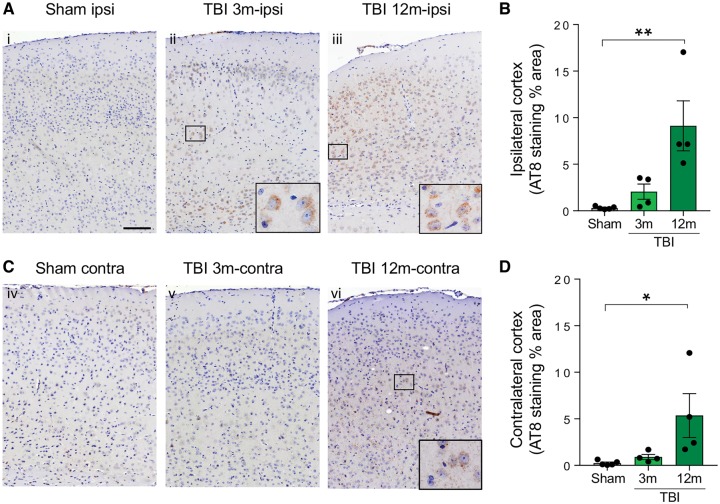
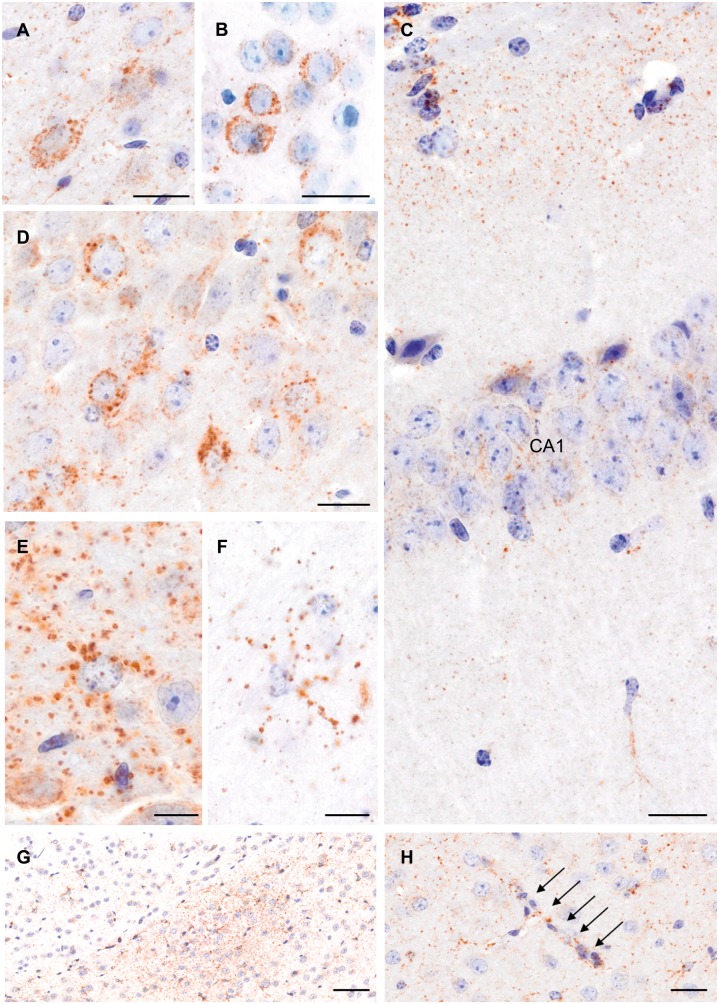
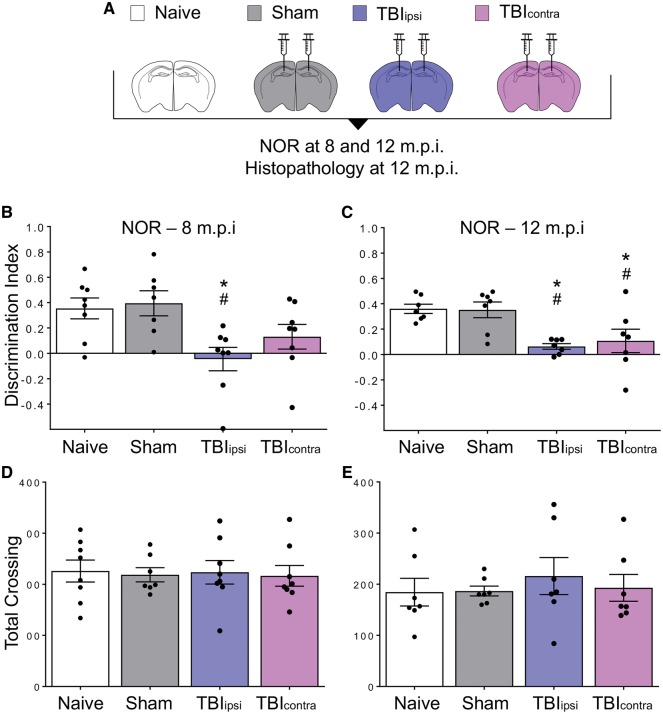
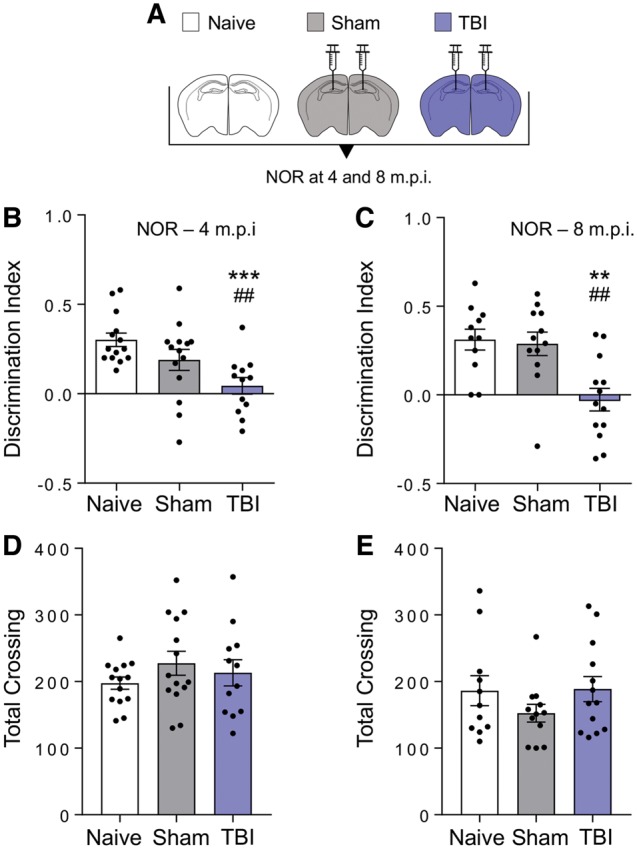
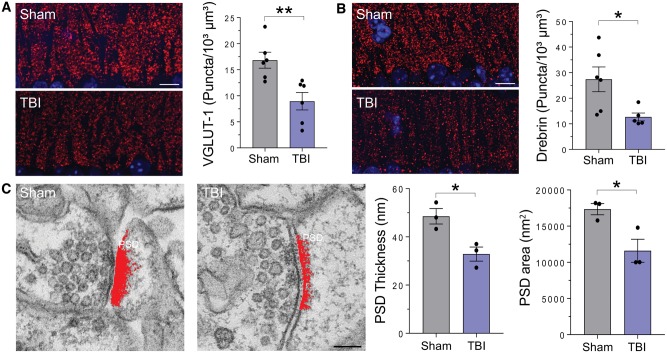
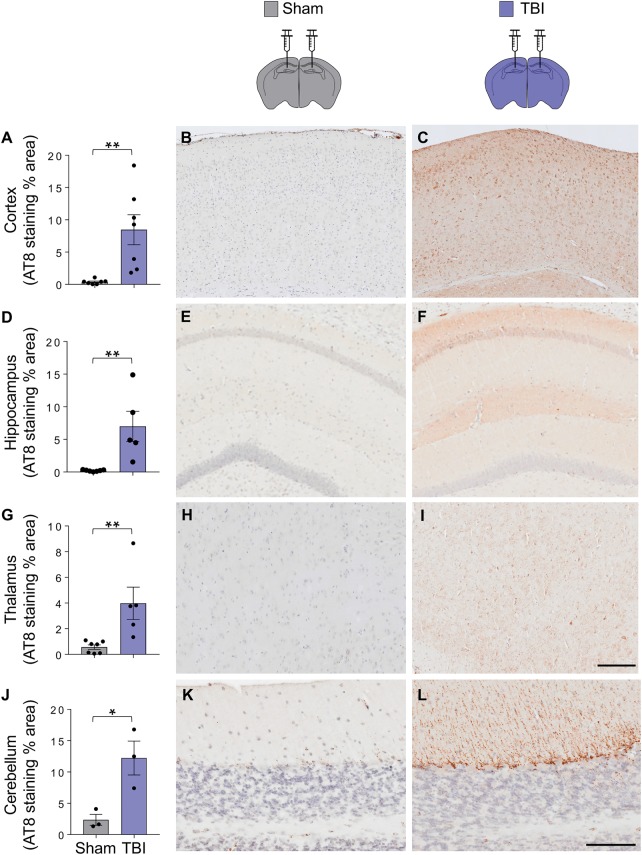
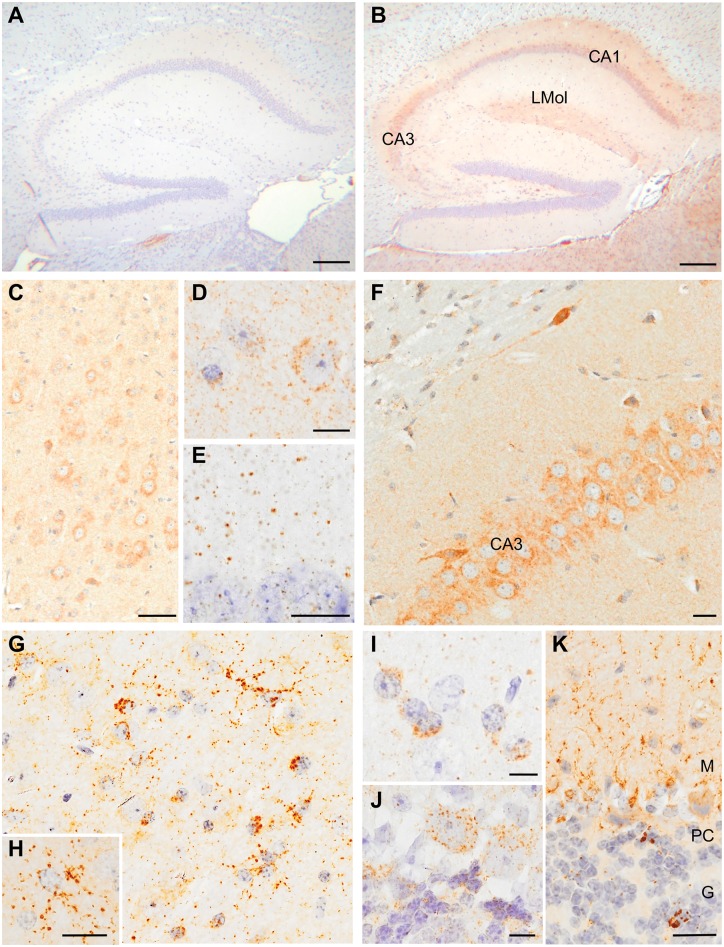
Traumatic brain injury is a risk factor for subsequent neurodegenerative disease, including chronic traumatic encephalopathy, a tauopathy mostly associated with repetitive concussion and blast, but not well recognized as a consequence of severe traumatic brain injury. Here we show that a single severe brain trauma is associated with the emergence of widespread hyperphosphorylated tau pathology in a proportion of humans surviving late after injury. In parallel experimental studies, in a model of severe traumatic brain injury in wild-type mice, we found progressive and widespread tau pathology, replicating the findings in humans. Brain homogenates from these mice, when inoculated into the hippocampus and overlying cerebral cortex of naïve mice, induced widespread tau pathology, synaptic loss, and persistent memory deficits. These data provide evidence that experimental brain trauma induces a self-propagating tau pathology, which can be transmitted between mice, and call for future studies aimed at investigating the potential transmissibility of trauma associated tau pathology in humans.


Figures

Figure 1
Figure 1
Tau pathology in survivors of a single moderate or severe TBI. (A) Typically, controls showed sparse P-tau immunoreactive neurofibrillary tangles and neurites localized to the entorhinal cortex (i; 59-year-old male, no history of TBI). In contrast, patients surviving a year or more from single moderate or severe TBI showed more extensive neurofibrillary, neuritic and glial P-tau immunoreactive profiles, with occasional clusters around cortical vessels in a ‘CTE-like’ manner (ii; 59-year-old male 17-year survival from single severe TBI), and extending beyond the entorhinal cortex to involve wider grey matter regions including the hippocampus (iii; 87-year-old male 5-year survival from single severe TBI). (B) While the proportion of patients in TBI and controls with tau pathologies was similar, following TBI the extent and distribution of pathology were considerably greater. Thus, using a semiquantitative scheme to score tau distribution, while all but four controls showed no or only localized tau pathology (score 0 or 1), in a majority of TBI cases (9 of 15) P-tau pathology was widespread (score 2 or 3; P = 0.0035; χ2). All sections stained for PHF-1. Scale bar = 100 µm.
Figure 2
Figure 2
Evidence of tau pathology in mouse TBI. AT8 immunostaining and quantification of the AT8-positive area in the ipsilateral and contralateral cortex of sham and TBI mice at 3 and 12 months post-injury. (A and B) AT8 immunoreactivity is detected in the ipsilateral (ipsi) pericontusional cortical area in two of four mice at 3 months post-TBI, and in all mice at 12 months. (C and D) In the contralateral cortex AT8 immunoreactivity is detected only after 12 months post-TBI. Data are mean ± SEM; n = 4–5; *P < 0.05; **P < 0.01 by one-way ANOVA, Tukey post hoc test. Scale bar = 100 µm (B and D).
Figure 3
Figure 3
Widespread tau pathology in mice 12 months post-TBI. Examples of tau immunostaining with the AT180 (A and F), PHF1 (B), and AT8 (CE, G and H) antibodies in the cerebral cortex (A and B), CA1 (C) and CA3 (D) fields of the hippocampus, and in the zona incerta (E and F). Examples of clusters of small to medium sized, rounded, ‘grain-like’ profiles, in the zona incerta (G), and granular profiles along a cortical vessel (H; arrows). Scale bars: 20 µm (AD and G); 10 µm (E and F); 50 µm (H).
Figure 4
Figure 4
Inoculation of contused tissues induces memory deficits in wild-type mice. (A) Groups of mice used in the inoculation studies. C57BL/6J male mice were either left untreated (open bar) or inoculated bilaterally into the hippocampus and overlaying cerebral cortex with 10% brain homogenates from sham mice (grey) or from the contused (TBIipsi, indigo) or contralateral (TBIcontra, magenta) hemisphere at 12 months post-TBI. (B and C) Recognition memory was investigated by the novel object recognition (NOR) test at 8 (B) and 12 (C) months after inoculation. Performance in the novel object recognition task was expressed as discrimination index (the higher the discrimination index the better the performance). (D and E) Locomotor activity was similar in naïve, sham and TBI inoculated mice at 8 (D) and 12 (E) months after inoculation. Data are mean ± SEM; *P < 0.05, versus naïve; #P < 0.05 versus sham by one-way ANOVA, Tukey post hoc test.
Figure 5
Figure 5
Memory deficits are already detected at 4 months post-inoculation. (A) Scheme of the groups of mice used in the inoculation studies. C57BL/6J male mice were either left untreated (open bar) or inoculated bilaterally into the hippocampus and overlaying cerebral cortex with 10% brain homogenates from sham (grey) or TBI (contused hemisphere, indigo) mice 12 months post-injury. (B and C) Recognition memory was investigated by novel object recognition (NOR) test at 4 (B) and 8 (C) months after inoculation. Histograms indicate the discrimination index (the higher the discrimination index the better the performance). (D and E) Locomotor activity was similar in sham and TBI inoculated mice at 4 (D) and 8 (E) months after inoculation. Data are mean ± SEM, n = 11–14. ***P < 0.001, **P < 0.01 versus naïve; ##P < 0.01 versus sham; by one-way ANOVA, Tukey post hoc test.
Figure 6
Figure 6
Synaptic alterations in the hippocampus of TBI inoculated mice. (A and B) Representative images of immunofluorescence staining and quantitative analysis of presynaptic (VGLUT-1; A) and postsynaptic (drebrin; B) markers in the hippocampus of the inoculated mice at 12 months post-inoculation. Data are mean ± SEM; n = 5–6; *P < 0.05; **P < 0.01 by unpaired t-test. Scale bar = 10 µm. (C) Representative electron micrographs of stratum oriens synapses, and quantification of the thickness and area of the postsynaptic density in sham and TBI inoculated mice. Data are mean ± SEM; n = 3. *P < 0.05 by unpaired t-test. Scale bar = 100 nm.
Figure 7
Figure 7
Evidence of tau pathology in mice inoculated with TBI homogenates. Quantification of the per cent area covered by AT8 staining in the cortex (AC), hippocampus (DF), thalamus (GI), and cerebellum (JL). Data are mean ± SEM; n = 3–6; *P < 0.05; **P < 0.01 by unpaired t-test. Scale bars = 100 µm (BI) and 200 µm (K and L).
Figure 8
Figure 8
Widespread tau pathology in mice inoculated with TBI homogenates. Representative micrographs of tau immunostaining in the brains of mice inoculated with sham (A) and TBI (B–K) homogenates. Examples of immunostaining with AT8 (AC, F–H and K), PHF1 (D, I and J) and conformation-dependent antibody MC1 (E) in the hippocampus (A, B, E and F), cerebral cortex (C and D), thalamus (G–I) and cerebellum (J and K). CA1 and CA3 = fields of the hippocampus; LMol = stratum lacunosum molecolare; M = molecular layer; PC = Purkinje cell layer; G = granule cell layer. Scale bars = 200 µm (A and B); 50 µm (C); 20 µm (E–G, J and K); 10 µm (D and H); 5 µm (I).

Comment in

References

    1. Ahmed Z, Cooper J, Murray TK, Garn K, McNaughton E, Clarke H et al. . A novel in vivo model of tau propagation with rapid and progressive neurofibrillary tangle pathology: the pattern of spread is determined by connectivity, not proximity. Acta Neuropathol 2014; 127: 667–83. - PMC - PubMed
    1. Bouybayoune I, Mantovani S, Del Gallo F, Bertani I, Restelli E, Comerio L et al. . Transgenic fatal familial insomnia mice indicate prion infectivity-independent mechanisms of pathogenesis and phenotypic expression of disease. PLoS Pathog 2015; 11: e1004796. - PMC - PubMed
    1. Braak H, Braak E. Staging of Alzheimer’s disease-related neurofibrillary changes. Neurobiol Aging 1995; 16: 271–8. - PubMed
    1. Chiesa R. The elusive role of the prion protein and the mechanism of toxicity in prion disease. PLoS Pathog 2015; 11: e1004745. - PMC - PubMed
    1. Clavaguera F, Akatsu H, Fraser G, Crowther RA, Frank S, Hench J et al. . Brain homogenates from human tauopathies induce tau inclusions in mouse brain. Proc Natl Acad Sci USA 2013; 110: 9535–40. - PMC - PubMed

Publication types

MeSH terms