Comparative Study
. 2018 Nov 16;46(20):e123.
doi: 10.1093/nar/gky691.

SeSAMe: reducing artifactual detection of DNA methylation by Infinium BeadChips in genomic deletions

Affiliations
Comparative Study

SeSAMe: reducing artifactual detection of DNA methylation by Infinium BeadChips in genomic deletions

Wanding Zhou et al. Nucleic Acids Res. .

Abstract

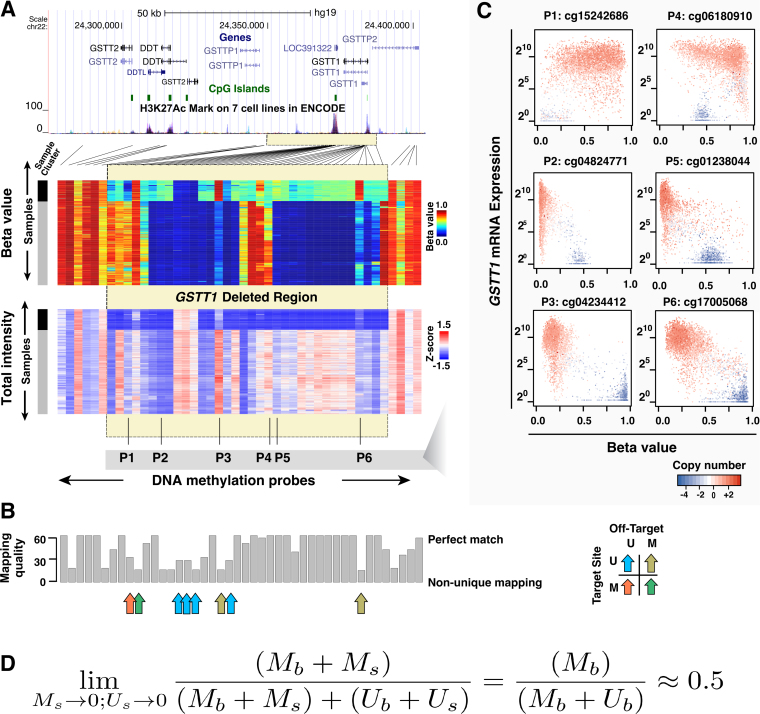
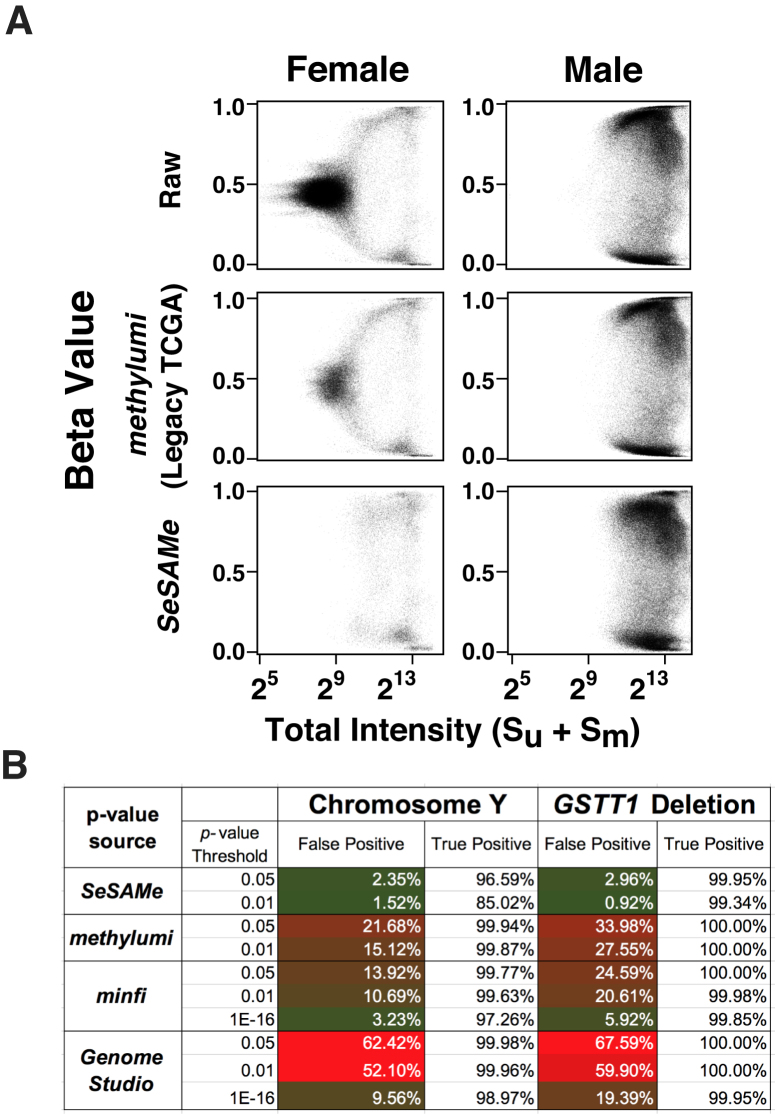
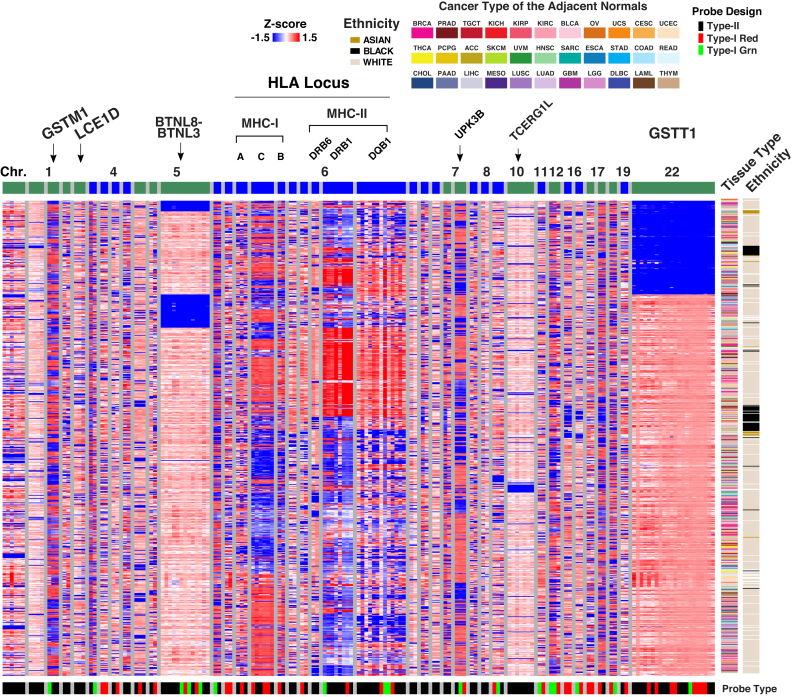
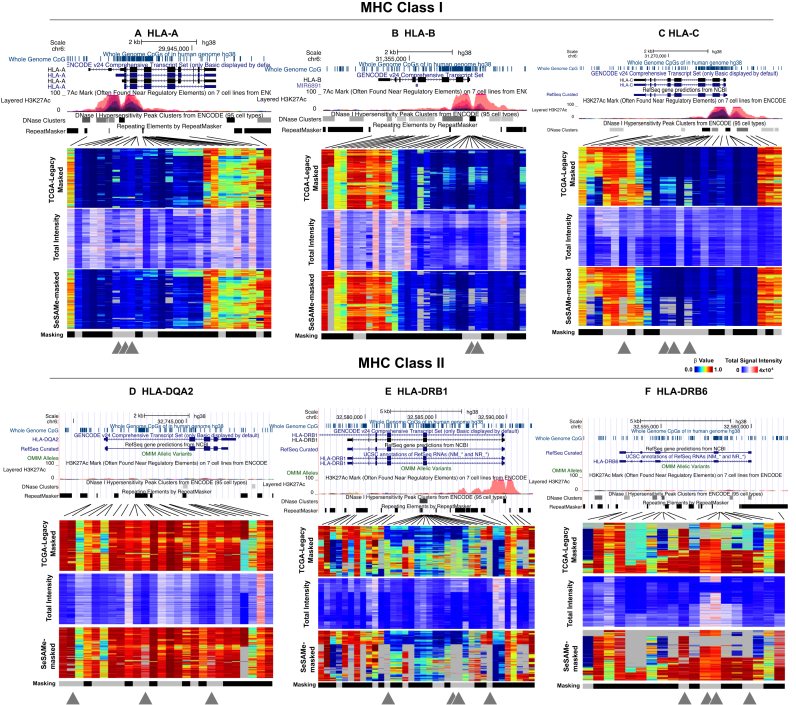
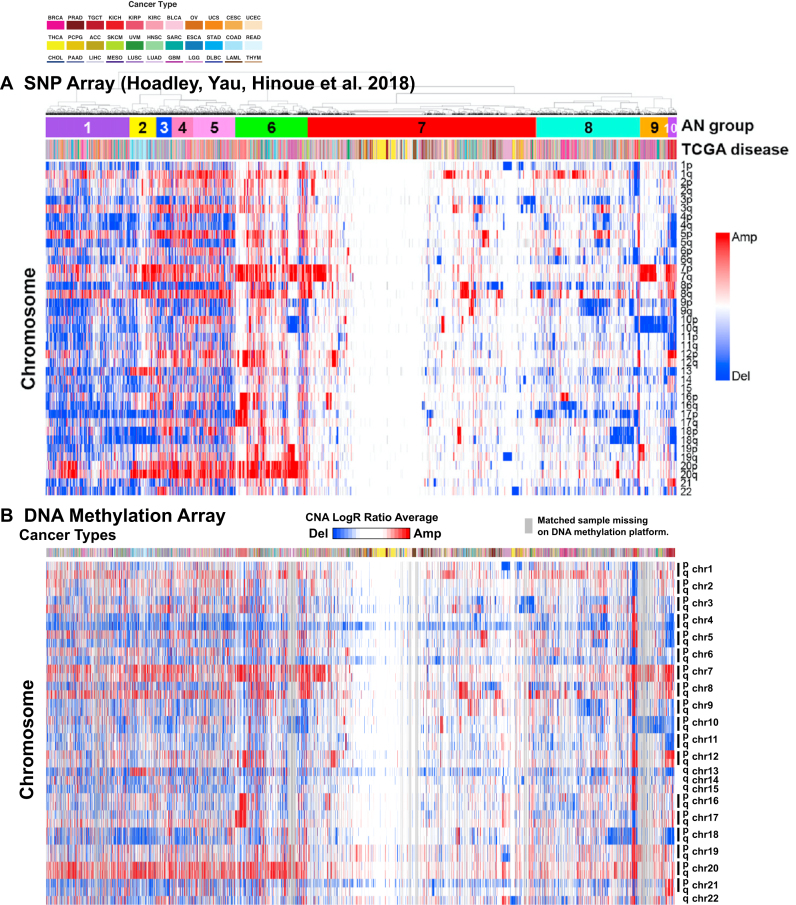
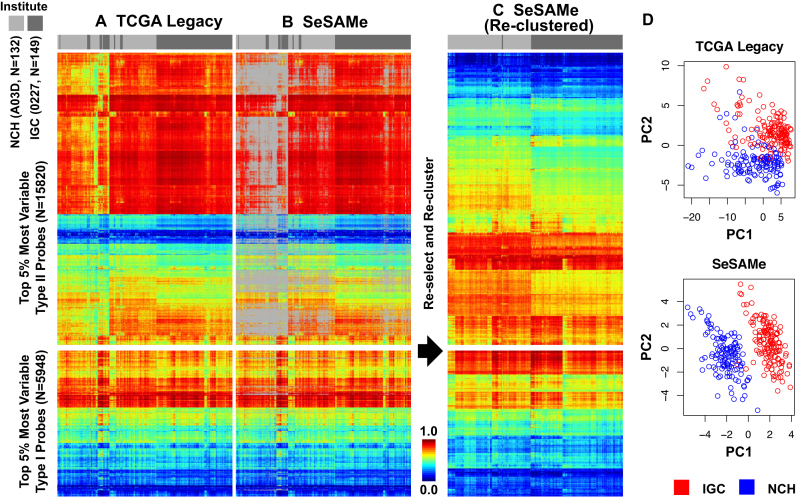
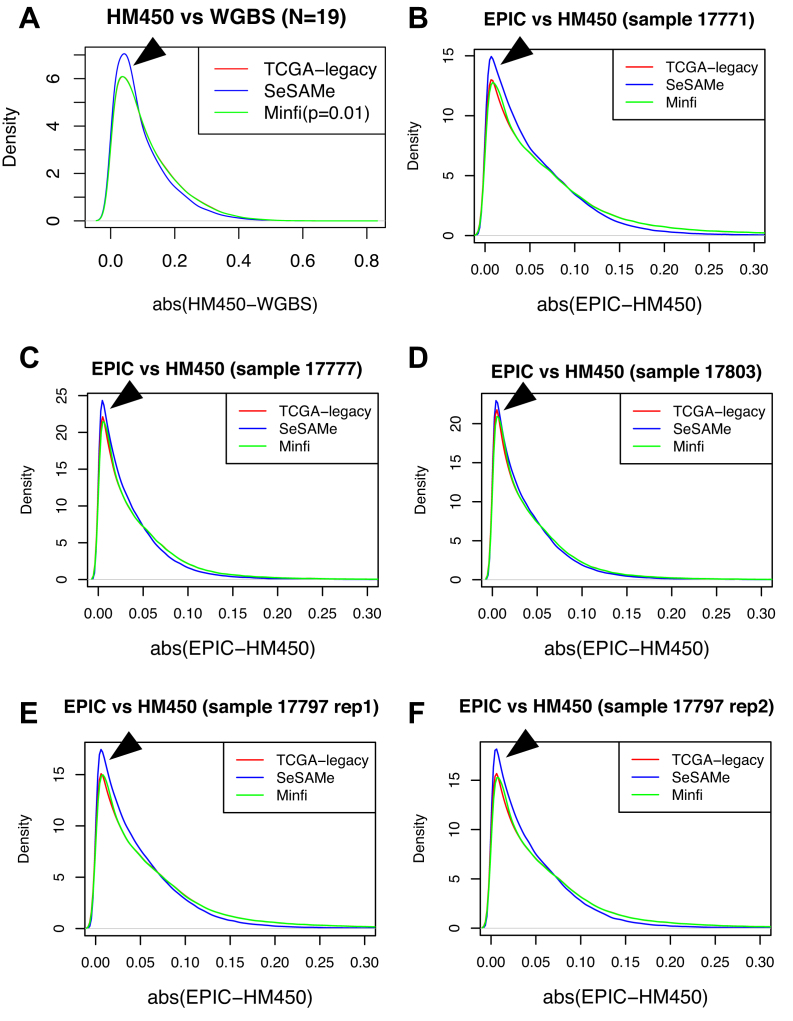
We report a new class of artifacts in DNA methylation measurements from Illumina HumanMethylation450 and MethylationEPIC arrays. These artifacts reflect failed hybridization to target DNA, often due to germline or somatic deletions and manifest as incorrectly reported intermediate methylation. The artifacts often survive existing preprocessing pipelines, masquerade as epigenetic alterations and can confound discoveries in epigenome-wide association studies and studies of methylation-quantitative trait loci. We implement a solution, P-value with out-of-band (OOB) array hybridization (pOOBAH), in the R package SeSAMe. Our method effectively masks deleted and hyperpolymorphic regions, reducing or eliminating spurious reports of epigenetic silencing at oft-deleted tumor suppressor genes such as CDKN2A and RB1 in cases with somatic deletions. Furthermore, our method substantially decreases technical variation whilst retaining biological variation, both within and across HM450 and EPIC platform measurements. SeSAMe provides a light-weight, modular DNA methylation data analysis suite, with a performant implementation suitable for efficient analysis of thousands of samples.


Figures

Figure 1.
Figure 1.
Germline deletion causes low total intensity measurements and creates spurious epigenetic silencing patterns at the GSTT1 locus. (A) Heatmaps showing formula image values (top) and total intensities (bottom) of HM450 probes at the GSTT1 locus (columns) in TCGA normal samples (rows). Lines connect probes with actual genomic locations. Yellow box indicates the deleted region. Probe and sample orders are matched in the two heatmaps. Two clusters of samples can be seen on these heatmaps (left sidebar), with black representing samples that carry homozygous GSTT1 deletions. Probes P1-P6 designate example probes shown in Panel C. (B) Mapping quality of probes plotted in Panel A. Arrows indicate probes in the deleted region that did not exhibit the signature intermediate methylation. Color of arrow indicates different combinations of methylation patterns at on-target and off-target sites (M - methylated; U - unmethylated); (C) Expression (y-axis) plotted against formula image value (x-axis) for the six example probes as indicated in Panel A, showing various spurious correlation patterns, including patterns strongly emblematic of epigenetic silencing. (D) Formular representation of how low signal intensities lead to intermediate DNA methylation readout.
Figure 2.
Figure 2.
SeSAMe effectively removes non-detection artifacts that survive existing pipelines. (A) formula image values (y-axis) against total signal intensities of Y-chromosome probes (x-axis) in TCGA normal primary tissue samples (376 males and 369 females), with raw data (top), TCGA Legacy formula image values (middle) and SeSAMe processed data (bottom). (B) Evaluation of false positive and true positive rates of detection associated with different pipelines, using chromosome Y and GSTT1 deletion for benchmarking.
Figure 3.
Figure 3.
Probe total signal intensities in 40 structurally variable and hyperpolymorphic regions supported by more than one probe. Each row corresponds to one of the 749 tumor-adjacent normal samples included in TCGA with the cancer type and patient ethnicity shown on the right. Columns correspond to probes ordered by chromosomes and then genomic locations. Probes are organized by segments (see text) separated with grey vertical bars. An alternating color is assigned on top of the heatmap to distinguish different chromosomes. The design type and color channel of measurement for each probe is shown at the bottom of the heatmap.
Figure 4.
Figure 4.
Examples for HLA loci including MHC class I (top row) and class II (bottom row) demonstrating germline hyperpolymorphism affecting DNA methylation readouts. From left to right: (A) HLA-A, (B) HLA-B, (C) HLA-C, HLA-DQA2 (D), HLA-DRB1 (E) and HLA-DRB6 (F). For each locus, three heatmaps are plotted, with rows representing samples and columns DNA methylation probes. Top panel shows formula image values from TCGA Legacy data. Middle panel shows normalized total signal intensity Z-score. Bottom panel shows formula image values as masked by SeSAMe based on new detection value. An additional ‘masked’ track below each heatmap indicates probes that SeSAMe masks in general due to overlap with SNPs or non-unique mapping (black). Gray triangles below each probe indicates probes that escape this general masking but effectively masked by SeSAMe.
Figure 5.
Figure 5.
SeSAMe masks probes with low total probe intensities caused by somatic deletions of the RB1 locus in cancer. formula image values (top and middle) and total intensities (bottom) of 55 probes at RB1 locus plotted in 265 sarcoma tumor samples from TCGA. Four normal adjacent tissue samples were also included on the top of each heatmap. SeSAMe preprocessing (middle) and contrasted against TCGA level 3 data (top). Tumor samples were clustered based on TCGA preprocessing.
Figure 6.
Figure 6.
Arm-level amplifications and deletions inferred for about 10,000 tumors from 33 cancer types using SNP6 array (n = 10,522) (A) and Infinium DNA methylation microarrays (n = 9821) (B). SNP6 array result is adapted from an earlier study (41). Samples are matched between the two panels, with samples present on the SNP6 platform but not the DNA methylation platform replaced with a gray line. For Infinium microarrays, the arm-level average copy number aberration probabilities are plotted in the heatmap from blue to red, with blue indicating arm-level deletion and red indicating amplification following the SNP6 array plot. Rows correspond to mean Log R ratio averaged from probes mapped to the given chromosome arm. Each column corresponds to a primary cancer with color in the top bar showing the cancer type. The color legends for the cancer types are shown on the top.
Figure 7.
Figure 7.
SeSAMe preprocessing improves clustering of TCGA cell line replicates driven by small biological differences associated with two different institutes (IGC and NCH with barcodes 0227 and A03D, respectively) performing initial independent expansion of the same cell line (See text). (A) Clustering heatmap showing incomplete separation of 0227 and A03D replicates (columns) in existing TCGA Legacy DNA methylation formula image values, based on top variable probes (rows); (B) SeSAMe effectively masks spurious intermediate methylation visible in A; (C) Clustering after SeSAMe masking, with top variable probes (rows) re-selected based on SeSAMe’s masking and re-clustered. Samples are now better clustered by whether they are 0227 or A03D; (D) PCA analysis showing the first two principal components (PC1 and PC2) in TCGA Legacy data and SeSAMe remasked data.
Figure 8.
Figure 8.
SeSAMe reduces inter-platform discrepancies. (A) Distribution of the absolute difference between HM450 formula image value and methylation level measurement from matched WGBS, with data processed through three different pipelines. (BF) Distribution of the absolute difference in formula image values measured on the HM450 and EPIC platforms on overlapping probes. Each panel shows a different sample assayed on both platforms.

References

    1. Teschendorff A.E., Relton C.L.. Statistical and integrative system-level analysis of DNA methylation data. Nat. Rev. Genet. 2018; 19:129–147. - PubMed
    1. Cancer Genome Atlas Research Network Ley T.J., Miller C., Ding L., Raphael B.J., Mungall A.J., Robertson A.G., Hoadley K., Triche T.J., Laird P.W. et al. . Genomic and epigenomic landscapes of adult de novo acute myeloid leukemia. N. Engl. J. Med. 2013; 368:2059–2074. - PMC - PubMed
    1. Flanagan J.M. Epigenome-wide association studies (EWAS): past, present, and future. Methods Mol. Biol. 2015; 1238:51–63. - PubMed
    1. Wahl S., Drong A., Lehne B., Loh M., Scott W.R., Kunze S., Tsai P.-C., Ried J.S., Zhang W., Yang Y. et al. . Epigenome-wide association study of body mass index, and the adverse outcomes of adiposity. Nature. 2017; 541:81–86. - PMC - PubMed
    1. van Dijk S.J., Peters T.J., Buckley M., Zhou J., Jones P.A., Gibson R.A., Makrides M., Muhlhausler B.S., Molloy P.L.. DNA methylation in blood from neonatal screening cards and the association with BMI and insulin sensitivity in early childhood. Int. J. Obes. 2018; 42:28–35. - PubMed

Publication types