Multicenter Study
. 2018 Nov 29;24(12):2565-2578.
doi: 10.1093/ibd/izy242.

Mucosal Gene Expression in Pediatric and Adult Patients With Ulcerative Colitis Permits Modeling of Ideal Biopsy Collection Strategy for Transcriptomic Analysis

Affiliations
Multicenter Study

Mucosal Gene Expression in Pediatric and Adult Patients With Ulcerative Colitis Permits Modeling of Ideal Biopsy Collection Strategy for Transcriptomic Analysis

Jodie Ouahed et al. Inflamm Bowel Dis. .

Abstract

Background: Transcriptional profiling has been performed on biopsies from ulcerative colitis patients. Limitations in prior studies include the variability introduced by inflammation, anatomic site of biopsy, extent of disease, and medications. We sought to more globally understand the variability of gene expression from patients with ulcerative colitis to advance our understanding of its pathogenesis and to guide clinical study design.

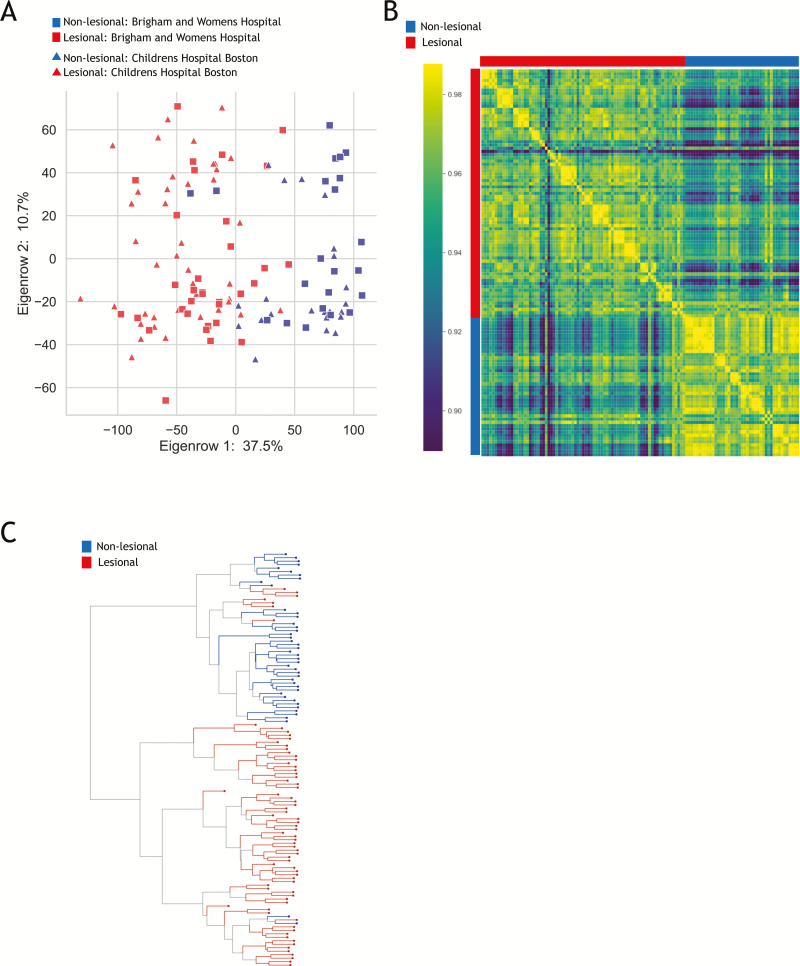
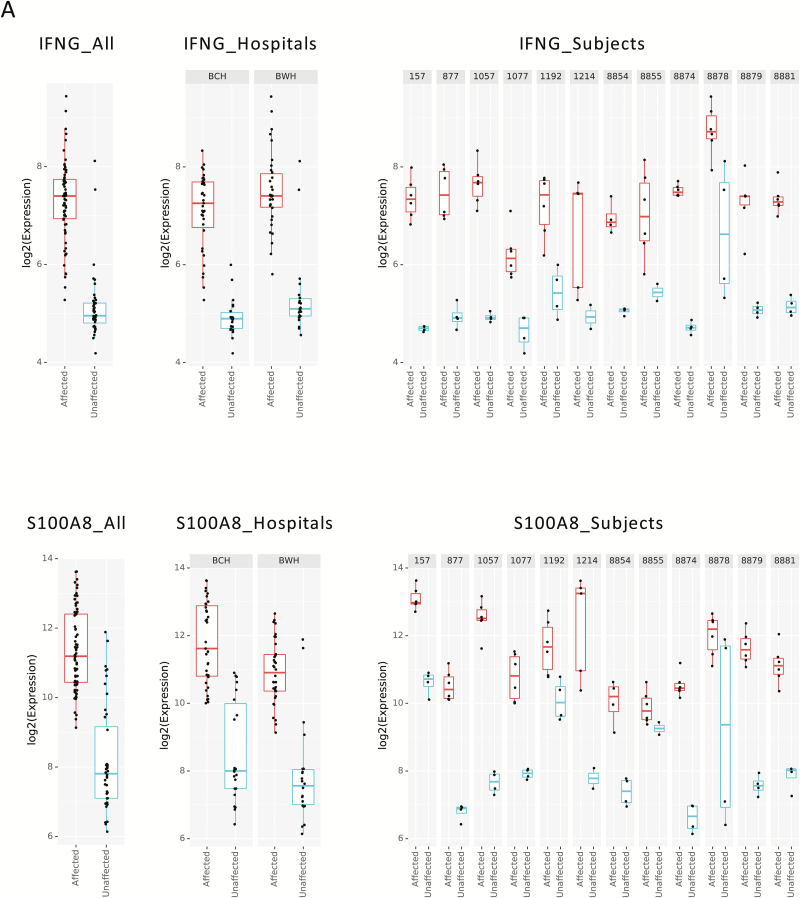
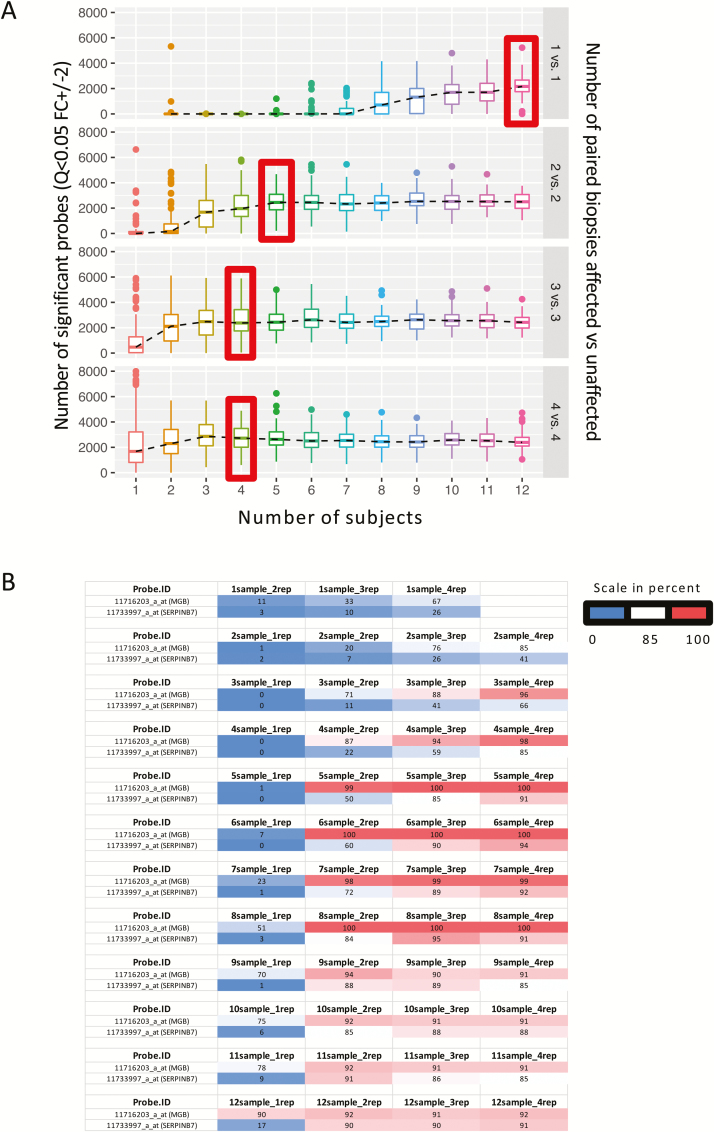
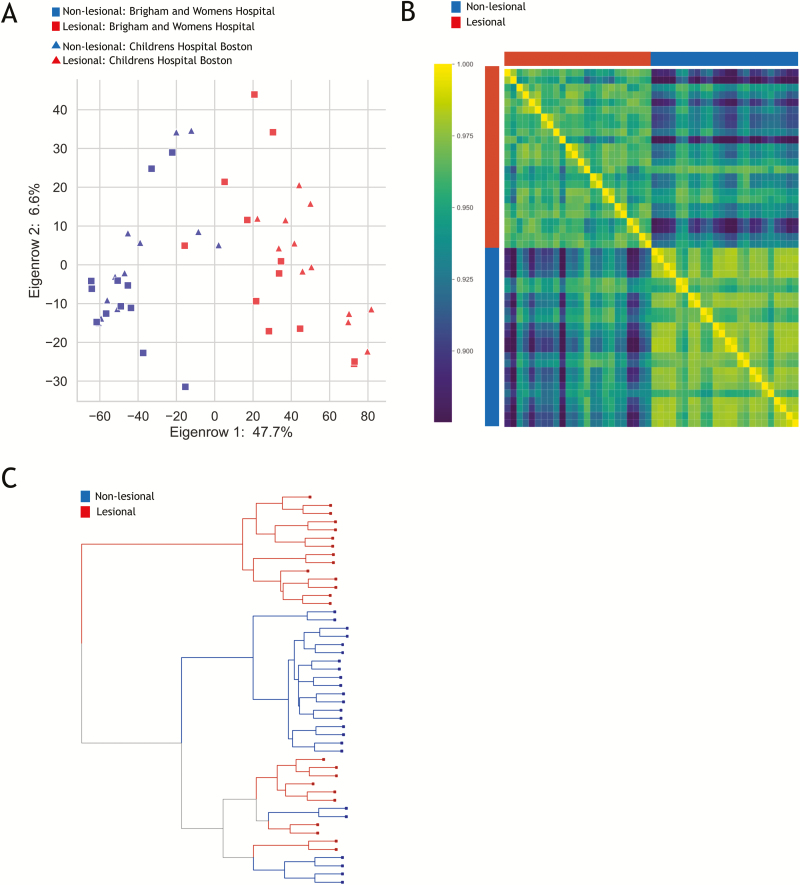
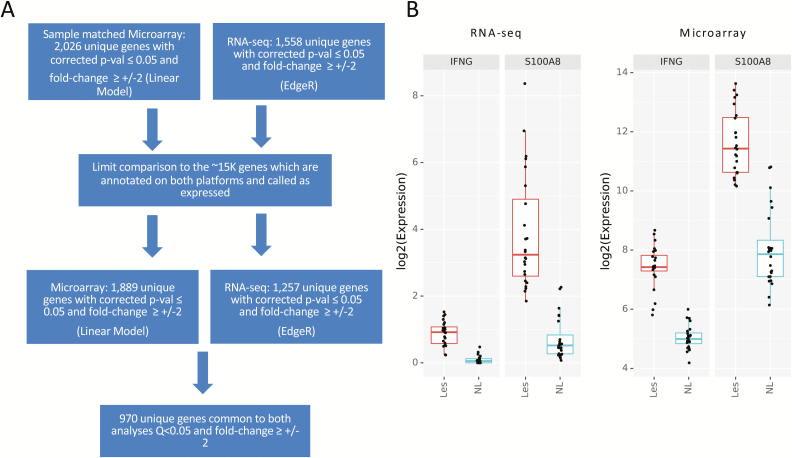
Methods: We performed transcriptional profiling on 13 subjects, including pediatric and adult patients from 2 hospital sites. For each patient, we collected 6 biopsies from macroscopically inflamed tissue and 4 biopsies from macroscopically healthy-appearing tissue. Isolated RNA was used for microarray gene expression analysis utilizing Affymetrix Human Primeview microarrays. Ingenuity pathway analysis was used to assess over-representation of gene ontology and biological pathways. RNAseq was also performed, and differential analysis was assessed to compare affected vs unaffected samples. Finally, we modeled the minimum number of biopsies required to reliably detect gene expression across different subject numbers.

Results: Transcriptional profiles co-clustered independently of the hospital collection site, patient age, sex, and colonic location, which parallels prior gene expression findings. A small set of genes not previously described was identified. Our modeling analysis reveals the number of biopsies and patients per cohort to yield reliable results in clinical studies.

Conclusions: Key findings include concordance, including some expansion, of previously published gene expression studies and similarity among different age groups. We also established a reliable statistical model for biopsy collection for future clinical studies.


Figures

FIGURE 1.
FIGURE 1.
Microarray results. A, PCA plot of transcriptional profiles comparing biopsies collected from areas of macroscopically active inflammation (red) with those collected from macroscopically noninflamed tissue (blue). Samples collected at BWH are in squares whereas those collected at BCH are depicted as triangles. Note that there is no strong difference between biopsies taken at different centers. B, Heatmap also reflecting high correlation among the set of affected biopsies and within the set of unaffected biopsies. C, Hierarchical clustering also illustrating clear distinction between the majority of affected and unaffected biopsies.
FIGURE 2.
FIGURE 2.
Illustrative examples of gene expression. A, IFNG transcriptional level reflected in combined affected vs unaffected samples in both hospitals combined (left panel), center-specific data (middle panel), and among individual subjects (right panel), reflecting consistency in the data. B, S100A8 transcriptional level reflected in combined data from affected vs unaffected samples in both hospitals combined (left panel), center-specific data (middle panel), and among individual subjects (right panel), reflecting consistency in the data.
FIGURE 3.
FIGURE 3.
Modeling of multiple biopsies. A, Graph depicting that with increased number of subjects (x axis) or increased number of paired biopsies (1 in affected vs 1 in unaffected, as compared with 2 in each group, 3 in each group, or 4 in each group, right y axis), the number of significant probes increases (left y axis). B, Table exemplifying the chance (in percent) for 2 illustrative genes (MGB and SERPINB7) to be called as significantly different between affected and unaffected biopsies when increasing either the number of subjects (referred to as samples) or number of biopsies (replicates referred to as rep).
FIGURE 4.
FIGURE 4.
RNAseq of selected biopsies. A, PCA plot of gene expression profiles of comparing areas of macroscopically active inflammation (red) with those collected from macroscopically noninflamed tissue (blue). Samples collected at BWH are in squares, whereas those collected at BCH are depicted as triangles. Note that there is no strong difference between biopsies taken at different centers. B, Heatmap reflecting high correlation among the set of affected biopsies and within the set of unaffected biopsies. C, Hierarchical clustering also illustrating clear distinction between majority of affected and unaffected biopsies.
FIGURE 5.
FIGURE 5.
RNAseq compared with matched microarray. A, Flow chart depicting differential analysis for microarray limited to both the matching samples in mRNAseq and matching genes called as expressed, identifying a total of 970 differentially expressed genes in common between the platforms. B, Illustrative example of the differential gene expression of 2 genes, IFNG and S100A8, using RNAseq (left) and microarry (right) among affected (Les) and unaffected (NL) tissue.

References

    1. Kappelman MD, Moore KR, Allen JK, et al. . Recent trends in the prevalence of Crohn’s disease and ulcerative colitis in a commercially insured US population. Dig Dis Sci. 2013;58:519–525. - PMC - PubMed
    1. Xavier RJ, Podolsky DK. Unravelling the pathogenesis of inflammatory bowel disease. Nature. 2007;448:427–434. - PubMed
    1. Abraham C, Cho JH. Inflammatory bowel disease. N Engl J Med. 2009;361:2066–2078. - PMC - PubMed
    1. Jostins L, Ripke S, Weersma RK, et al. ; International IBD Genetics Consortium (IIBDGC) Host-microbe interactions have shaped the genetic architecture of inflammatory bowel disease. Nature. 2012;491:119–124. - PMC - PubMed
    1. Cutler DJ, Zwick ME, Okou DT, et al. ; PRO-KIIDS Research Group Dissecting allele architecture of early onset IBD using high-density genotyping. PLoS One. 2015;10:e0128074. - PMC - PubMed

Publication types