Review
. 2020 Mar;1464(1):5-29.
doi: 10.1111/nyas.13948. Epub 2018 Aug 7.

The present and future use of functional near-infrared spectroscopy (fNIRS) for cognitive neuroscience

Affiliations
Review

The present and future use of functional near-infrared spectroscopy (fNIRS) for cognitive neuroscience

Paola Pinti et al. Ann N Y Acad Sci. 2020 Mar.

Abstract

The past few decades have seen a rapid increase in the use of functional near-infrared spectroscopy (fNIRS) in cognitive neuroscience. This fast growth is due to the several advances that fNIRS offers over the other neuroimaging modalities such as functional magnetic resonance imaging and electroencephalography/magnetoencephalography. In particular, fNIRS is harmless, tolerant to bodily movements, and highly portable, being suitable for all possible participant populations, from newborns to the elderly and experimental settings, both inside and outside the laboratory. In this review we aim to provide a comprehensive and state-of-the-art review of fNIRS basics, technical developments, and applications. In particular, we discuss some of the open challenges and the potential of fNIRS for cognitive neuroscience research, with a particular focus on neuroimaging in naturalistic environments and social cognitive neuroscience.

Keywords: basics of fNIRS; cognitive neuroscience; ecological; fNIRS; social neuroscience.


Figures

Figure 1
Figure 1
Illustration of the path (shown in red) followed by the NIR photons from the light source to the detector through the different layers of the head. The penetration depth of the light is proportional to the source–detector distance (d 1: deeper channel; d 2: superficial channel). A channel is composed by the pair source–detector and is located at the midpoint between the source and the detector and at a depth of around the half of the source–detector separation.
Figure 2
Figure 2
Continuous wave devices measure light attenuation due to scattering and absorption based on intensity measurements of the input (I IN) and output (I OUT) light. Attenuation is evaluated by computing the logarithm of the ratio between I IN and I OUT that is related to changes in hemoglobin concentration. The first attenuation measurement is subtracted to the following attenuation values to remove the effect of scattering, melanin, and water concentrations (differential spectroscopy). The changes in attenuation ΔA are related to the changes in chromophore concentrations (Δc, either HbO2 or HbR) by the modified Beer–Lambert law. Note that d represents the source–detector distance, ε is the extinction coefficient of the chromophore at a certain wavelength λ, and the DPF is the differential pathlength and indicates the increase in the photon path due to scattering.
Figure 3
Figure 3
Example of HbO2 (red) and HbR (blue) signals from a representative channel (circled in magenta in panel C) of a single subject over the visual cortex using the fNIRS Hitachi ETG‐4000 (equipped with up to 52 channels) during a block‐designed flashing checkerboard experiment, stimulating the occipital cortex bilaterally (A). The gray areas refer to the stimulation period. Panel B shows the block‐averaged hemodynamic response (mean ± SD) computed by averaging the HbO2 and HbR signals presented in A across the 10 task blocks. It is characterized by simultaneous HbO2 increase and HbR decrease. Panel C presents the distribution of the maximum block‐averaged concentration changes within the gray block shown in Panel B across all the channels, both for HbO2 (top) and HbR (bottom). The bilateral occipital cortices consistently respond to the full flashing checkerboard, as shown by the more red for HbO2 and more blue HbR channels.
Figure 4
Figure 4
Example of HbO2 (red) and HbR (blue) signals from one channel (circled in magenta in panel C) of a single subject over the PFC using the fNIRS Hitachi WOT system (equipped with 16 channels) during a block‐designed prospective memory experiment (A). The gray areas refer to the stimulation period. Panel B shows the block‐averaged hemodynamic response (mean ± SD) computed by averaging the HbO2 and HbR signals presented in A across the task blocks. It is characterized by simultaneous HbO2 increase and HbR decrease. Panel C presents the distribution of the maximum block‐averaged concentration changes within the gray block shown in panel B across all the channels, both for HbO2 (top) and HbR (bottom). PFC activity was elicited by the prospective memory task, as shown by the more red for HbO2 and more blue for HbR channels.
Figure 5
Figure 5
Example of HbO2, HbR, and HbT (HbT = HbO2 + HbR) signals measured with fNIRS and BOLD signal measured with fMRI in the occipital cortex during visual stimulation (A). Panel B shows the frequency spectra of the four signals. The figure is taken from the study in Ref. 51 using an in‐house developed diffuse optical tomography system equipped with 24 light sources and 28 detectors. The figure is reprinted from Ref. 51 with permission from Elsevier.
Figure 6
Figure 6
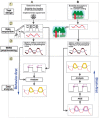
Example of neuroimaging experiment pipelines with fNIRS in case of typical computer‐based (A) and ecological (B) experiments. In the first case, the timeline of the stimuli is predetermined (A1) and fNIRS data are recorded synchronously to that (A2). Preprocessed fNIRS data (A3) are used to assess the presence of significant hemodynamic changes (yellow areas, A4) feeding conventional analysis methods (A4) with the events timeline (behavior‐first). In ecological experiments, tasks do not have a particular structure (B1) and fNIRS data are recorded continuously (B2). New methods such as AIDE (B4) are then able to recover the timeline of functional events from preprocessed fNIRS data (B3, brain‐first) by looking at particular patterns in HbO2 and HbR signals (magenta areas, B4). The recovered events can be used to assess the presence of functional activation (yellow areas, B4).
Figure 7
Figure 7
(A) Example of a participant carrying out the ecological prospective memory task described in Ref. 60 in the real world where brain activity is monitored over the PFC by a portable, wearable, and fibreless fNIRS system (WOT‐100, Hitachi, Japan; now sold by NeU Corporation, Japan). (B) Example of a participant freely moving in unrestrained situations outside the lab while functional brain activity is measured over the PFC through a portable and wearable fNIRS device (LIGHTNIRS, Shimadzu, Japan); such system is equipped with optical fibers that are connected to a control unit, carried through a backpack.
Figure 8
Figure 8
Examples of Gambian infants from 6 to 24 months undertaking the study described in Ref. 105 (A). Data were recorded using the UCL optical topography system with 12 channels. A change in the specialization to auditory social stimuli were found between the 4‐ and 8‐month‐old (green) infants and the 9–13 (orange), 12–16 (red), 18–24 (purple) months old cohorts in the anterior temporal cortex (B). HbO2 and HbR (here HHb) responses are indicated by full and dashed lines, respectively.106 The figure was modified with permission from Ref. 84 under the terms of the Creative Commons Attribution License (CC BY); photo credit to the Bill and Melinda Gates Foundation.
Figure 9
Figure 9
(A) The hyperscanning setup used in Ref. 81 is illustrated using the Shimadzu LABNIRS system (84 channels) synchronized with visual simulation monitors, eye‐tracking glasses, voice recording microphones, rotating dials providing a continuous analogue report of subjective responses, and wall mounted Kinect cameras for facial classifications. All components are the same for both participants and synchronized by triggers. Photo courtesy of Hirsch Brain Function Laboratory, Yale School of Medicine. (B) Cross‐brain synchrony is measured by wavelet coherence analysis and shown here for the condition of real eye‐to‐eye contact as compared to mutual gaze at a picture face and eyes. The illustration shows subsystems within the left temporal–parietal complex including the supramarginal gyrus (SMG), superior temporal gyrus (STG), middle temporal gyrus (MTG), the sub central area (SCA), and left premotor (pM) cortex that resonate more during real face‐to‐face eye‐to‐eye contact than viewing a face/eye picture (P < 0.001). These correlations between real partners disappeared when the partners were computationally scrambled, confirming that the coherence across partner brains was a result of actual real‐time reciprocal events and not general viewing of a moving face.81

References

    1. Lloyd‐Fox, S. , Blasi A. & Elwell C.E.. 2010. Illuminating the developing brain: the past, present and future of functional near infrared spectroscopy. Neurosci. Biobehav. Rev. 34: 269–284. - PubMed
    1. Vanderwert, R.E. & Nelson C.A.. 2014. The use of near‐infrared spectroscopy in the study of typical and atypical development. Neuroimage 85(Pt 1): 264–271. - PMC - PubMed
    1. Liu, T. , Liu X., Yi L., et al 2017. Assessing autism at its social and developmental roots: a review of autism spectrum disorder studies using functional near‐infrared spectroscopy. Neuroimage. 10.1016/j.neuroimage.2017.09.044. - DOI - PubMed
    1. Keehn, B. , Wagner J.B., Tager‐Flusberg H., et al 2013. Functional connectivity in the first year of life in infants at‐risk for autism: a preliminary near‐infrared spectroscopy study. Front. Hum. Neurosci. 7: 444. - PMC - PubMed
    1. Ishii‐Takahashi, A. , Takizawa R., Nishimura Y., et al 2014. Prefrontal activation during inhibitory control measured by near‐infrared spectroscopy for differentiating between autism spectrum disorders and attention deficit hyperactivity disorder in adults. Neuroimage Clin. 4: 53–63. - PMC - PubMed

Publication types

MeSH terms