. 2018 Nov;155(5):1608-1624.
doi: 10.1053/j.gastro.2018.08.007. Epub 2018 Aug 4.

Disruption of C1galt1 Gene Promotes Development and Metastasis of Pancreatic Adenocarcinomas in Mice

Affiliations

Disruption of C1galt1 Gene Promotes Development and Metastasis of Pancreatic Adenocarcinomas in Mice

Seema Chugh et al. Gastroenterology. 2018 Nov.

Abstract

Background & aims: Pancreatic ductal adenocarcinomas (PDACs) produce higher levels of truncated O-glycan structures (such as Tn and sTn) than normal pancreata. Dysregulated activity of core 1 synthase glycoprotein-N-acetylgalactosamine 3-β-galactosyltransferase 1 (C1GALT1) leads to increased expression of these truncated O-glycans. We investigated whether and how truncated O-glycans contributes to the development and progression of PDAC using mice with disruption of C1galt1.

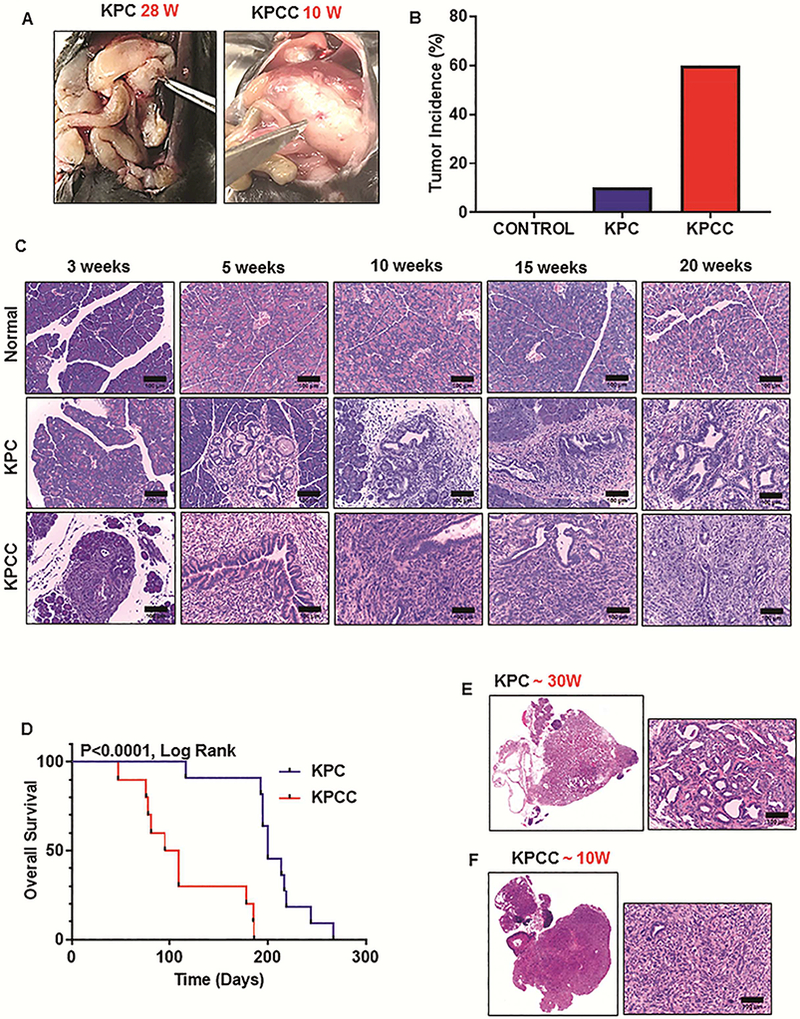
Methods: We crossed C1galt1 floxed mice (C1galt1loxP/loxP) with KrasG12D/+; Trp53R172H/+; Pdx1-Cre (KPC) mice to create KPCC mice. Growth and progression of pancreatic tumors were compared between KPC and KPCC mice; pancreatic tissues were collected and analyzed by immunohistochemistry; immunofluorescence; and Sirius red, alcian blue, and lectin staining. We used the CRISPR/Cas9 system to disrupt C1GALT1 in human PDAC cells (T3M4 and CD18/HPAF) and levels of O-glycans were analyzed by lectin blotting, mass spectrometry, and lectin pulldown assay. Orthotopic studies and RNA sequencing analyses were performed with control and C1GALT1 knockout PDAC cells. C1GALT1 expression was analyzed in well-differentiated (n = 36) and poorly differentiated (n = 23) PDAC samples by immunohistochemistry.

Results: KPCC mice had significantly shorter survival times (median 102 days) than KPC mice (median 200 days) and developed early pancreatic intraepithelial neoplasias at 3 weeks, PDAC at 5 weeks, and metastasis at 10 weeks compared with KPC mice. Pancreatic tumors that developed in KPCC mice were more aggressive (more invasive and metastases) than those in KPC mice, had a decreased amount of stroma, and had increased production of Tn. Poorly differentiated PDAC specimens had significantly lower levels of C1GALT1 than well-differentiated PDACs. Human PDAC cells with knockout of C1GALT1 had aberrant glycosylation of MUC16 compared with control cells and increased expression of genes that regulate tumorigenesis and metastasis.

Conclusions: In studies of KPC mice with disruption of C1galt1, we found that loss of C1galt1 promotes development of aggressive PDACs and increased metastasis. Knockout of C1galt1 leads to increased tumorigenicity and truncation of O-glycosylation on MUC16, which could contribute to increased aggressiveness.

Keywords: Mouse Model; Pancreas; Pancreatic Intraepithelial Neoplasias; Post-Translational Modification.


Conflict of interest statement

Conflict of Interest Statement: The authors declare no conflict of interest.

Figures

Figure 1.
Figure 1.
Genomic depletion of C1galt1 results in faster PDAC progression. (A) Gross appearance of pancreatic tumors in KPC (28 weeks) and KPCC (10 weeks) mice. (B) Percentage of tumor-bearing animals in control, KPC and KPCC cohort (n=20 for control, KPC, and KPCC mice; Age ≤ 20 weeks). (C) Representative histological pictures of the pancreas from age-matched control, KPC and KPCC mice at 3, 5, 10, 15, and 20 weeks. (n=5 for control, KPC, and KPCC mice; scale bars represent 100 μm). (D) Kaplan-Meier survival analysis for KPC and KPCC mice (n=11 for KPC and n=10 for KPCC, **p<0.0001 by Mantel-Cox (log rank) test). (E) Representative H and E stained picture of pancreatic tumor from 30-week old KPC mice. (F) Representative H and E stained picture of pancreatic tumor from 10-week old KPCC mice. (Whole slides containing pancreatic sections were scanned at TSF and Scale bars of enlarged pictures represent 100μm).
Figure 2.
Figure 2.
Increased aggressiveness of KPCC tumors compared to KPC tumors. (A) Representative histological pictures of ki-67 staining in KPC and KPCC pancreatic tumors (scale bars represent 50μm). (B) Quantification of ki-67 positive index in KPCC pancreatic tumors compared to KPC tumors (n=4 for KPC and KPCC mice; error bars represent mean ± s.e.m. *P<0.05; by Mann Whitney test). (C) Representative histologic pictures for alpha-SMA staining in KPC and KPCC pancreatic tumors (scale bars represent 50 μm). (D) Scatter dot plot showing alpha-SMA composite score in KPC versus KPCC pancreatic tumors (n=6 for KPC and KPCC mice; error bars represent mean ± s.e.m. *P<0.05; by unpaired two-sided Student’s t-test). (E) Representative immunofluorescence staining for alpha-SMA in KPC and KPCC pancreatic tumors (scale bars represent 100μm). (F) Mean fluorescent intensity of alpha-SMA staining in KPCC pancreatic tumors compared to KPC tumors (n=5 for KPC and KPCC mice; error bars represent mean ± s.e.m. **P<0.005; by Mann Whitney test). (G) Representative Sirius red-staining in KPC and KPCC pancreatic tumors (whole slides containing pancreatic sections scanned at TSF and scale bars represent 50μm). (H) Percentage of Sirius red-positive area in KPC tumors versus KPCC tumors (n=5 for KPC and KPCC mice, *P<0.05; by unpaired two-sided Student’s t-test).
Figure 3.
Figure 3.
Altered glycosylation in KPCC pancreatic tumors. (A) Representative histological pictures showing Alcian blue staining in KPC and KPCC pancreas (scale bars represent 100μm). (B) Alcian blue composite score in KPC vs KPCC pancreatic tissues at different time points (n=4–5 for KPC and KPCC mice *P<0.05; by Mann Whitney test). (C) Representative histological pictures showing T carbohydrate antigen expression in KPC and KPCC pancreatic tumors (scale bars represent 50μm). (D) PNA (T) composite score in KPC tumors vs KPCC tumors (n=6 for KPC and KPCC mice, error bars represent mean ± s.e.m. *P<0.05; by Mann Whitney test). (E) Representative fluorescent pictures showing T carbohydrate antigen staining in KPC and KPCC pancreatic tumors (scale bars represent 100μm). (F) Mean fluorescent intensity of T carbohydrate antigen in KPCC tumors compared to KPC pancreatic tumors (error bars represent mean ± s.e.m. *P<0.05; by Mann Whitney test). (G) Representative histologic pictures showing Tn carbohydrate antigen expression in KPC and KPCC pancreatic tumors. (scale bars represent 50μm). (H) VVA (Tn) composite score in KPC tumors vs KPCC tumors (n=6 for KPC and KPCC mice; error bars represent mean ± s.e.m. **P<0.005; by Mann Whitney test). (I) Representative fluorescent pictures showing Tn carbohydrate antigen staining in KPC and KPCC pancreatic tumors (scale bars represent 50μm). (J) Mean fluorescent intensity of Tn carbohydrate antigen in KPCC tumors compared to KPC tumors (n=6 for KPC and KPCC; error bars represent mean ± s.e.m. **P<0.005; by Mann Whitney test).
Figure 4.
Figure 4.
Loss of C1galt1 resulted in enhanced metastasis. (A) Percentage of animals with metastasis in KPCC mice compared to KPC mice (n=15 for KPC and KPCC mice; age ≤ 15 weeks) (B) Representative H & E pictures showing metastatic lesions in peritoneum and stomach in KPCC mice (scale bars represent 200 μm). (C) qPCR analysis of epithelial markers-E cadherin and Claudin-1 in KPCC pancreatic tumor relative to KPC tumor (error bars represent mean ± s.e.m., **P<0.005; by unpaired two-sided Student’s t-test). (D) qPCR analysis of mesenchymal markers-Slug, Snail and Vimentin in KPCC pancreatic tumor relative to KPC tumor (error bars represent mean ± s.e.m. * P<0.05, **P<0.005; by unpaired two-sided Student’s t-test). (E) Representative immunofluorescent pictures showing vimentin staining in KPC and KPCC pancreatic tumors (scale bars represent 50 μm). (F) Mean fluorescent intensity of vimentin in KPCC pancreatic tumors compared to KPC tumors (n=6, error bars represent mean ± s.e.m. **P<0.005; by Mann Whitney test). (G) Representative immunohistochemical pictures showing vimentin staining in KPC and KPCC pancreatic tumors (scale bars represent 50 μm). (H) Vimentin composite score in KPCC pancreatic tumors compared to KPC (n=7 for KPC and KPCC mice; error bars represent mean ± s.e.m. **P<0.005; by Mann Whitney test).
Figure 5.
Figure 5.
Truncated glycophenotype with CRISPR/Cas9 knockout of C1GALT1 in human PDAC cells. (A) C1GALT1 composite score in well differentiated and poorly differentiated PDAC tissues. Representative immunohistochemical pictures showing C1GALT1 staining in welldifferentiated and poorly-differentiated PDAC (**P<0.005; by Mann Whitney test; scale bars represent 50 μm). (B) Composite score of Tn versus T carbohydrate antigens in PDAC tissues. Representative immunohistochemical pictures of Tn and T carbohydrate antigens in PDAC (**P<0.005; by Mann Whitney test; scale bars represent 50 μm). (C) Confirmation of C1GALT1 knockout in T3M4 PDAC cells (D) C1GALT1 enzyme activity was assayed by mixing cell lysates from wild-type and C1GALT1 knockout T3M4 cells with substrate GalNAcα-O-Benzyl in presence of UDP-Gal. Relative abundance of original substrate (top panel) and product (bottom panel) quantified based on area under curve of MS1 peak for corresponding molecule. All structures validated using MS/MS analysis. (E) Core 1 synthase enzyme activity in wild-type T3M4 cells (control) and three different knockouts (Clone 1–3). Absence of Galβ1,3GalNAcα-OBenzyl product in T3M4-KO clones indicated by asterisk. (F) Expression of Tn and sTn carbohydrate antigen in control versus C1GALT1 KO T3M4 clones. (G) Per-acetylated GalNAcα-O-Benzyl was fed to wild-type and C1GALT1 KO cells. Products collected from supernatant were assayed using LC-MS, with structure validation performed using MS/MS analysis and knowledge of biochemistry. All glycans depicted using Symbol Nomenclature for Glycans. Structures that could not be unequivocally identified are indicated using curly bracket symbols.
Figure 6.
Figure 6.
C1GALT1 KO Induces Increased Metastasis, Tumorigenicity, and Aberrant MUC16 Glycosylation. (A) Quantification of growth using WST-1 assay in control and C1GALT1 knockout T3M4 PDAC clones (B) Quantification of wound closure in C1GALT1 KO T3M4 PDAC clones compared to control cells (Data represents mean ± SD of three replicates; *P<0.05, **P<0.005 by unpaired two-sided Student’s t-test). (C) Upper panel: Schematic representation of development of migratory sublines using Boyden Chamber Assay. Series of migration assays with progressive decrease in incubation time lead to development of highly migratory M4 and M5 sublines. Representative picture from migration assay demonstrating high migration of M5 migratory subline compared to parental cells. Actin staining further demonstrates altered morphology of M5 migratory subline compared to parental cells. Expression of C1GALT1 in highly migratory M5 subline as compared to parental T3M4 cells. (D) Comparison of tumor weights between orthotopically implanted T3M4 control and C1GALT1 KO clone 2 tumor models (Error bars represent mean ± s.e.m *P<0.05 by Mann Whitney test). (E) Bar diagram showing percentage of animals with metastasis to several organs in orthotopically implanted T3M4 control and C1GALT1 KO clone 2 tumor models. (F) Expression of MUC16 in control and C1GALT1 KO T3M4 PDAC cells. (G) Expression of MUC16 in KPC and KPCC PDAC lysates. (H) Expression of MUC16 in pancreatic tumor from control and C1GALT1 KO xenograft models. (Shift in MUC16 molecular weight is depicted by arrows) (I) Upper panel: Lectin blotting demonstrates effective pull-down of Tn carbohydrate antigen in control and C1GALT1 KO T3M4 cells by VVA pulldown assay. Lower panel: Immunoblotting of VVA pulled down control and C1GALT1 KO lysates with MUC16 demonstrates significant increase of Tn associated with MUC16 in C1GALT1 KO PDAC cells
Figure 7.
Figure 7.
Upregulation of migratory and tumorigenic genes in C1GALT1 KO PDAC cells. (A) Volcano plot demonstrating significant upregulation of aggressive genes in C1GALT1 KO PDAC cells. (B) Ingenuity Pathway analysis using these upregulated genes indicated their involvement in cancer cell migration and tumorigenicity. (C) Western blotting demonstrating expression of growth receptors, signaling proteins and EMT markers in control versus C1GALT1 knockout T3M4 cells. (D) Western blot showing expression of EMT markers (Vimentin, Slug, Snail, Claudin1) in KPC and KPCC PDAC lysates (E) Western blot demonstrating transient knockdown of Vimentin in C1GALT1 KO (clone 2) T3M4 cells. (F) Effect of vimentin knockdown on migration in control and C1GALT1 KO (clone-2) T3M4 cells (Error bars represent mean ± s.e.m *P<0.05 by unpaired two-sided Student’s t-test). (G) Pictorial representation summarizing the impact of C1galt1 knockout in PDAC progression and metastasis. Disruption of C1galt1 gene along with Kras and p53 mutations (KPCC mice) lead to early onset of PDAC and highly aggressive PDAC as compared to KPC mice. Mechanistic insights were gained by C1GALT1 knockout human PDAC cells, which showed truncation of MUC16 O-glycosylation that might facilitate its interaction with growth receptors such as EGFR or signaling proteins such as integrins resulting in activation of downstream signaling molecules (Pfak and pAkt) and increased cancer growth and metastasis.

References

    1. Rahib L, Smith BD, Aizenberg R, et al. Projecting cancer incidence and deaths to 2030: the unexpected burden of thyroid, liver, and pancreas cancers in the United States. Cancer Res 2014;74:2913–21. - PubMed
    1. Siegel RL, Miller KD, Jemal A. Cancer Statistics, 2017. CA Cancer J Clin 2017;67:7–30. - PubMed
    1. Borazanci E, Dang CV, Robey RW, et al. Pancreatic Cancer: “A Riddle Wrapped in a Mystery inside an Enigma”. Clin Cancer Res 2017;23:1629–1637. - PubMed
    1. Leach SD. Mouse models of pancreatic cancer: the fur is finally flying. Cancer Cell 2004;5:7–11. - PubMed
    1. Mazur PK, Siveke JT. Genetically engineered mouse models of pancreatic cancer: unravelling tumour biology and progressing translational oncology. Gut 2012;61:1488–500. - PubMed

Publication types

Substances