

RNA editing of Filamin A pre-mRNA regulates vascular contraction and diastolic blood pressure
- PMID: 30087110
- PMCID: PMC6166124
- DOI: 10.15252/embj.201694813
RNA editing of Filamin A pre-mRNA regulates vascular contraction and diastolic blood pressure
Abstract
Epitranscriptomic events such as adenosine-to-inosine (A-to-I) RNA editing by ADAR can recode mRNAs to translate novel proteins. Editing of the mRNA that encodes actin crosslinking protein Filamin A (FLNA) mediates a Q-to-R transition in the interactive C-terminal region. While FLNA editing is conserved among vertebrates, its physiological function remains unclear. Here, we show that cardiovascular tissues in humans and mice show massive editing and that FLNA RNA is the most prominent substrate. Patient-derived RNA-Seq data demonstrate a significant drop in FLNA editing associated with cardiovascular diseases. Using mice with only impaired FLNA editing, we observed increased vascular contraction and diastolic hypertension accompanied by increased myosin light chain phosphorylation, arterial remodeling, and left ventricular wall thickening, which eventually causes cardiac remodeling and reduced systolic output. These results demonstrate a causal relationship between RNA editing and the development of cardiovascular disease indicating that a single epitranscriptomic RNA modification can maintain cardiovascular health.
Keywords: Filamin A (FLNA); RNA editing; adenosine deaminases acting on RNA (ADAR); cardiovascular disease; hypertension.
© 2018 The Authors. Published under the terms of the CC BY 4.0 license.
Figures
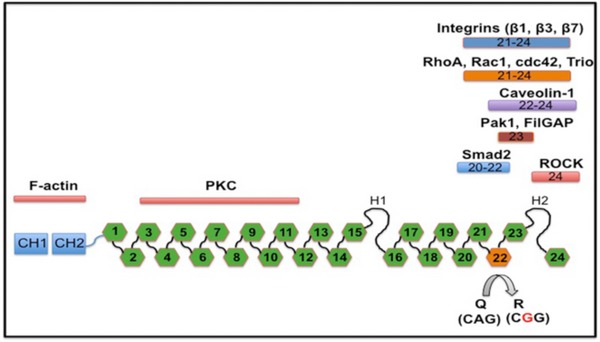
Filamin A protein is composed of 24 Ig‐like repeats. Editing changes Q2341R amino acid in repeat 22 from a glutamine (Q) to an arginine (R), as indicated. Interaction partners to the respective regions are indicated above. The amino terminus harbors an actin‐binding domain, while the C‐terminal end is interacting with integrins, RhoA, Caveolin, Pak1, Smad2, or ROCK. Repeat 24 is required for homo‐ and heterodimerization with Filamin B.
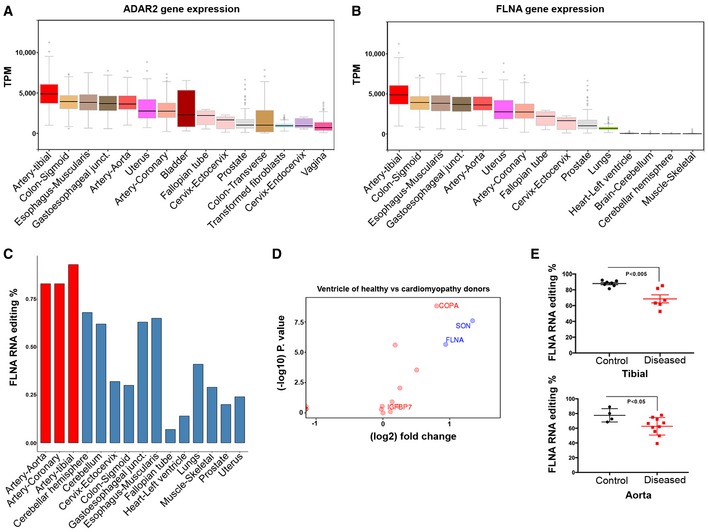
ADAR2 is most strongly expressed in vascular tissues. Graph showing ADAR2 gene expression data derived from GTEx for few representative human tissues. Note the highest expression of ADAR2 in the tibial artery followed by colon and esophagus. Boxes represent the 25th and the 75th percentile with median represented by the black line in the box. The whiskers depict the minimum and the maximum value.
FLNA gene expression in few representative human tissues from > 500 different donors using GTEx data. Tibial artery, colon, and esophagus show highest gene expression similar to ADAR2 expression. Boxes represent the 25th and the 75th percentile with median represented by the black line in the box. The whiskers depict the minimum and the maximum value.
Bar graph shows FLNA RNA editing (%) among few representative human tissues. Note very high editing levels in the arterial system (red bars).
Scatter plot shows the log fold change in editing levels of several candidates between ventricles of healthy donors and heart samples of cardiomyopathy patients. FLNA marked in the graph is one significant discriminator. Y‐axis is the −log 10 of the P‐value for the difference between healthy and sick. The colors (red vs. green) reflect the threshold cutoffs randomly assigned to distinguish the sites, which demonstrate large, highly significant differences between the two groups. Fold change cutoff of 0.9 was used.
Scatter plot shows the FLNA RNA editing in control and diseased human tibial arteries and aortae. At least four control and seven diseased human donors were used in each case. P‐value < 0.05 measured by t‐test was considered significant.
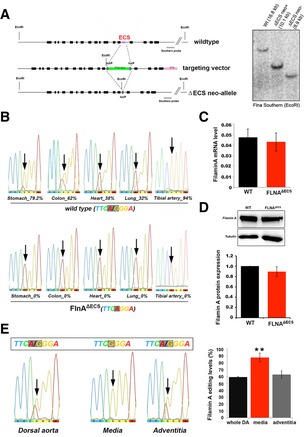
Scheme showing the FLNA wild‐type (wt) allele, the targeting vector, and the FLNAΔECS neo‐allele. The loxP flanked PGK‐neo cassette in the targeting vector replaced the editing complementary sequence (ECS) using homologous recombination, which was then deleted using Cre recombinase. Right, Southern blotting analysis screened for positive clones shown. The positions of loxP sites, restriction enzyme (EcoRI), and Southern blotting probe are also indicated.
Sequencing electropherograms show the average FLNA editing levels in wt and FLNAΔECS tissues (stomach, colon, heart, lung, and tibial artery). Editing levels were checked in tissues from three independent mice, and the value below the chromatogram depicts the average value of three replicates.
FLNA mRNA expression levels measured by qPCR in wt and FLNAΔECS colon tissue showed no difference.
FLNA protein levels measured by Western blotting are identical in wt and FLNAΔECS stomach tissue. Y‐axis represents FLNA expression normalized to tubulin levels.
FLNA editing levels (%) in wt whole dorsal aorta, tunica media, and tunica adventitia. Tunica media consisting of smooth muscle cells show the highest FLNA RNA editing.
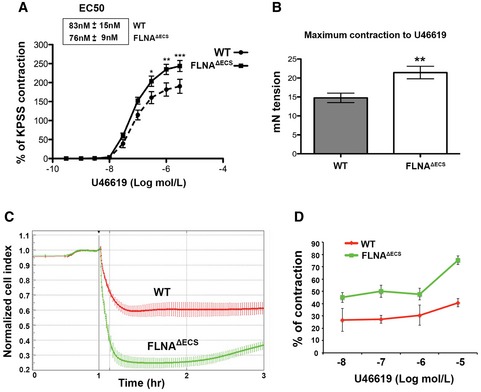
- A, B
Treatment of aortic rings with thromboxane A2 receptor agonist U46619 leads to (A) hypercontraction and (B) increased contraction force in FLNAΔECS aortae in myograph chambers. Emax was higher in FLNAΔECS aortae without any difference in EC50 as compared to wt aortae. For each condition, 10–12 aortic rings from at least four wild‐type (wt) and four FLNAΔECS mice were used. Data are shown as mean ± SEM. *P < 0.05, **P < 0.01, ***P < 0.001 (Student's t‐test)
- C
Graph shows the normalized cell contraction measured by xCELLigence Real‐Time Cell Analyzer in wt (red) and FLNAΔECS (green) primary vascular smooth muscle cells (vSMCs) indicating hypercontraction in FLNAΔECS cells in response to 10 μM U46619. Data are shown as mean ± SD from three independent experiments.
- D
Quantification of cell index measurements plotted as percentage of contraction following different concentrations of U46619. Data are shown as mean ± SD from three independent experiments. P‐value < 0.05 (Student's t‐test) was considered significant. The difference between wt and FLNAΔECS was significant at every concentration of U46619.
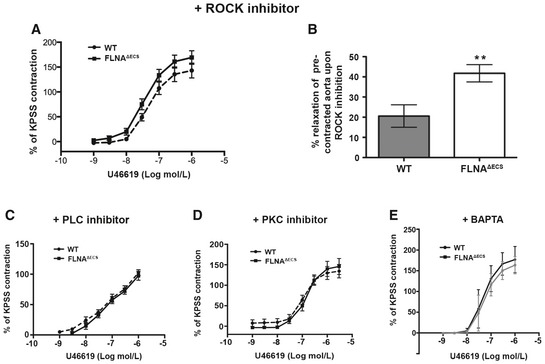
- A
Pre‐inhibition with ROCK inhibitor before U46619 treatment diminishes the increased contraction in FLNAΔECS aortae.
- B
Treatment with the ROCK inhibitor following U46619 pre‐contraction leads to increased relaxation in FLNAΔECS aortae. **P < 0.01 (Student's t‐test).
- C–E
Pre‐inhibition with PLC inhibitor (C), PKC inhibitor (D), BAPTA (E) before U46619 treatment shows similar effects as ROCK inhibitor (A) abrogating the genotype‐specific difference.
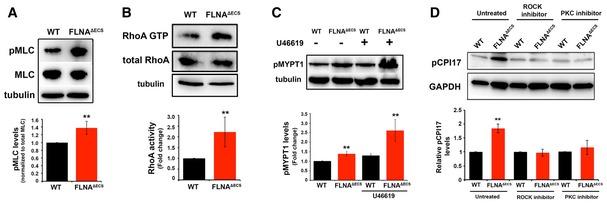
Myosin light chain phosphorylation detected by a phospho‐specific antibody (pMLC) and normalized to total myosin light chain (MLC). Tubulin served as a loading control. Quantification shows a significant increase in pMLC in FLNAΔECS vSMCs.
Rhotekin pull‐down activation assay was performed on wt and FLNAΔECS vSMC lysates, and activated GTP‐bound RhoA was compared between the two genotypes. FLNAΔECS vSMCs show more GTP‐loaded RhoA than wt vSMCs. Tubulin was used as a loading control.
Thromboxane A2 stimulation with U46619 increased phosphorylation of myosin light chain phosphatase (pMYPT1) in FLNAΔECS vSMCs as shown by Western blotting on vSMC lysates with phospho‐specific MYPT1 antibody.
CPI17 phosphorylation levels were measured in wt and FLNAΔECS vSMCs in untreated cells and in the presence of ROCK and PKC inhibitor using pCPI17 antibody.
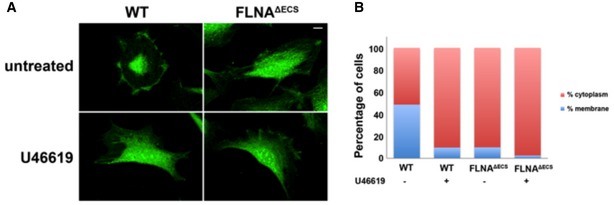
Representative images of wild‐type (wt) and FLNAΔECS vascular smooth muscle cells (vSMCs) stained with P190RhoGAP antibody (green) before and after treatment with 1 μM U46619. Note the change in localization in wt cells after U46619 treatment that looks similar to the untreated cells expressing only unedited FLNA. Scale bar: 20 μm.
Quantification of subcellular localization of p190RhoGAP in wt and FLNAΔECS vSMCs. Graphs are plotted as percentage of cells showing membranous vs. cytoplasmic localization. Data were pooled after counting 250–300 cells in each condition.
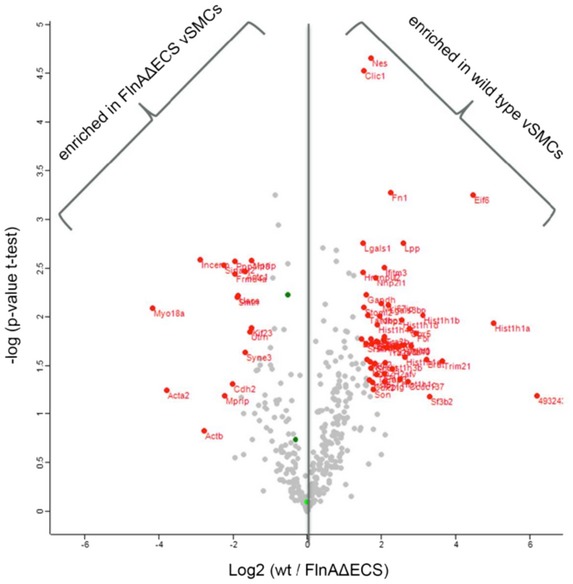
Volcano plot presenting proteins differentially enriched in either of the two sets of Filamin A pull‐down from FLNAΔECS and wild‐type vSMCs. X‐axis represents mean log2 ratio of protein intensities between the two sets, plotted against the negative logarithm of the P‐value from triplicate t‐tests. Proteins marked in red on the left side of central line were enriched in FLNAΔECS vSMCs pull‐downs while the ones on the right side were enriched in wild‐type vSMC pull‐downs (P < 0.05; fold change > 2; modified Student's t‐test). Total counts were first normalized to Filamin A in each data set.
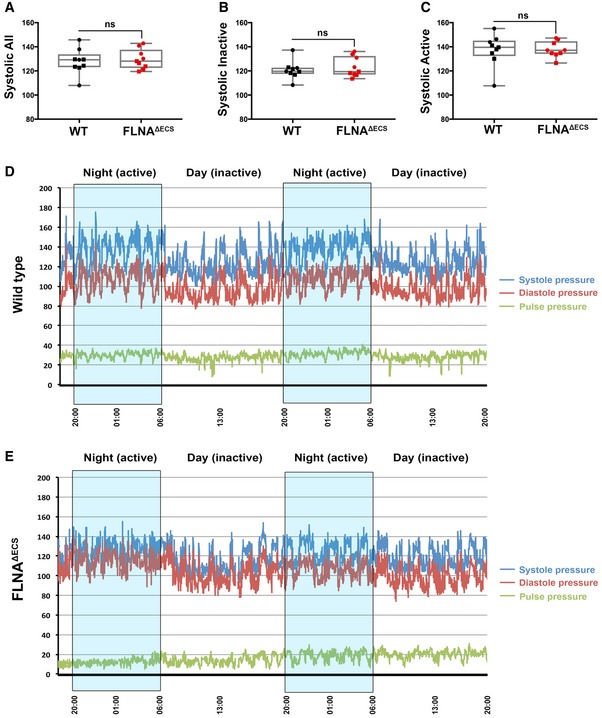
- A–C
Scatter plots showing the systolic blood pressure during a total of 72 h (A), systolic blood pressure during inactive phase (B), and systolic blood pressure during active phase (C). Nine mice were analyzed for each genotype, and the average value is plotted for each mouse. Data are shown as mean ± SEM. Boxes represent the 25th and the 75th percentile with median represented by the black line in the box. The whiskers depict the minimum and the maximum value. P‐value < 0.05 (Student's t‐test) was considered significant.
- D, E
Representative wt (D) and FLNAΔECS (E) mouse showing systolic (blue line) and diastolic (red line) blood pressure for 48 h. The pulse pressure (difference between systolic and diastolic blood pressure) is also indicated (green line). Nighttime (high activity) windows are indicated by blue boxes. In particular, during the resting daylight phases, the FLNAΔECS mice fail to lower their diastolic blood pressure.
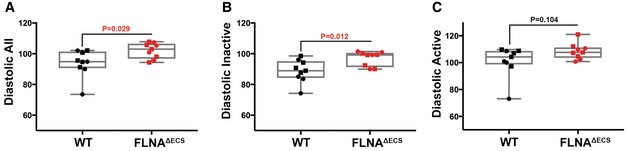
- A–C
Telemetry measurements were done on mice continuously for 72 h, and reading was recorded every minute to analyze blood pressure in wt and FLNAΔECS mice. Scatter plots show diastolic blood pressure over 72 h (A), diastolic blood pressure during inactive phase (B), and diastolic pressure during active phase (C). Note: Significant increase in diastolic blood pressure in FLNAΔECS mice during the inactive phase. Nine mice (five males marked as square + four females marked as round) were analyzed for each genotype. Data are shown as mean ± SEM. P‐value < 0.05 (Student's t‐test) was considered significant. Boxes represent the 25th and the 75th percentile with median represented by the black line in the box. The whiskers depict the minimum and the maximum value.
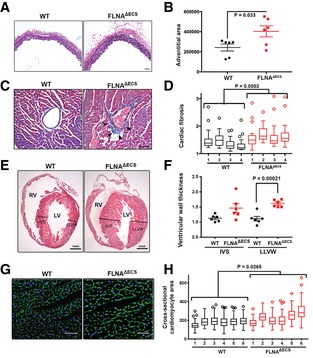
Dorsal aortae were fixed, cross‐sectioned, and then stained with Elastica van Gieson kit to visualize collagen around the blood vessel. Six independent mice (5–6 months old) of each genotype were used for the analysis. Scale bar: 50 μm.
Plot shows individual data points (black—wt, red—mutant) of adventitial area in both the genotypes. Measurements show increased adventitial area in FLNAΔECS aortae. P‐value < 0.05 (Student's t‐test) was considered significant.
Representative heart sections of a 5‐ to 6‐month‐old mice stained with Masson's trichrome kit show increased collagen (blue) around coronary vessels (marked by arrowheads). Scale bar: 50 μm.
Quantification shows a significant increase in perivascular fibrosis in FLNAΔECS hearts. Four sections from each heart were measured. Four mice analyzed for each genotype. P‐value < 0.05 (mixed model approach) was considered significant.
Representative longitudinal heart sections stained with H&E (RV, right ventricle; LV, left ventricle). Black lines represent thickness of interventricular septum (IVS) and lateral left ventricular wall (LLVW). Scale bar: 1 mm.
Scatter graph shows increased ventricular wall thickness in FLNAΔECS mice hearts. Six male mice (6 months old) analyzed for each genotype. P‐value < 0.05 (Student's t‐test) was considered significant.
Heart cross‐sections were stained with FITC‐WGA (wheat germ agglutinin) to visualize cell membranes of cardiomyocytes. Scale bar: 20 μm.
Respective cell areas measured by ImageJ software and represented by box plots for each animal (six per genotype). Boxes represent the 25th and the 75th percentile with median represented by the black line in the box. The whiskers depict the minimum and the maximum value. P‐value < 0.05 (mixed model approach) was considered significant.
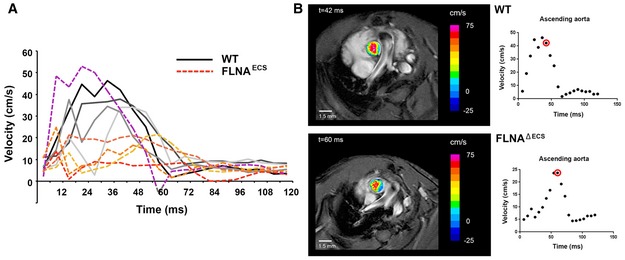
Graph shows the individual blood velocity profile determined by MRI over time in 4 wt mice (shades of gray) and 5 FLNAΔECS mice (shades of red). The mouse shown in dotted purple line is clearly an outlier within the FLNAΔECS cohort. Aortic velocity waveform represents velocity during different stages of cardiac cycle. A significant reduction in velocity was observed at 40 ms in the systolic cycle.
Representative wt (top) and FLNAΔECS (below) mice showing the blood flow just above the aortic valve. Note: Reduced blood flow in FLNAΔECS mouse as depicted by pseudocoloring. The red circle represents the time window at which the images are shown.
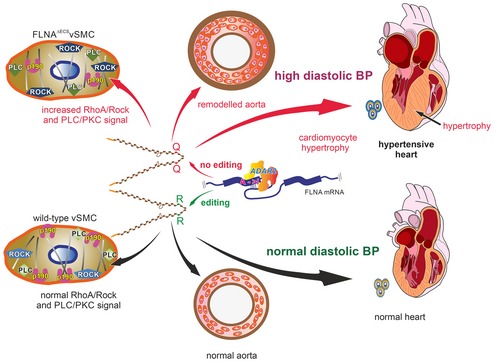
(Top) Lack of editing in Filamin A pre‐mRNA produces a Filamin A isoform that only encodes a glutamine residue (Q) at position 2431. This leads to mislocalization of p190RhoGAP, misregulation of PLC and ROCK signaling, increased MLC phosphorylation, aortic hypercontraction, thickening of the smooth muscle layer, and increased perivascular collagen deposition. Loss of FLNA editing leads to persistently elevated diastolic blood pressure, left ventricular hypertrophy, and cardiac remodeling (Center). Filamin A pre‐mRNA editing by ADAR2 triggers a Q‐to‐R codon exchange at the end of exon 42 (Bottom). Edited FLNA helps localize p190RhoGAP to the cellular cortex where it can inhibit RhoA and regulate the activity of key smooth muscle contraction regulators such as PLC and ROCK machinery. This can maintain normal aortic function and normal diastolic blood pressure to preserve normal heart morphology.
References
-
- Bouchal P, Roumeliotis T, Hrstka R, Nenutil R, Vojtesek B, Garbis SD (2009) Biomarker discovery in low‐grade breast cancer using isobaric stable isotope tags and two‐dimensional liquid chromatography‐tandem mass spectrometry (iTRAQ‐2DLC‐MS/MS) based quantitative proteomic analysis. J Proteome Res 8: 362–373 - PubMed
-
- Bregeon J, Loirand G, Pacaud P, Rolli‐Derkinderen M (2009) Angiotensin II induces RhoA activation through SHP2‐dependent dephosphorylation of the RhoGAP p190A in vascular smooth muscle cells. Am J Physiol Cell Physiol 297: C1062–C1070 - PubMed
Publication types
MeSH terms
Substances
Grants and funding
LinkOut - more resources
Full Text Sources
Other Literature Sources
Medical
Molecular Biology Databases
Miscellaneous
