. 2018 Sep 21;293(38):14891-14904.
doi: 10.1074/jbc.RA117.001469. Epub 2018 Aug 7.

Mitochondria-targeted drugs stimulate mitophagy and abrogate colon cancer cell proliferation

Affiliations

Mitochondria-targeted drugs stimulate mitophagy and abrogate colon cancer cell proliferation

Kathleen A Boyle et al. J Biol Chem. .

Abstract

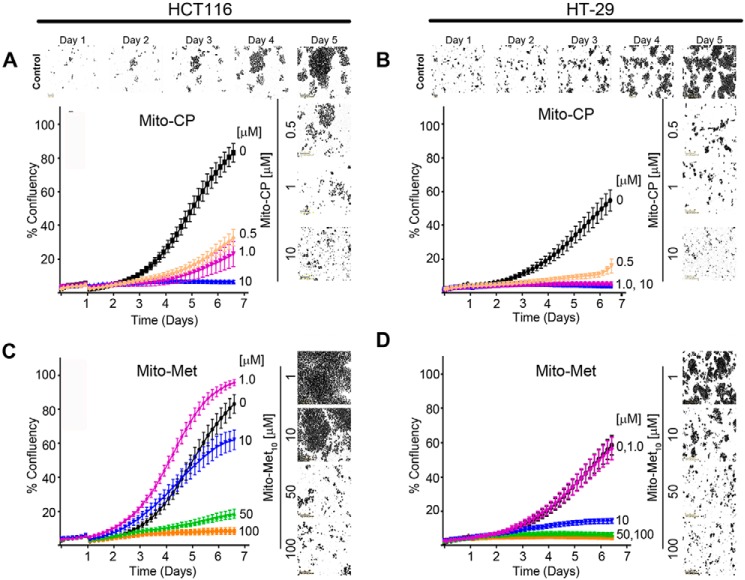
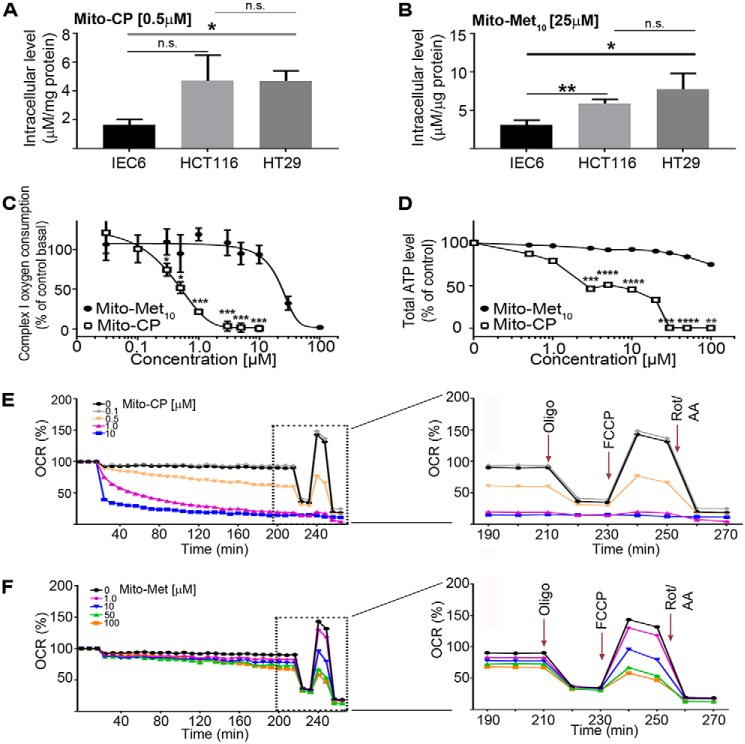
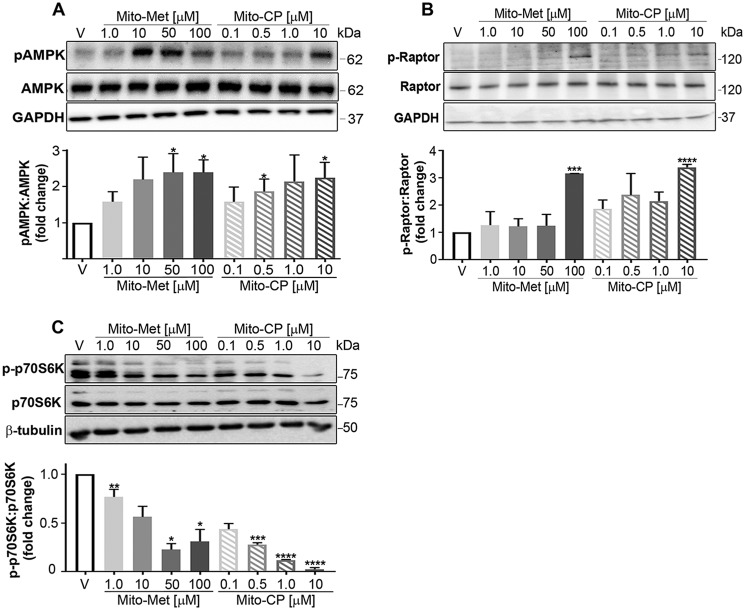
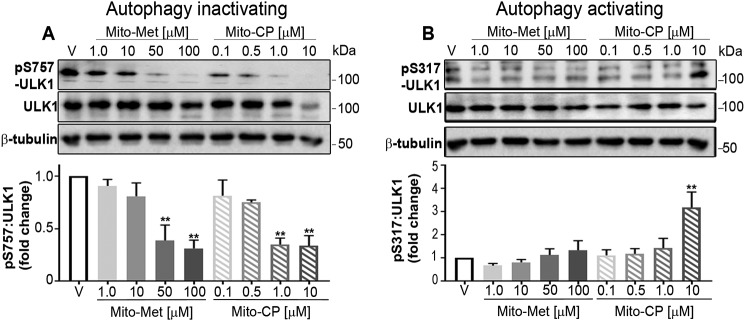
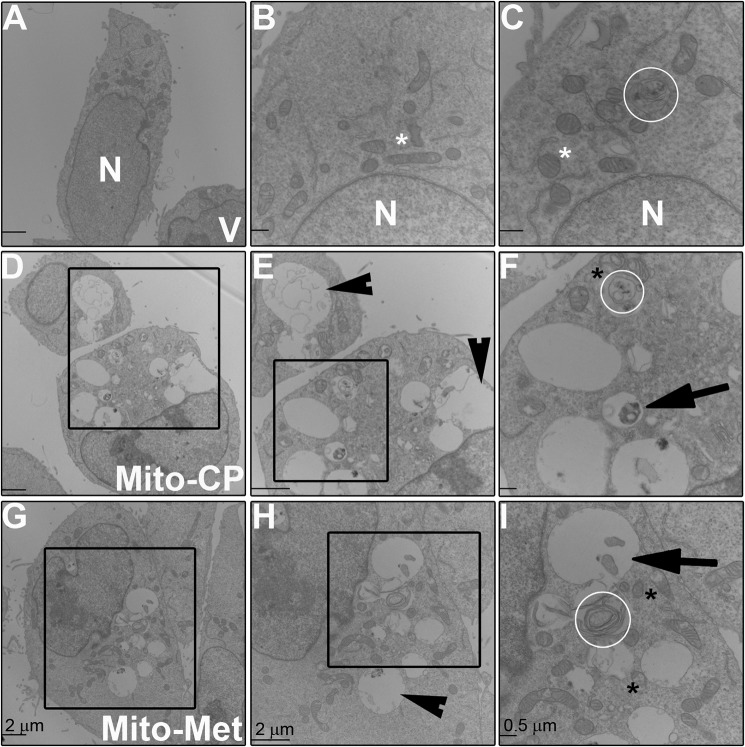
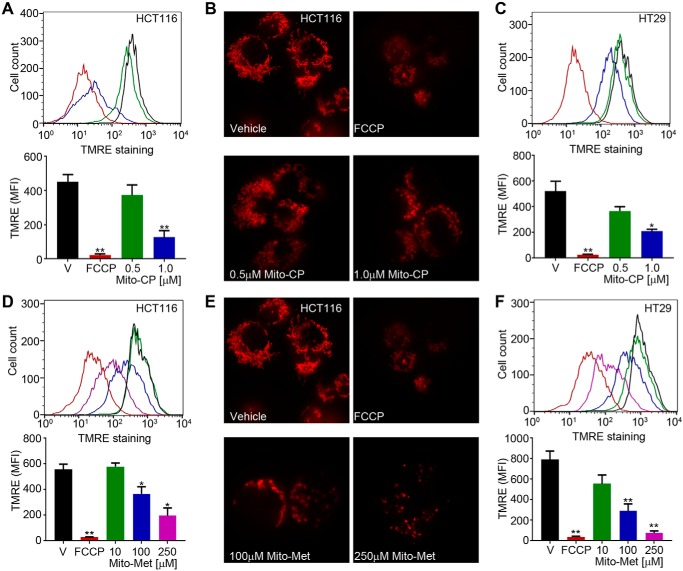
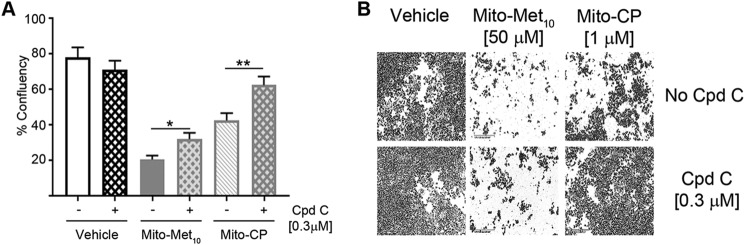
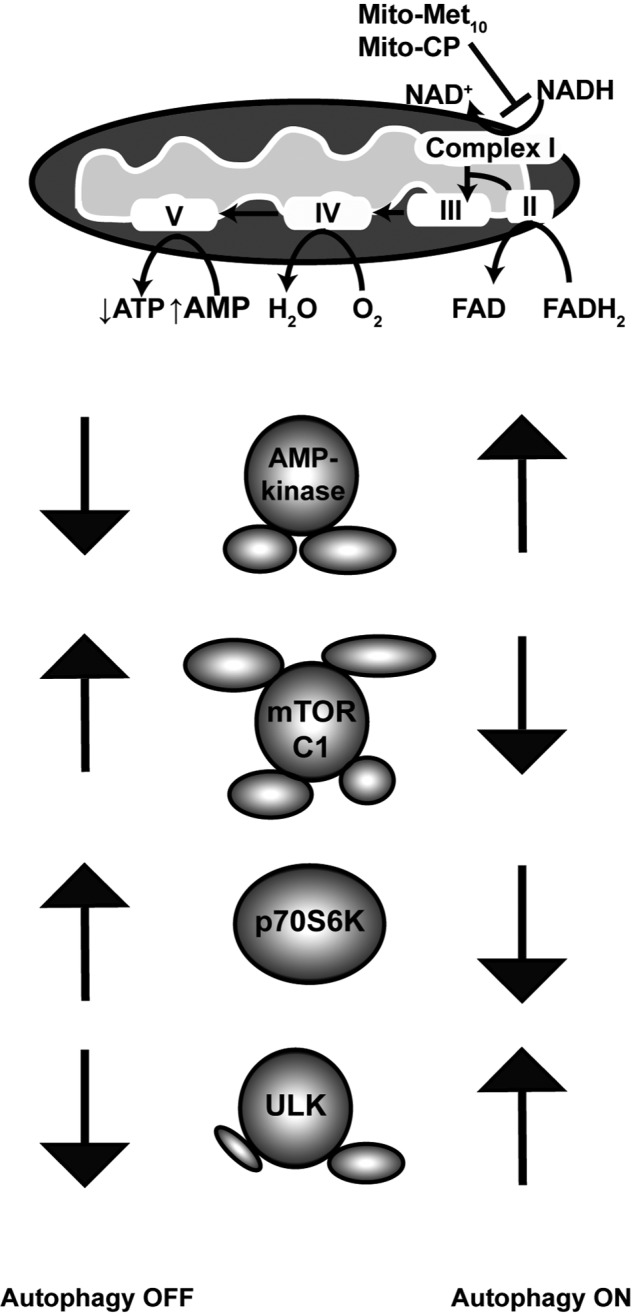
Mutations in the KRAS proto-oncogene are present in 50% of all colorectal cancers and are increasingly associated with chemotherapeutic resistance to frontline biologic drugs. Accumulating evidence indicates key roles for overactive KRAS mutations in the metabolic reprogramming from oxidative phosphorylation to aerobic glycolysis in cancer cells. Here, we sought to exploit the more negative membrane potential of cancer cell mitochondria as an untapped avenue for interfering with energy metabolism in KRAS variant-containing and KRAS WT colorectal cancer cells. Mitochondrial function, intracellular ATP levels, cellular uptake, energy sensor signaling, and functional effects on cancer cell proliferation were assayed. 3-Carboxyl proxyl nitroxide (Mito-CP) and Mito-Metformin, two mitochondria-targeted compounds, depleted intracellular ATP levels and persistently inhibited ATP-linked oxygen consumption in both KRAS WT and KRAS variant-containing colon cancer cells and had only limited effects on nontransformed intestinal epithelial cells. These anti-proliferative effects reflected the activation of AMP-activated protein kinase (AMPK) and the phosphorylation-mediated suppression of the mTOR target ribosomal protein S6 kinase B1 (RPS6KB1 or p70S6K). Moreover, Mito-CP and Mito-Metformin released Unc-51-like autophagy-activating kinase 1 (ULK1) from mTOR-mediated inhibition, affected mitochondrial morphology, and decreased mitochondrial membrane potential, all indicators of mitophagy. Pharmacological inhibition of the AMPK signaling cascade mitigated the anti-proliferative effects of Mito-CP and Mito-Metformin. This is the first demonstration that drugs selectively targeting mitochondria induce mitophagy in cancer cells. Targeting bioenergetic metabolism with mitochondria-targeted drugs to stimulate mitophagy provides an attractive approach for therapeutic intervention in KRAS WT and overactive mutant-expressing colon cancer.

Keywords: AMP-activated kinase (AMPK); KRAS proto-oncogene; cancer biology; cell growth; cell proliferation; colon cancer; metformin; mitochondrial metabolism; mitophagy.


Conflict of interest statement

M. B. D. has ownership interests in Protein Foundry, LLC

Figures

Figure 1.
Figure 1.
Mitochondria-targeted drugs inhibit colon cancer cell proliferation. A–D, HCT116 (A and C) and HT-29 (B and D) colon cancer cell lines were treated with increasing concentrations of Mito-CP (0–10 μm) or Mito-Met10 (0–100 μm). Images were acquired in real time every 2 h over a 6-day period using the IncuCyte S3 and representative phase contrast images are shown. Percent confluency (% confluency) was used as a readout for proliferation. A graphical representation of the dose response on cell confluence is expressed as a change in percentage of cell confluence. Values are mean ± S.E., n = 3; a two-way repeated measures ANOVA demonstrated p ≤ 0.0001.
Figure 2.
Figure 2.
The TPP+-biocompounds Mito-CP and Mito-Met10 impair mitochondrial bioenergetics. A and B, intracellular uptake of the compounds in nontransformed rat small intestine epithelial IEC6 cells, along with the two colon cancer cell lines, HCT116 and HT-29, was assessed after 24 h treatment with 0.5 μm Mito-CP (A) or 25 μm Mito-Met10 (B) using LC-MS/MS. C, complex I inhibition was addressed by treating HCT116 cells with increasing concentrations of Mito-Met10 (filled oval) or Mito-CP (empty rectangle) for 24 h. The mitochondrial complex I oxygen consumption (last oxygen consumption rate reading before succinate injection) is plotted against the drug concentrations. D, total cellular ATP levels were analyzed using a luciferase-based assay on HCT116 cells treated with increasing concentrations of the drugs (Mito-Met10 (filled oval) or Mito-CP (empty rectangle)) for 24 h. E and F, HCT116 mitochondrial respiration impairment after 24 h of treatment (Mito-CP (E) or Mito-Met10 (F)) was measured using the Seahorse XF analyzer. The OCR (pmol/min) was used as a marker for mitochondrial stress. Panels on the right are enlargements of the time course post–stress test drug additions (dashed boxes in E and F) and demarcate the sequential injections of oligomycin (Oligo) to measure ATP-linked OCR, FCCP to measure maximal OCR, and rotenone/antimycin A (Rot/AA) to measure nonmitochondrial respiration. * denotes p ≤ 0.05, ** denotes p ≤ 0.01, *** denotes p ≤ 0.001, **** denotes p ≤ 0.0001. n.s., not significant. Values are mean ± S.E. n = 4.
Figure 3.
Figure 3.
Activation of the AMPK signaling cascade concomitant with mTORC1 suppression is activated and induced mitophagy via ULK1. A, HCT116 cells were starved for glucose, glutamine, and serum for 6 h prior to a 30 min stimulation with increasing concentrations of Mito-Met10 or Mito-CP, or treated with DMSO (V, vehicle). Protein lysates (10 μg/lane) were resolved by SDS-PAGE and probed with antiserum directed toward phospho-Thr-172–AMPK (pAMPK), total AMPK, or GAPDH. Immunoblots were quantitated and represented graphically. B and C, HCT116 cells were treated with DMSO (V, vehicle) or increasing concentrations of Mito-Met10 or Mito-CP for 24 h. Proteins resolved by SDS-PAGE and transferred to PVDF were probed for phospho-Ser-792–Raptor (pRaptor), total Raptor, or GAPDH (B) or phospho-Thr-389–p70S6K, total p70S6K, or β-tubulin (C). * denotes p ≤ 0.05, ** denotes p ≤ 0.01, *** denotes p ≤ 0.001, **** denotes p ≤ 0.0001. Values are means ± S.E. n = 3.
Figure 4.
Figure 4.
MTD treatment shifts the phosphorylation status of ULK1 to promote mitophagy. A, HCT116 cells were treated with DMSO (V, vehicle) or increasing concentrations of Mito-Met10 or Mito-CP for 24 h. Protein lysates (10 μg/lane) were resolved by SDS-PAGE and probed with antiserum directed toward phospho-Ser-757–ULK1, total ULK1, or β-tubulin (A) or phospho-Ser-317–ULK1, total ULK1, or β-tubulin (B). Immunoblots were quantitated and represented graphically below each set of blots. ** denotes p ≤ 0.01. Values are mean ± S.E. n = 3. Immunoblot analyses of AKT analyzed concurrently with ULK are shown in supporting Fig. S4.
Figure 5.
Figure 5.
Ultrastructural changes in mitochondria following MTD treatment. A–I, HCT116 cells were treated with Mito-CP (1 μm) or Mito-Met10 (50 μm) for 6 h prior to harvesting and processing by transmission EM. Representative images from vehicle (V)–treated (A–C), Mito-CP–treated (D–F), and Mito-Met10–treated cells (G–I) demonstrate the resulting changes in intracellular morphology upon MTD treatment. N represents the nucleus, white asterisk represents mitochondria with normal morphology, black asterisk represent mitochondria with abnormal morphology, white circles encircle autophagic vesicles, arrowheads visualize enlarged vacuoles, arrows represent mitophagy vesicles. The black box in D is enlarged in E, and the black box in E is enlarged in F. The black box in G is enlarged in H, and the black box in H is enlarged in I. Scale bar in A, D, E, G, and H represents 2 μm and in B, C, F, and I is 500 nm.
Figure 6.
Figure 6.
Mito-CP or Mito-Met10 treatment disrupts mitochondrial membrane potential. Colon cancer cell lines were concomitantly treated with DMSO as a vehicle control (V, black), FCCP (red), Mito-CP (green or blue, 0.5 μm or 1.0 μm, respectively) (HCT116 (A and B); HT-29 (C)), or Mito-Met10 (green, blue, or purple; 10 μm, 100 μm, and 250 μm, respectively) (HCT116 (D and E); HT-29 (F)) for 24 h. Mitochondria were stained with 200 nm TMRE and membrane potential was assessed by flow cytometry. A, C, D, and F, the top panels are representative TMRE staining histograms with a graphical depiction of the mean fluorescent intensity (MFI) presented below. B and E, visualization of mitochondria on a per cell basis was achieved by seeding HCT116 cells into glass-bottom dishes, treatment with drugs as above, stained with 100 nm TMRE and visualized at 60 x/1.6 by spinning disk confocal microscopy. Representative images are maximum projection of Z series acquired at 0.5 μm sections and are shown from the same multi-well experiment such that the vehicle control is the same image in B and E. * denotes p ≤ 0.05, ** denotes p ≤ 0.01. Values are mean ± S.E. n = 4.
Figure 7.
Figure 7.
Pharmacological inhibition of the AMPK signaling pathway provides partial resistance to MTD treatment. A, HCT116 cells were treated (+) with 0.3 μm compound C (Cpd C) or remained untreated (−), for 48 h prior to incubation with DMSO (Vehicle), 50 μm Mito-Met10, or 1 μm Mito-CP. Cell images were acquired in real time on the IncuCyte S3 and percent confluency (% confluency) was used as a readout for proliferation after 3 days of MTD treatment. B, representative images of control and MTD-treated cells are shown. * denotes p ≤ 0.05, ** denotes p ≤ 0.01. Values are mean ± S.E. n = 3.
Figure 8.
Figure 8.
Schematic model a mitophagy mechanism of action of mitochondria-targeted drugs on colorectal cancer cells. Results from the analysis of two representative mitochondria-targeted drugs, Mito-CP and Mito-Met10, indicate selective uptake and localization within the mitochondria inhibits complex I activity, activating an AMPK-dependent signaling cascade which suppresses mTORC1, resulting in activation of the mitophagy regulator ULK1 and concomitant decreasing cell proliferation.

References

    1. American Cancer Society. Cancer Facts & Figures 2017. American Cancer Society, Atlanta, GA
    1. Cox A. D., Fesik S. W., Kimmelman A. C., Luo J., and Der C. J. (2014) Drugging the undruggable RAS: Mission possible? Nat. Rev. Drug Discov. 13, 828–851 10.1038/nrd4389 - DOI - PMC - PubMed
    1. De Roock W., Claes B., Bernasconi D., De Schutter J., Biesmans B., Fountzilas G., Kalogeras K. T., Kotoula V., Papamichael D., Laurent-Puig P., Penault-Llorca F., Rougier P., Vincenzi B., Santini D., Tonini G., et al. (2010) Effects of KRAS, BRAF, NRAS, and PIK3CA mutations on the efficacy of cetuximab plus chemotherapy in chemotherapy-refractory metastatic colorectal cancer: A retrospective consortium analysis. Lancet Oncol. 11, 753–762 10.1016/S1470-2045(10)70130-3 - DOI - PubMed
    1. Misale S., Yaeger R., Hobor S., Scala E., Janakiraman M., Liska D., Valtorta E., Schiavo R., Buscarino M., Siravegna G., Bencardino K., Cercek A., Chen C. T., Veronese S., Zanon C., et al. (2012) Emergence of KRAS mutations and acquired resistance to anti-EGFR therapy in colorectal cancer. Nature 486, 532–536 10.1038/nature11156 - DOI - PMC - PubMed
    1. Weinberg F., Hamanaka R., Wheaton W. W., Weinberg S., Joseph J., Lopez M., Kalyanaraman B., Mutlu G. M., Budinger G. R., and Chandel N. S. (2010) Mitochondrial metabolism and ROS generation are essential for Kras-mediated tumorigenicity. Proc. Natl. Acad. Sci. U.S.A. 107, 8788–8793 10.1073/pnas.1003428107 - DOI - PMC - PubMed

Publication types

MeSH terms

Substances