. 2018 Aug 7;9(1):3130.
doi: 10.1038/s41467-018-05481-1.

Developmental seizures and mortality result from reducing GABAA receptor α2-subunit interaction with collybistin

Affiliations

Developmental seizures and mortality result from reducing GABAA receptor α2-subunit interaction with collybistin

Rochelle M Hines et al. Nat Commun. .

Abstract

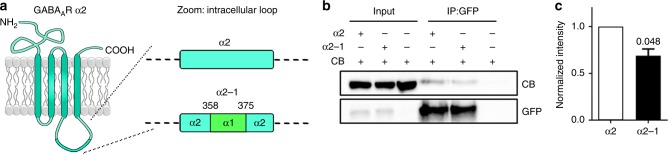
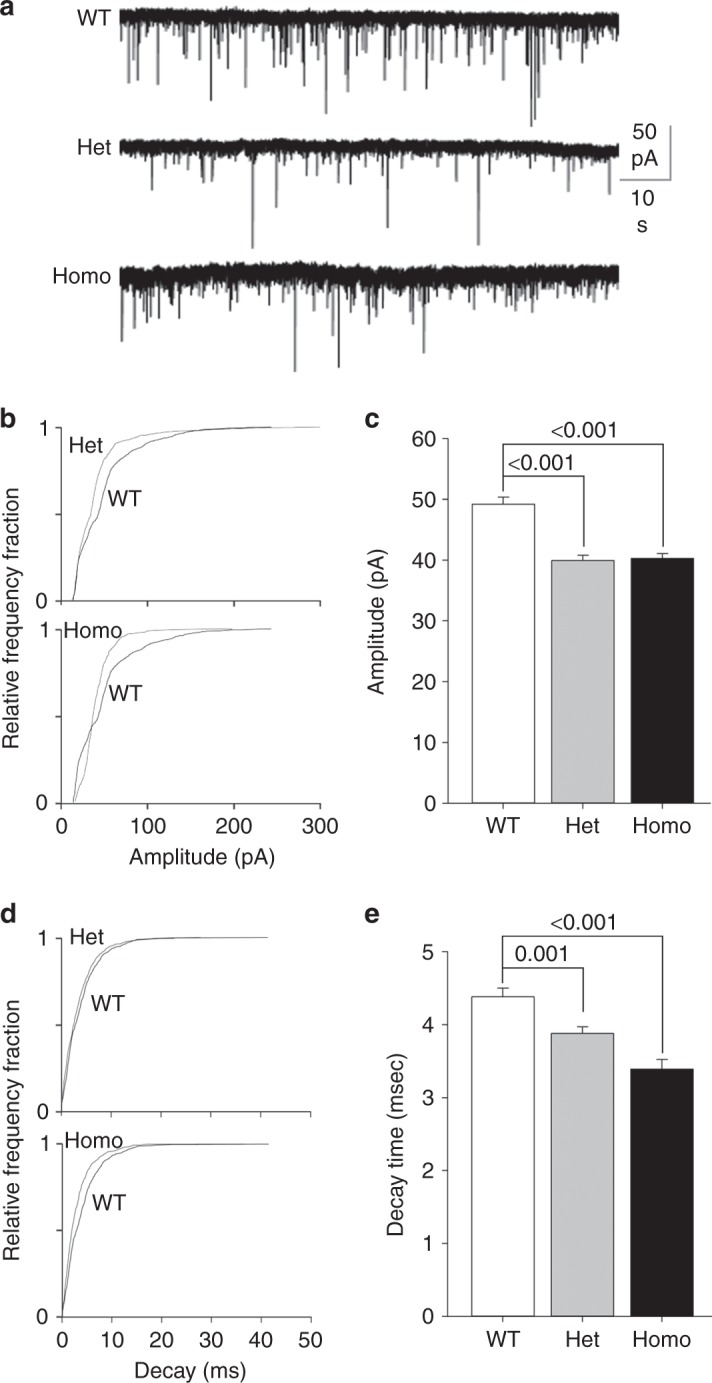
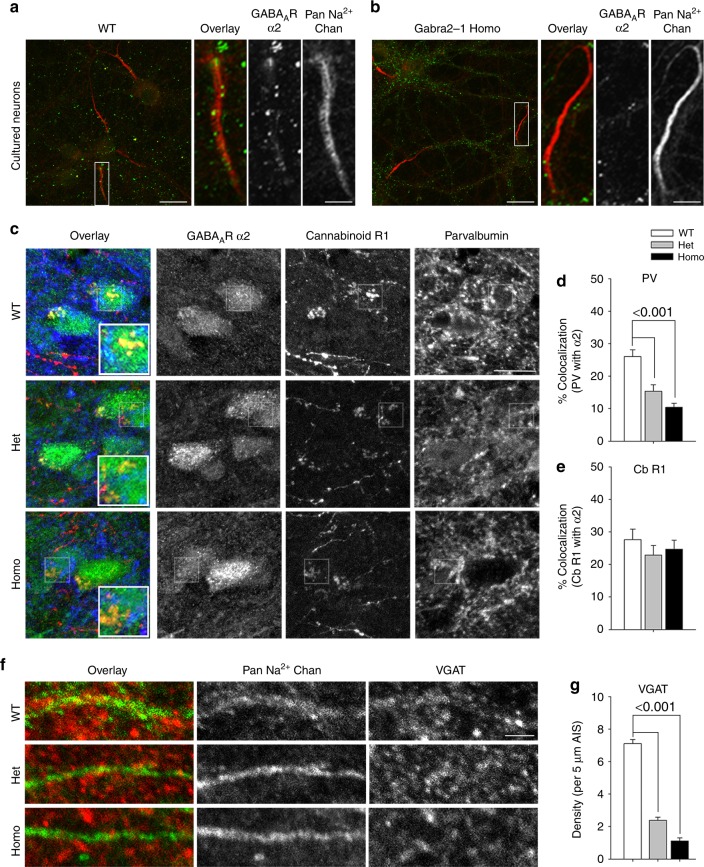
Fast inhibitory synaptic transmission is mediated by γ-aminobutyric acid type A receptors (GABAARs) that are enriched at functionally diverse synapses via mechanisms that remain unclear. Using isothermal titration calorimetry and complementary methods we demonstrate an exclusive low micromolar binding of collybistin to the α2-subunit of GABAARs. To explore the biological relevance of collybistin-α2-subunit selectivity, we generate mice with a mutation in the α2-subunit-collybistin binding region (Gabra2-1). The mutation results in loss of a distinct subset of inhibitory synapses and decreased amplitude of inhibitory synaptic currents. Gabra2-1 mice have a striking phenotype characterized by increased susceptibility to seizures and early mortality. Surviving Gabra2-1 mice show anxiety and elevations in electroencephalogram δ power, which are ameliorated by treatment with the α2/α3-selective positive modulator, AZD7325. Taken together, our results demonstrate an α2-subunit selective binding of collybistin, which plays a key role in patterned brain activity, particularly during development.


Conflict of interest statement

S.J.M. serves as a consultant for SAGE Therapeutics and AstraZeneca, relationships that are regulated by Tufts University. The remaining authors declare no competing interests.

Figures

Fig. 1
Fig. 1
Analyzing the interaction of GABAAR α subunits with collybistin. a Cartoon showing the purified proteins used for biochemical studies of α-subunit interaction with gephyrin and CB. b Receptor subunits were subject to NAGE (pockets mark sites of protein application) followed by coomassie staining, revealing that α-subunit loops slowly migrate to the cathode. CB-SH3 alone or mixed with a threefold excess of GABAAR intracellular domains reveals that α2L markedly alters the migration of SH3 (red arrow). c SEC analysis was used to explore the behavior of CB-SH3 alone or when mixed with equimolar amounts of α1L, α2L, or α3L. Fusion proteins were detected in eluates using absorbance at 280 nM and coomassie staining after SDS-PAGE (insets), verifying the presence of the SH3 domain at lower elution volumes in the fraction containing α2L. d CB-SH3 was titrated against α1L and α2L. The measured binding enthalpies are plotted as a function of the molar ratio of the SH3 domain to the GABAAR α1 and α2 loops. e GephE and GephE + CB-SH3 were subject to NAGE. The migration of the respective proteins is indicated. In presence of the SH3 domain the migration of gephyrin is not altered indicating that the proteins do not interact on NAGE (left panel). GephE in the presence of a fivefold molar excess of α2L is partly retained in the pocket and partly migrates towards the anode (lane 1 right panel). Addition of increasing amounts of the SH3 domain to the GephE-α2L complex allows more gephyrin to enter the gel and migrate towards the anode. At the same time SH3 binding to α2L retains SH3 in the pocket. This indicates that SH3 and gephyrin compete for α2 binding. f CB-SH3 was titrated against α2L alone or in combination with GephE, and the measured binding enthalpies are plotted
Fig. 2
Fig. 2
Substitution of 13 amino acids from the GABAAR-α1 subunit loop into α2 reduces collybistin binding. a Cartoon of the GABAAR α2 subunit, showing the N- and C-termini and the large intracellular loop, expanded to show the site of the α2–1 mutation at amino acids 358–375. b Purified GFP-tagged α2 or α2–1 was combined with purified CB and subjected to coimmunoprecipitation. c Quantification of normalized intensities comparing GFP-tagged α2 or α2–1 (0.6895 ± 0.08221) interacting with CB. All plots shown and all values listed are mean ± standard error, t test
Fig. 3
Fig. 3
Generation and basic characterization of α2–1 knock-in (Gabra2–1) mice. a Cartoon showing the targeting vector used to insert residues 358–375 from the α1 subunit into exon 10 of the α2 subunit, and the resulting allele. b Sequencing of PCR amplified genomic DNA from wildtype and Gabra2–1 homozygous mice, and predicted amino acid sequence. c Hippocampal extracts from wildtype and Gabra2-1 heterozygous and homozygous mice were immunoblotted with antibodies directed at the large intracellular loop (loop) and the c-terminus (c-term) of the GABAAR α2 subunit. d Immunoblotting with antibodies for gephyrin (Geph) and collybistin (CB) in wildtype and Gabra2-1 mice. See Supplementary Fig. 2 for uncropped blots and quantification of immunoblotting. e The 40 μm saggital sections immunostained with α2 c-term antibody and HRP-conjugated secondary antibody, and visualized using 3, 3′-diaminobenzidine staining. Scale bar = 1500 µm. See Supplementary Fig. 3 for quantification of α2 immunohistochemistry
Fig. 4
Fig. 4
Expression of GABAAR α1 and α2 subunits, and related inhibitory synaptic proteins in Gabra2–1 mice. a Representative images of GABAAR α2-subunit staining in the CA1 region of the hippocampus. Quantification of the size: (b WT—0.365 ± 0.004; Het—0.279 ± 0.003; Homo—0.271 ± 0.003), and density (c WT—192.80 ± 7.851; Het—202.70 ± 17.490; Homo—347.20 ± 5.276) of α2 positive clusters in CA1. d Quantification of GABAAR α1 subunit cluster density (WT—145.00 ± 17.50; Het—184.10 ± 6.31; Homo—165.00 ± 28.33) in CA1. e Cluster size/intensity correlation plots for α2 and α1 staining, showing the shift toward smaller, less intense clusters of α2 in Gabra2–1 homozygous mice. f Representative images of CB immunostaining in CA1. g Representative images of VGAT immunostaining in CA1. Quantification of the size (h WT—0.344 ± 0.024; Het—0.232 ± 0.035; Homo—0.188 ± 0.020) and density i WT—3056.06 ± 338.30; Het—1913.26 ± 275.02; Homo—1087.94 ± 165.43) of CB positive clusters in CA1. j Quantification of VGAT positive cluster density (WT—3447.82 ± 250.00; Het—3165.59 ± 390.82; Homo—3346.53 ± 289.30) in CA1. Scale bar = 10 µm, applies to all images. All plots shown and all values listed are mean ± standard error, p values from KS test (cluster size), or ANOVA (cluster density)
Fig. 5
Fig. 5
Gabra2–1 mice display alterations in hippocampal phasic current. a Representative recordings made from CA1 in hippocampal slices from p21 Gabra2–1 heterozygous and homozygous mice compared to wildtype littermate control mice. Gabra2–1 recordings displayed smaller sIPSC amplitudes and decreased decay times compared to wildtype littermate or age-matched controls as seen in the representative traces. Analysis of traces revealed a shift in the cumulative probability plots and bar graphs for sIPSC amplitude (b, c WT—49.2 ± 1.16; Het—39.9 ± 0.91; Homo—40.3 ± 0.74) and decay (d, e. WT—4.38 ± 0.12; Het—3.88 ± 0.09; Homo—3.39 ± 0.13). The frequency was comparable between the genotypes, for quantification see Supplementary Fig. 7. All plots shown and all values listed are mean ± standard error, p values from t test
Fig. 6
Fig. 6
Examination of the subcellular localization of GABAAR α2-subunit clusters in Gabra2-1 mice. Cultured cortical neurons from wildtype (a) and Gabra2-1 homozygous (b) pups stained with antibodies directed against GABAAR α2 (green) and sodium channels (red), showing zooms of representative AIS segments. c Colocalization of GABAAR α2 (green) with CB1R (red) and parvalbumin (blue) clusters in the CA1 of wildtype, heterozygous and homozygous Gabra2–1 mice. Quantification of the colocalization of GABAAR α2 with parvalbumin (d WT—26.05 ± 2.12; Het—15.34 ± 2.06; Homo—10.41 ± 1.24) and CB1R (e WT—27.64 ± 3.30; Het—22.90 ± 2.99; Homo—24.73 ± 2.74). f Staining for VGAT (red) positive clusters to mark inhibitory presynaptic compartments, along with a Pan-sodium channel antibody (green) to label the axon initial segment. g Quantification of the number of VGAT positive clusters per 5 µm of AIS (WT—7.11 ± 0.26; Het—2.39 ± 0.19; Homo—1.11 ± 0.18). Scale bar = 10 µm (A low mag, C), scale bar = 5 µm (A zoom, F). All plots shown and all values listed are mean ± standard error, p values from ANOVA
Fig. 7
Fig. 7
Early postnatal mortality and spontaneous seizures in Gabra2–1 heterozygous and homozygous mice. a Plot showing the proportion of mice found dead (out of the total found dead) across a 120 day lifespan. b Cumulative proportion of heterozygous and homozygous mice found dead in the early postnatal period, corrected for predicted Mendelian ratio of 2:1 het:homo. c Survival plot of litters from a typical heterozygous × homozygous mating pair. Quantification of the percentage of litters from different mating schemes that had one or more dead pups (d WT × WT—3.20 ± 3.20; WT × Het—69.05 ± 8.29; Het × Het 77.38 ± 4.49; Het × Homo 90.91 ± 9.09; Homo × Homo—100.00 ± 0.00) and the percentage of pups that were weaned (e WT × WT—97.78 ± 2.22; WT × Het—60.63 ± 4.98; Het × Het 63.57 ± 4.42; Het × Homo 46.41 ± 14.13; Homo × Homo—36.50 ± 2.21) according to mating scheme. f. Quantification of spontaneous seizure severity according to the Racine scale in pups observed seizing. g. Quantification of kainate seizure severity according to the Racine scale in WT (LS Mean 0.74), heterozygous (LS Mean 3.40), and homozygous (LS Mean 4.19) littermates (SE of LS Mean = 0.401; Het vs Homo p = 0.197). h Representative traces of EEG activity in wildtype, and Gabra2-1 heterozygous and homozygous mice following kainate injection. Quantification of the latency to SE (i WT—58.16 ± 3.31; Het—33.39 ± 5.52; Homo—31.09 ± 4.43; Het vs. Homo p = 0.732), latency to first seizure event (j WT—9.44 ± 0.973; Het—9.95 ± 2.523; Homo—12.39 ± 2.836), and the average event duration (k WT—143.08 ± 13.05; Het—390.71 ± 88.21; Homo—501.92 ± 57.63; Het vs. Homo p = 0.214) in wildtype, heterozygous, and homozygous Gabra2–1 mice treated with kainate. All plots shown and all values listed are mean ± standard error, p values from ANOVA, or repeated measures ANOVA (Kainate Racine over time)
Fig. 8
Fig. 8
Anxiety and EEG in Gabra2–1 mice are corrected by treatment with an α2-selective compound. a Quantification of the percent time spent in the light chamber of the light-dark box, comparing wildtype (104.52 ± 11.11), heterozygous (71.77 ± 6.89) and homozygous (73.50 ± 10.34) Gabra2-1 mice. b Time spent in the arms expressed as percent of total in the elevated plus maze comparing wildtype (open—25.22 ± 4.87; closed—74.78 ± 4.87), heterozygous (open—10.95 ± 1.90; closed—89.05 ± 1.89) and homozygous (open—8.23 ± 2.95; closed—91.78 ± 2.95) Gabra2–1 mice. c Assessment of the percent time spent in the open arms of the elevated plus maze comparing wildtype (LS Mean 31.58) and Gabra2–1 heterozygous (LS mean 20.10; SE of LS mean for genotype—1.51) mice treated with vehicle (beta cyclodextran; LS mean 15.29), 2 mg kg−1 diazepam (LS mean 22.67), or 3 mg kg−1 AZD7325 (LS mean 39.55; SE of LS Mean for treatment—1.85). d Analysis of percent closed arm time in Gabra2–1 heterozygous mice. e Spectrograms of representative EEG recordings from Gabra2–1 heterozygotes and wildtype controls during baseline and after treatment with AZD7325. f FFT of EEG recordings comparing wildtype (LS mean 82.02 ± 8.23) and Gabra2–1 heterozygous (112.60 ± 7.13) mice. g Comparison of average δ power between wildtype and Gabra2–1 mice, and after treatment with AZD7325. All plots shown and all values listed are mean ± standard error, p values from ANOVA, or repeated measures ANOVA (EEG FFT)

References

    1. Rudolph U, Möhler H. GABA-based therapeutic approaches: GABAA receptor subtype functions. Curr. Opin. Pharmacol. 2006;6:18–23. doi: 10.1016/j.coph.2005.10.003. - DOI - PubMed
    1. Klausberger T, Roberts JDB, Somogyi P. Cell type- and input-specific differences in the number and subtypes of synaptic GABA(A) receptors in the hippocampus. J. Neurosci. Off. J. Soc. Neurosci. 2002;22:2513–2521. doi: 10.1523/JNEUROSCI.22-07-02513.2002. - DOI - PMC - PubMed
    1. Nusser Z, Sieghart W, Benke D, Fritschy JM, Somogyi P. Differential synaptic localization of two major gamma-aminobutyric acid type A receptor alpha subunits on hippocampal pyramidal cells. Proc. Natl Acad. Sci. USA. 1996;93:11939–11944. doi: 10.1073/pnas.93.21.11939. - DOI - PMC - PubMed
    1. Nyíri G, Freund TF, Somogyi P. Input-dependent synaptic targeting of alpha(2)-subunit-containing GABA(A) receptors in synapses of hippocampal pyramidal cells of the rat. Eur. J. Neurosci. 2001;13:428–442. doi: 10.1046/j.1460-9568.2001.01407.x. - DOI - PubMed
    1. Fritschy JM, Johnson DK, Mohler H, Rudolph U. Independent assembly and subcellular targeting of GABA(A)-receptor subtypes demonstrated in mouse hippocampal and olfactory neurons in vivo. Neurosci. Lett. 1998;249:99–102. doi: 10.1016/S0304-3940(98)00397-8. - DOI - PubMed

Publication types

MeSH terms

Substances