. 2018 Aug 7;9(1):3121.
doi: 10.1038/s41467-018-05379-y.

Evaluation of chromatin accessibility in prefrontal cortex of individuals with schizophrenia

Affiliations

Evaluation of chromatin accessibility in prefrontal cortex of individuals with schizophrenia

Julien Bryois et al. Nat Commun. .

Abstract

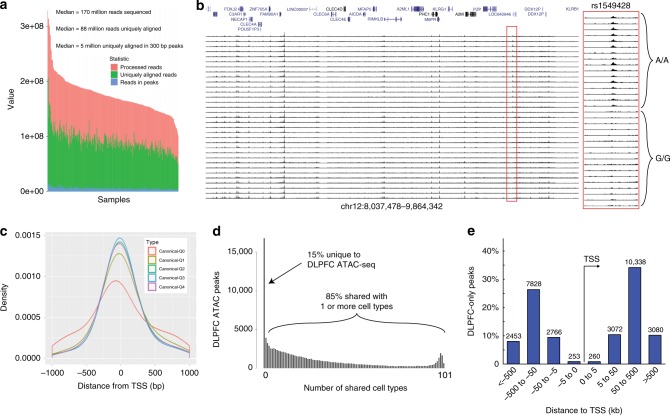
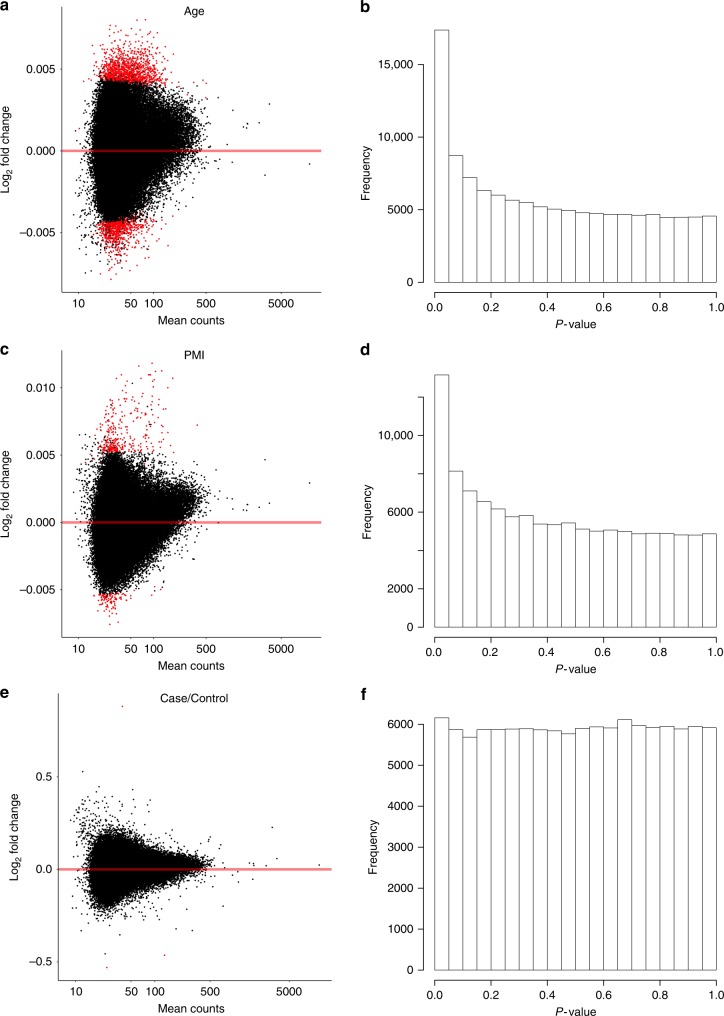
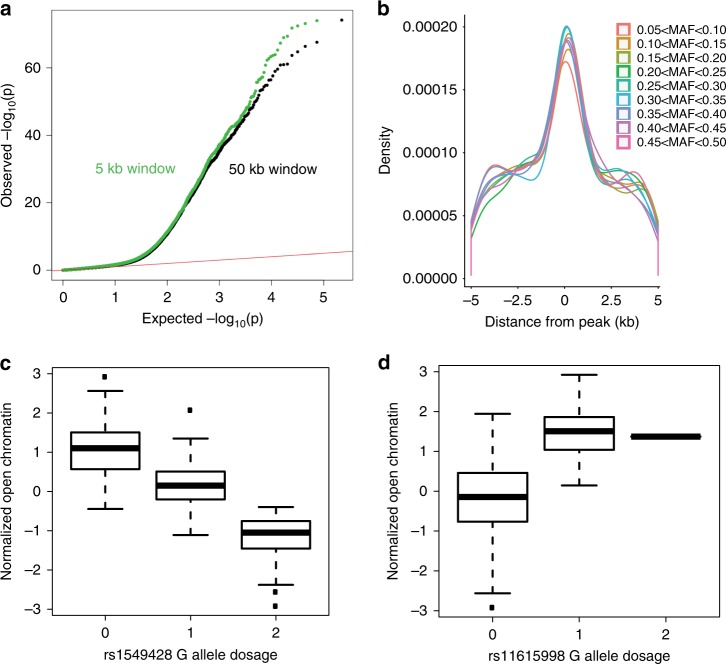
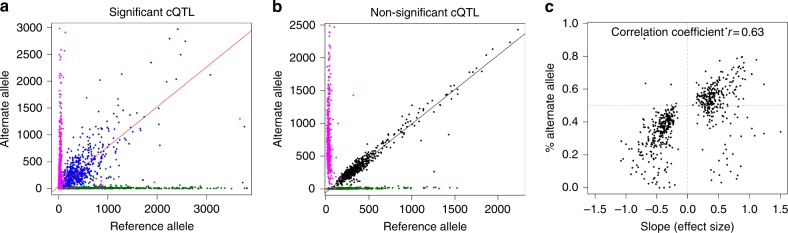
Schizophrenia genome-wide association studies have identified >150 regions of the genome associated with disease risk, yet there is little evidence that coding mutations contribute to this disorder. To explore the mechanism of non-coding regulatory elements in schizophrenia, we performed ATAC-seq on adult prefrontal cortex brain samples from 135 individuals with schizophrenia and 137 controls, and identified 118,152 ATAC-seq peaks. These accessible chromatin regions in the brain are highly enriched for schizophrenia SNP heritability. Accessible chromatin regions that overlap evolutionarily conserved regions exhibit an even higher heritability enrichment, indicating that sequence conservation can further refine functional risk variants. We identify few differences in chromatin accessibility between cases and controls, in contrast to thousands of age-related differential accessible chromatin regions. Altogether, we characterize chromatin accessibility in the human prefrontal cortex, the effect of schizophrenia and age on chromatin accessibility, and provide evidence that our dataset will allow for fine mapping of risk variants.


Conflict of interest statement

P.F.S. is a scientific advisor for Pfizer, Inc. G.E.C. and T.E.R. are co-founders of Element Genomics, Inc. The remaining authors declare no competing interests.

Figures

Fig. 1
Fig. 1
ATAC-seq on frozen DLPFC samples. a Sequencing statistics from all libraries (N = 288) show largely similar total number of reads (pink), uniquely aligning reads (green), and reads that map to ATAC-seq peaks (blue). b Individual brain ATAC-seq data in a representative genomic region showing largely congruent identification of regions of open chromatin. Some samples have lower signal to noise (correlated with covariates like postmortem interval and RNA integrity number). Region in red is a chromatin QTL, note lower signal for individuals with GG genotype vs. AA genotype. c Open chromatin in relation to transcription start sites (TSS). The TSS is at zero, right is inward in the direction of transcription, and left is outward from the gene. Density curves for all known GENCODE v25 transcripts (one principal transcript per protein-coding gene). Colored curves show different expression levels in DLPFC: Q0 = no expression, Q1–Q4 = lowest to highest expression quartiles. d Number of DLPFC ATAC-seq peaks that overlap with putative regulatory elements identified from 101 different cell types analyzed by the Epigenome Roadmap Project (brain tissues excluded). Approximately 16% (n = ~17,000) ATAC-seq peaks are unique to DLPFC. e Location of DLPFC-only ATAC-seq peaks relative to the TSS indicates that the majority are in non-promoter regions
Fig. 2
Fig. 2
Schizophrenia heritability is enriched for brain-specific accessible chromatin. a Schizophrenia heritability enrichment (standard error) and significance level (–log 10(P)) of different functional genomic annotations estimated using partitioned LD score regression. Enrichment of ATAC-seq regions in DLPFC is second only to genomic regions conserved across 29 Eutherian mammals. The black bar represents the 5% false discovery rate threshold. b Enrichment across a subset of 142 DNase-seq and ATAC-seq datasets (see Supplementary Fig. 9 for complete comparison). The black bar represents the Bonferroni significance threshold (=0.01/142). Top enrichments are in DLPFC ATAC-seq peaks generated from Duke and U Chicago groups, followed by other mostly brain-specific tissues and cell lines. ATAC-seq tissue samples (cerebellum, liver, muscle, heart, kidney, and lung) represent an independent study to control for batch and method effects. c Schizophrenia heritability enrichment and standard error for peaks of different width. d Heritability enrichment of ATAC-seq peaks from brain display significant enrichment (*P < 0.05) for GWA variants associated with schizophrenia, but not for educational attainment (Edu), cognitive ability (Cog), height, and total cholesterol (TC). e Heritability enrichment of evolutionarily conserved regions are significantly enriched for schizophrenia, educational attainment, cognitive ability and height, and TC. f Heritability is ~4× more enriched for regions that overlap between ATAC-seq and conservation than for regions that are either conserved or in ATAC-seq peaks
Fig. 3
Fig. 3
Differential chromatin accessibility differences detected in 288 brain samples. a Differential chromatin detected as a function of age at death. Dots in red indicate significantly differential regulatory elements (FDR <0.05). b Distribution of P values for age. c Differential chromatin detected as a function of postmortem interval (PMI). d Distribution of P values for PMI. e Differential chromatin detected as a function of case–control status. f Distribution of P values for case–control status. Peaks on chrX were meta-analyzed (inverse variance weighted) and peaks on chrY were only tested in males
Fig. 4
Fig. 4
Identification of chromatin QTLs (cQTLs). a QQ plot of cQTLs using window size of 5 kb (green) or 50 kb (black). Both show marked deviations from the expected. b Distance of cQTLs relative to the center of ATAC-seq peaks as a function of minor allele frequency. c Most significant cQTL, rs1549428 (chr12:9,436,157−9,436,457); individuals homozygous for the reference allele (0) display more chromatin accessibility than individuals that are heterozygous (1) and homozygous for the alternate allele (2). d Most significant cQTL that is also a schizophrenia GWA loci, rs11615998 (chr12:2,364,960−2,365,260). Due to a low minor allele frequency (MAF = 0.059), only one individual was homozygous for the alternate allele. The results were comparable with or without this homozygous individual. The boxplots represent the following statistics: median (bolded line), the 1st and 3rd quartiles (bounds of box) and 1.5× the inter-quartile range (whiskers)
Fig. 5
Fig. 5
Heterozygous individuals for cQTLs display allele bias. a Allele counts across cQTLs for individuals homozygous for reference alleles (green), homozygous for alternative alleles (magenta), or heterozygous for cQTL variants (blue). b Same as a, but for non-significant cQTLs. c For individuals heterozygous for cQTLs, we determined the % of each cQTL that correlated to the alternate allele (y-axis) and compared those values to the cQTL effect size (x-axis)
Fig. 6
Fig. 6
SNPs that are both eQTLs and cQTLs. a Direction of effects of cQTL vs. eQTL. Concordant effects are when cQTL allele associated with greater open chromatin is also associated with higher eQTL expression. b Even though the direction of cQTL and eQTL is largely concordant, the effect sizes of these differences are only modestly correlated (r = 0.21). c Three SNPs in high LD on chromosome 1. The tested allele is associated with lower expression and more open chromatin for all three SNPs. Distance between SNPs 1 and 2 is 10 kb, and distance between SNPs 2 and 3 is 6.3 kb. d Three SNPs in high LD on chromosome 2. The tested allele is associated with lower expression in all three instances, but with more open chromatin for two SNPs and more closed chromatin for the third SNP. Distance between SNPs 1 and 2 is 2 kb and distance between SNPs 2 and 3 is 20 kb

References

    1. Sullivan PF, et al. Psychiatric genomics: an update and an agenda. Am. J. Psychiatry. 2018;175:15–27. doi: 10.1176/appi.ajp.2017.17030283. - DOI - PMC - PubMed
    1. Lichtenstein P, et al. Recurrence risks for schizophrenia in a Swedish national cohort. Psychol. Med. 2006;36:1417–1426. doi: 10.1017/S0033291706008385. - DOI - PubMed
    1. Sullivan PF, Kendler KS, Neale MC. Schizophrenia as a complex trait: evidence from a meta-analysis of twin studies. Arch. Gen. Psychiatry. 2003;60:1187–1192. doi: 10.1001/archpsyc.60.12.1187. - DOI - PubMed
    1. Fromer M, et al. De novo mutations in schizophrenia implicate synaptic networks. Nature. 2014;506:179–184. doi: 10.1038/nature12929. - DOI - PMC - PubMed
    1. Schizophrenia Working Group of the Psychiatric Genomics Consortium. Biological insights from 108 schizophrenia-associated genetic loci. Nature511, 421–427 (2014). - PMC - PubMed

Publication types