. 2018 Aug 7;9(1):3140.
doi: 10.1038/s41467-018-05604-8.

Precardiac organoids form two heart fields via Bmp/Wnt signaling

Affiliations

Precardiac organoids form two heart fields via Bmp/Wnt signaling

Peter Andersen et al. Nat Commun. .

Abstract

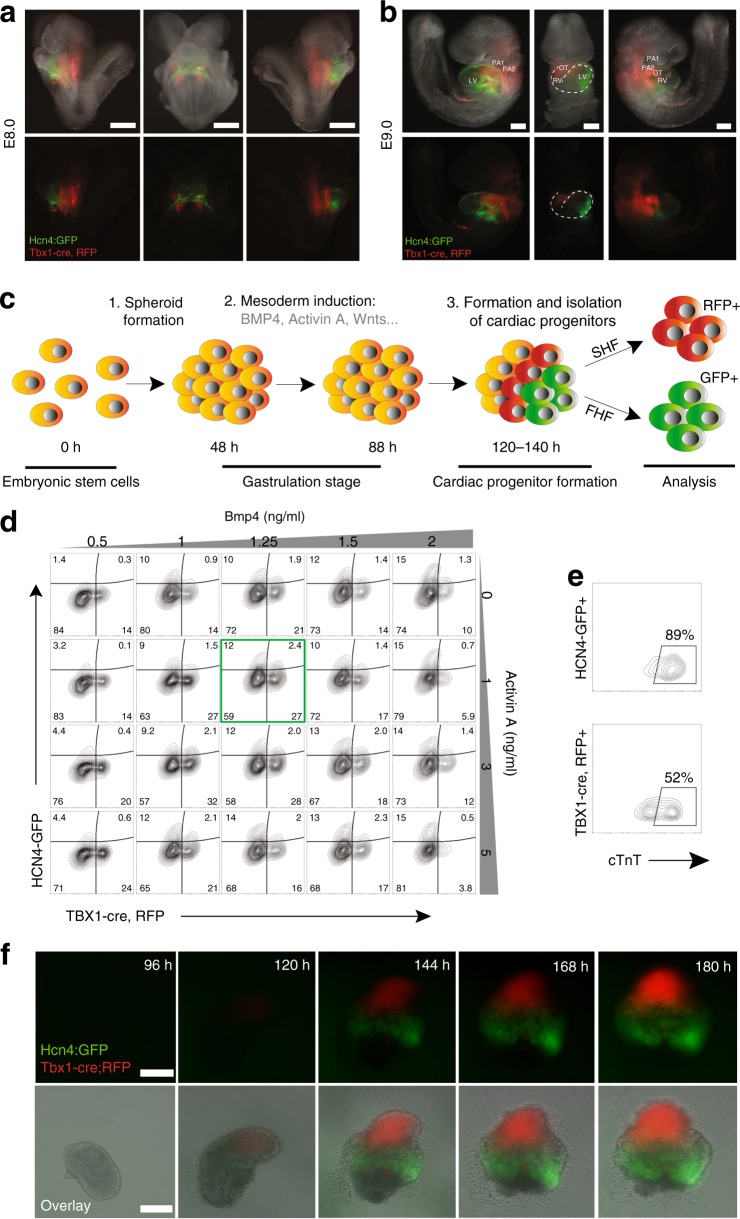
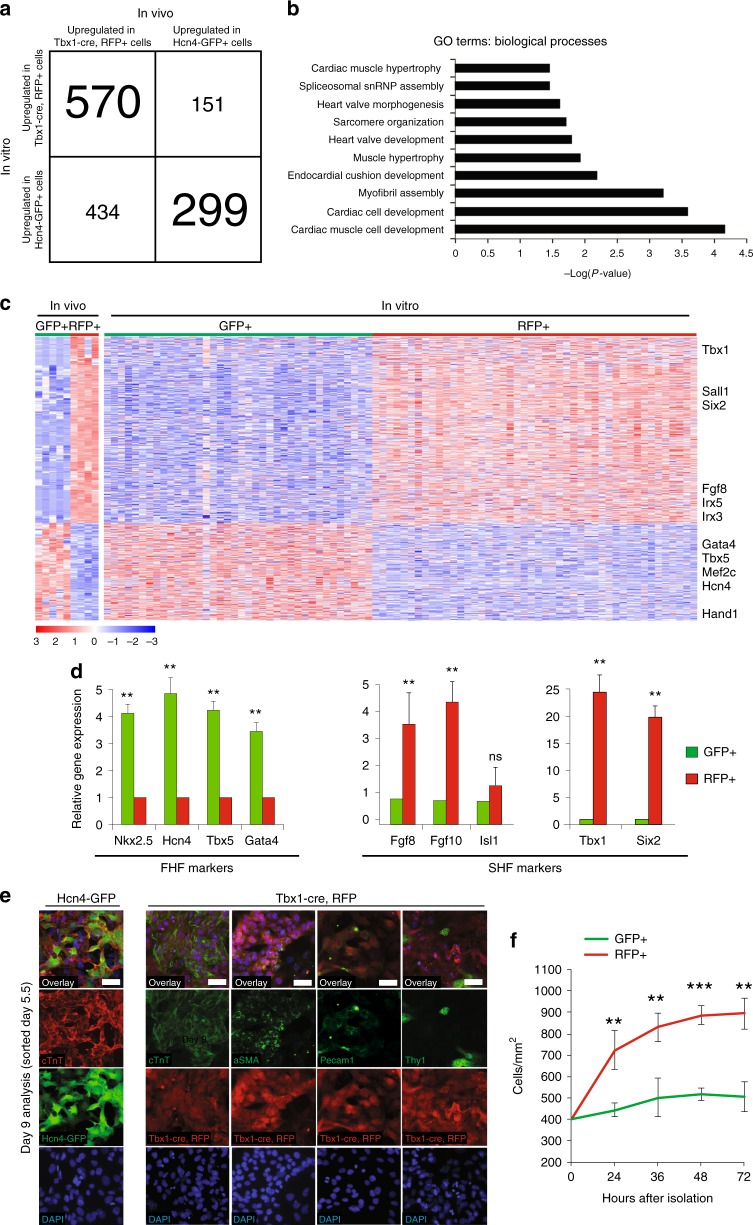
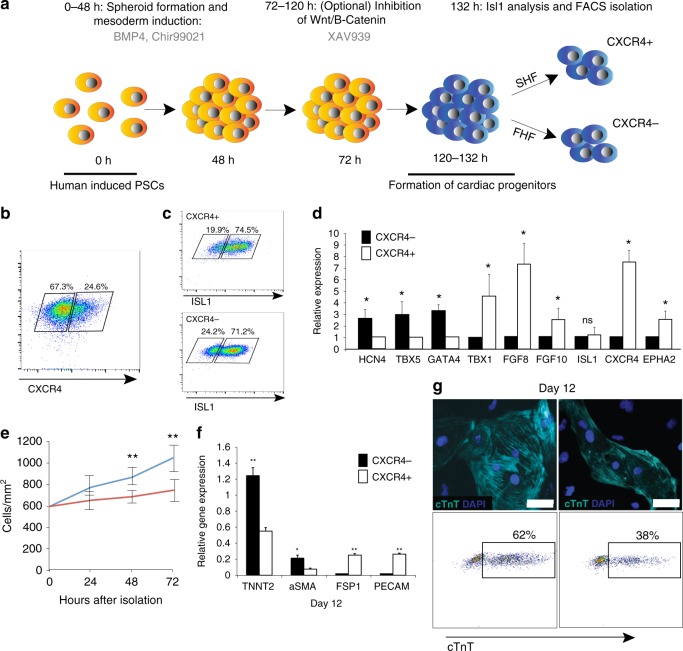
The discovery of the first heart field (FHF) and the second heart field (SHF) led us to understand how cardiac lineages and structures arise during development. However, it remains unknown how they are specified. Here, we generate precardiac spheroids with pluripotent stem cells (PSCs) harboring GFP/RFP reporters under the control of FHF/SHF markers, respectively. GFP+ cells and RFP+ cells appear from two distinct areas and develop in a complementary fashion. Transcriptome analysis shows a high degree of similarities with embryonic FHF/SHF cells. Bmp and Wnt are among the most differentially regulated pathways, and gain- and loss-of-function studies reveal that Bmp specifies GFP+ cells and RFP+ cells via the Bmp/Smad pathway and Wnt signaling, respectively. FHF/SHF cells can be isolated without reporters by the surface protein Cxcr4. This study provides novel insights into understanding the specification of two cardiac origins, which can be leveraged for PSC-based modeling of heart field/chamber-specific disease.


Conflict of interest statement

The authors declare no competing interests.

Figures

Fig. 1
Fig. 1
FHF/SHF-like cells are induced in spheroid PSC culture. a Live imaging of Hcn4-GFP, Tbx1-Cre, Ai9 mice E8.0. GFP is exclusively expressed in the cardiac crescent and primitive myotube, whereas RFP is expressed in the posterior region. b Live imaging of Hcn4-GFP, Tbx1-Cre, Ai9 mice E9.0. GFP expression is restricted to the LV and atria whereas RFP is expressed in the pharyngeal region posterior to the heart, the outflow tract and RV. c Schematic of the strategy used to generate and differentiate ESC-derived cardiac spheroids. d Flow cytometric analyses of Hcn4-GFP+ and Tbx1-Cre, RFP+ in cardiac spheroids after 5.5 days of differentiation. e Flow cytometric analyses of GFP+/cTnT+ and RFP+/cTnT+ cells at day 9 in cardiac spheroids. f Representative images from live imaging time-lapse experiments of a differentiating cardiac spheroid. White scale bars indicate 100 μm
Fig. 2
Fig. 2
PSC-derived FHF/SHF cells are similar to FHF/SHF cells in embryos. a RNA-seq analysis of differentially regulated genes between Hcn4-GFP+ and Tbx1-Cre, RFP+ CPCs in vivo and in vitro. The DESeq2 package identified 1454 genes that were differentially regulated between Hcn4-GFP+ and Tbx1-cre, RFP+ CPCs in vivo and in vitro (Benjamini–Hochberg adjusted p-value < 0.1). Upregulation in the GFP+ or RFP+ CPCs was determined using the directionality of fold change from DESeq2. 869 genes showed upregulation in the same CPC population both in vivo and in vitro. b Gene Ontology (GO) term analysis of 869 genes identified in a. Top ten biological processes enriched in the gene list (Bonferroni adjusted p-values < 0.05) are shown. c RNA-seq heatmaps of CPCs both in vivo and in vitro using the 869 genes identified in a. Heatmaps show row-scaled regularized logarithmic transformation of counts as produced by the DESeq2 package. Hcn4-GFP+ and Tbx1-Cre, RFP+ CPCs cluster separately based on expression patterns of these genes both in vivo and in vitro. Select known FHF and SHF markers are labeled. d qPCR analyses of selected genes involved in early CPC development of PSC-derived Hcn4-GFP CPCs and Tbx1-Cre, RFP isolated day 5.5. Data are mean ± SEM; **p < 0.01; ns, not significant (p > 0.05). p values were determined using a paired Student’s t test. e Immunohistochemistry analyses of cTnT, Pecam-1, Tny1, and aSMA at PSC-derived Hcn4-GFP CPCs and Tbx1-Cre, RFP CPCs isolated day 5.5 and analyzed day 9. White scale bars indicate 50 μm. f Cell counts of Hcn4-GFP+ CPCs and Tbx1-Cre, RFP+ CPCs isolated day 5.5. All data are mean ± SEM; n = 3; **p < 0.01; ***p < 0.001. p values were determined using a paired Student’s t test
Fig. 3
Fig. 3
Bmp and Wnt activities regulate heart field specification in cardiac spheroids. a Ingenuity pathway analysis of genes differentially expressed in Hcn4-GFP+ and Tbx1-Cre, RFP+ CPCs in vivo. We focused our analysis on pathways involved with “organism growth and development”. Data are shown as logarithm of Benjamini–Hochberg adjusted p-value, with threshold for significance of p-value < 0.1. b RNA-seq heatmaps of selected differentially regulated genes (Benjamini–Hochberg adjusted p-value < 0.1) from Bmp signaling pathway and Wnt/β-catenin pathways. Data are shown as row-scaled regularized logarithmic transformation of counts as produced by the DESeq2 package. c Vertical scatter plot showing the effect of increasing Bmp4 on formation of Hcn4-GFP+ CPCs (green trend line). d Vertical scatter plot showing the effect of increasing Bmp4 on formation of Tbx1, RFP + CPCs (red trend line). Both analyses (c, d) were performed on GFP+/RFP+ percentages from flow cytometric analyses in Fig. 1d. e Number of Hcn4-GFP+ CPCs and Tbx1-Cre, RFP + CPCs after induction with increasing concentrations of Wnt3A. f Number of Hcn4-GFP+ CPCs and Tbx1-cre, RFP + CPCs after induction with Bmp4 (1.25 ng/mL) in combination with Wnt3A. g qPCR analyses of Tbx5, Hcn4, Tbx1, and Fgf10 after induction with Bmp4 (1.25 ng/mL) alone or in combination with Wnt3a (100 ng/mL), Wnt5A (100 ng/mL), Wnt11 (100 ng/mL), and IWP-2 (0.5 μM). h Representative FACS plots of Hcn4-GFP+ and Tbx1-cre, RFP+ CPCs at day 5.5. i qPCR analyses of Tbx5, Hcn4, Tbx1, and Fgf10 after induction with Bmp4 (1.25 ng/mL) alone or in combination with Noggin (100 ng/mL) or dorsomorphin (100 nM), K2288 (100 nM), and DMH1 (100 nM). j Topflash assay after induction (88 h of differentiation) with Bmp4 (1.25 ng/mL) or Wnt3A (100 ng/mL) alone or in combination with Wnt3a, IWP-2, Noggin or Dorsomorphin. All data are mean ± SEM; n = 3; *p < 0.05; **p < 0.01. p values were determined using a paired Student’s t test
Fig. 4
Fig. 4
Cxcr4 marks SHF progenitors in mouse PSC-derived spheroids and in embryos. a RNA-seq analysis of differentially expressed surface receptors between Hcn4-GFP+ and Tbx1-cre, RFP+ CPCs in vitro. We identified 240 differentially expressed surface receptors of which the top 55 are shown here (all with Benjamini–Hochberg adjusted p-value < 0.05). b qPCR analysis of Cxcr4 expression in Hcn4-GFP + and Tbx1-cre, RFP + CPCs. Data are mean ± SEM; n = 3; *p < 0.05; p values were determined using a paired Student’s t test. c Representative flow histograms of Cxcr4 staining of Hcn4-GFP+ and Tbx1-cre, RFP+ CPCs compared to unstained GFP+/RFP+ CPCs. d Representative flow cytometric analysis and sorting strategy of Isl1-cre, RFP+ CPCs (left) and Cxcr4−/+ CPCs (right). e Clonal cell-fate assay showing qPCR results from 2 × 24 single-cell Cxcr4 and Cxcr4+ clones, sorted and plated at day 5.5 and analyzed 7 days later. Solid colors represent expression of the gene of interest (Ct value < 30). Green: cTnT, Red: SM22, Blue: Pecam1, Yellow: FSP1/S100A4. f Cxcr4/+CPCs isolated day 5.5, treated with EdU 24 h after isolation and stained for EdU and DAPI. Scale bars represent 50 μm, bar graph shows quantification of EdU + CPCs, Data are mean ± SEM; n = 4; *p < 0.05; p values were determined using a paired Student’s t test. g Microarray analysis showing expression of cardiac genes in Isl1-cre, RFP+ vs. Isl1-cre, RFP- CPCs isolated day 5.5
Fig. 5
Fig. 5
CXCR4 identifies SHF progenitors in human iPSC-derived spheroids. a Schematic of the strategy used to generate and differentiate hiPSC-derived cardiac spheroids. b Representative flow cytometric analyses showing the number of CXCR4 and Cxcr4+ cells at day 5.5. c Representative flow cytometric analysis showing the number of human Isl1+ cells in the sorted populations of CXCR4+ and CXCR4 CPCs. d qPCR analyses of CXCR4 and CXCR4+ cells isolated at day 5.5. Data are mean ± SEM; *p < 0.05; **p < 0.01; ns not significant (p > 0.05). p values were determined using a paired Student’s t test. e Cell counts of CXCR4 and CXCR4+ cells isolated day 5.5. Data are mean ± SEM; **p < 0.01. p values were determined using a paired Student’s t test. f qPCR analysis of Tnnt2, aSMA (smooth muscle cell marker), Fsp1 (fibroblast marker), and PECAM (endothelial cell marker) in cells derived from Cxcr4 and CXCR4+ CPCs isolated at day 5.5, re-plated as monolayers and isolated at day 12. Data are mean ± SEM; n = 3 *p < 0.05; **p < 0.01; ns not significant (p > 0.05). p values were determined using a paired Student’s t test. g Representative images of human cardiomyocytes from CXCR4 and CXCR4+ derived cardiomyocytes at day 12 (Above) and representative flow cytometric analyses of cTnT+ cardiomyocytes at day 12 (Below). White scale bars indicate 25 μm

References

    1. Arkell RM, Fossat N, Tam PP. Wnt signalling in mouse gastrulation and anterior development: new players in the pathway and signal output. Curr. Opin. Genet. Dev. 2013;23:454–460. doi: 10.1016/j.gde.2013.03.001. - DOI - PubMed
    1. Cornell RA, Kimelman D. Activin-mediated mesoderm induction requires FGF. Development. 1994;120:453–462. - PubMed
    1. Weinstein DC, Marden J, Carnevali F, Hemmati-Brivanlou A. FGF-mediated mesoderm induction involves the Src-family kinase Laloo. Nature. 1998;394:904–908. doi: 10.1038/29808. - DOI - PubMed
    1. Winnier G, Blessing M, Labosky PA, Hogan BL. Bone morphogenetic protein-4 is required for mesoderm formation and patterning in the mouse. Genes Dev. 1995;9:2105–2116. doi: 10.1101/gad.9.17.2105. - DOI - PubMed
    1. Cheng P, et al. Fibronectin mediates mesendodermal cell fate decisions. Development. 2013;140:2587–2596. doi: 10.1242/dev.089052. - DOI - PMC - PubMed

Publication types

MeSH terms