. 2019 Jan;38(2):209-227.
doi: 10.1038/s41388-018-0433-7. Epub 2018 Aug 7.

Vav proteins maintain epithelial traits in breast cancer cells using miR-200c-dependent and independent mechanisms

Affiliations

Vav proteins maintain epithelial traits in breast cancer cells using miR-200c-dependent and independent mechanisms

L Francisco Lorenzo-Martín et al. Oncogene. 2019 Jan.

Abstract

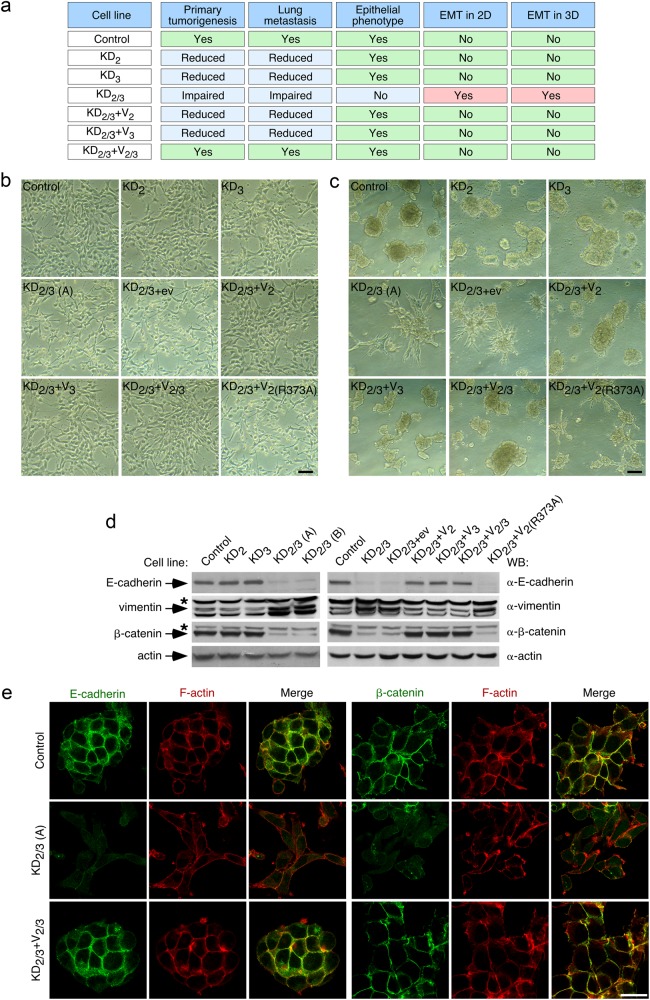
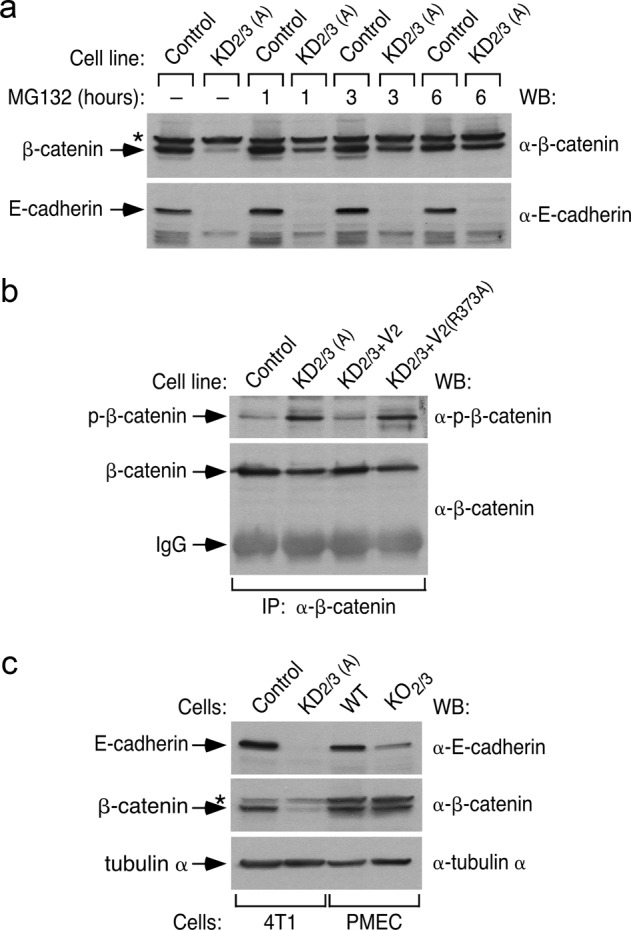
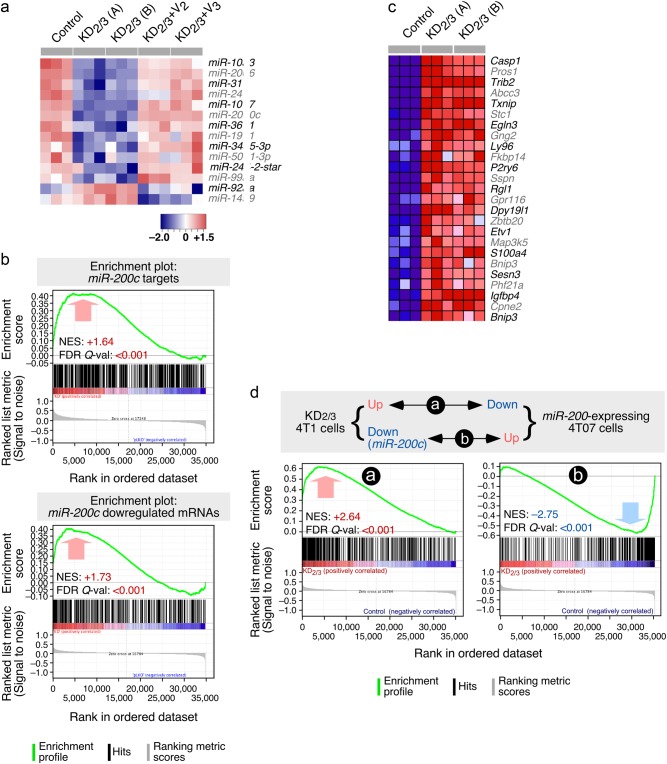
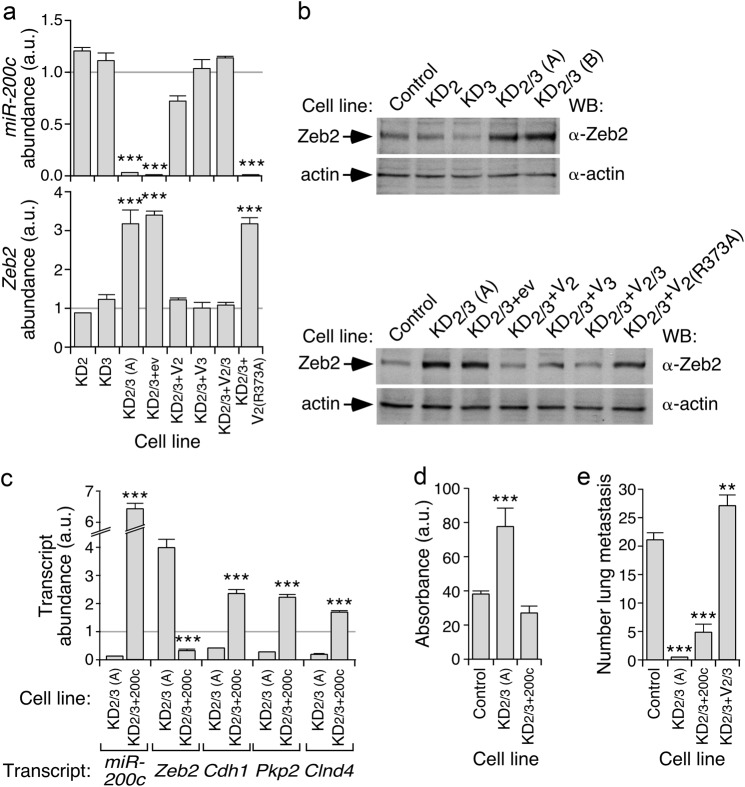
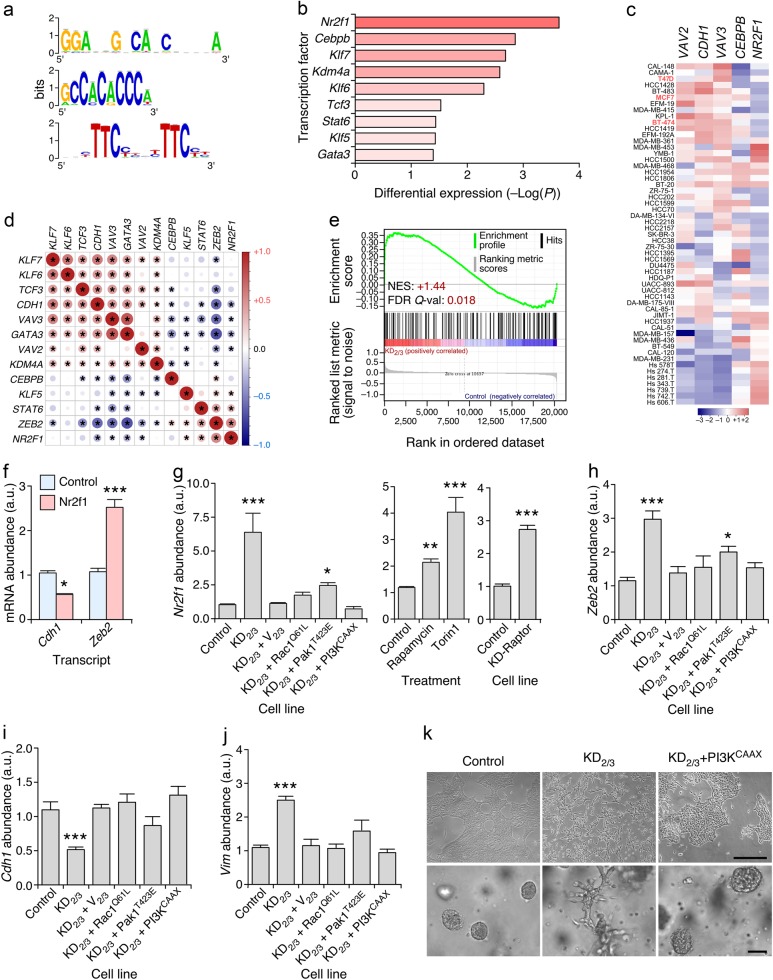
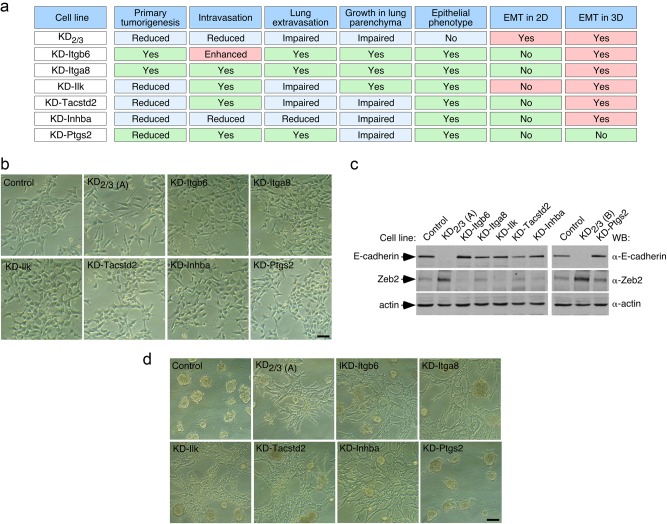
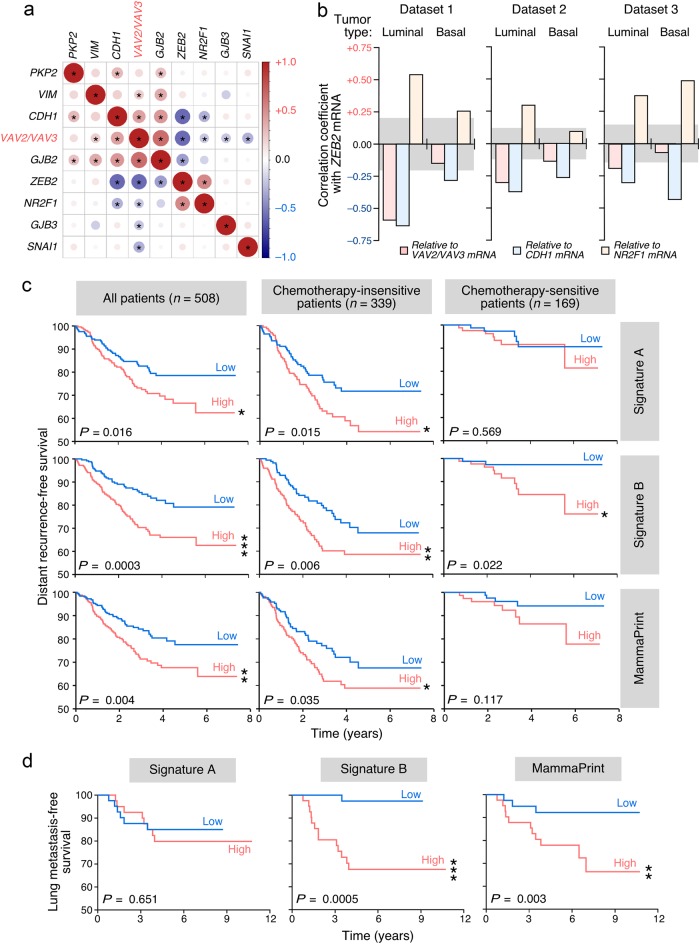
The bidirectional regulation of epithelial-mesenchymal transitions (EMT) is key in tumorigenesis. Rho GTPases regulate this process via canonical pathways that impinge on the stability of cell-to-cell contacts, cytoskeletal dynamics, and cell invasiveness. Here, we report that the Rho GTPase activators Vav2 and Vav3 utilize a new Rac1-dependent and miR-200c-dependent mechanism that maintains the epithelial state by limiting the abundance of the Zeb2 transcriptional repressor in breast cancer cells. In parallel, Vav proteins engage a mir-200c-independent expression prometastatic program that maintains epithelial cell traits only under 3D culture conditions. Consistent with this, the depletion of endogenous Vav proteins triggers mesenchymal features in epithelioid breast cancer cells. Conversely, the ectopic expression of an active version of Vav2 promotes mesenchymal-epithelial transitions using E-cadherin-dependent and independent mechanisms depending on the mesenchymal breast cancer cell line used. In silico analyses suggest that the negative Vav anti-EMT pathway is operative in luminal breast tumors. Gene signatures from the Vav-associated proepithelial and prometastatic programs have prognostic value in breast cancer patients.


Conflict of interest statement

The authors declare that they have no conflict of interest.

Figures

Fig. 1
Fig. 1
Vav2 and Vav3 are required to maintain epithelial traits in breast cancer cells. a Defects shown by indicated 4T1 cell lines on primary tumorigenesis and lung metastasis according to earlier work [26]. The epithelial and mesenchymal phenotypes scored in the current work are also included. b, c Representative example of the morphology of indicated 4T1 cell lines in 2D (b) and 3D (c) cultures (n = 3 independent experiments). Scale bars, 50 μm. KD2/3 (A) and KD2/3 (B) are two independent clones of Vav2;Vav3 knockdown 4T1 cells [26] (Table S1). d Representative immunoblot showing the abundance of indicated endogenous proteins in lysates from 4T1 cells lines shown on top (n = 3 independent experiments). The primary antibody used in the immunoblot is shown in the right. For loading control, we used the abundance of endogenous actin. Asterisks mark nonspecific bands. e Representative immunofluorescence analysis showing the abundance and subcellular localization of endogenous E-cadherin (green color), rhodamine phalloidin-stained F-actin (red color), and β-catenin (green color) in indicated 4T1 cell lines (left) (n = 3 independent experiments). Scale bar, 25 μm
Fig. 2
Fig. 2
Vav2 and Vav3 regulate E-cadherin and β-catenin using different mechanisms. a Representative immunoblot showing the abundance of endogenous β-catenin (top panel) and E-cadherin (bottom panel) in indicated 4T1 cell lines and experimental conditions (top) (n = 3 independent experiments). b Example of the phosphorylation level (top panel) of endogenous β-catenin immunoprecipitated (IP) from indicated 4T1 cell lines (top). As control, the filter was reblotted with antibodies to total β-catenin (bottom panel) (n = 3 independent experiments). IgG, immunoglobulin band derived from the antibody used in the immunoprecipitation step. To ensure comparable levels of the immunoprecipitated β-catenin, we used in the case of KD2/3 cells 10-fold more protein extracts than in the case of control cells. c Abundance of endogenous E-cadherin (top panel), β-catenin (middle panel), and tubulin α (loading control, bottom panel) in indicated cell extracts (n = 2 independent experiments). WT and KO2/3, primary mammary epithelial cells (PMEC) from wild-type and Vav2–/–;Vav3–/– mice, respectively. In a and c, asterisk label nonspecific bands
Fig. 3
Fig. 3
The Vav coding transcriptome and microRNAome are linked to EMT programs. a Heatmap of the microRNAs that are up- (red) and downregulated (blue) in indicated 4T1 cell lines (top). Triplicates for each cell line (columns) are shown. Relative changes in abundance are shown in color gradients according to the scale shown at the bottom. b GSEA showing the overlap of the Vav-regulated 4T1 cell transcriptome with the miR-200c-dependent transcriptome previously described in endometrium (top) and breast (bottom) cancer cells. The normalized enrichment scores (NES) and false discovery rate values (FDR, using q values) are indicated inside each GSEA graph. Q-val, q value. c Heatmap showing the expression of the top 25 leading-edge genes that show overlap between the miR-200c- and Vav2;Vav3-dependent transcriptome in indicated cell lines (top). Changes in abundance are plotted as in a. d Top panel, scheme of the similarities expected according to the mechanistic model proposed in this study. Bottom panels, GSEAs showing the similarities of the transcriptomal subsets indicated in top. The NES and FDR values are shown inside each graph as indicated in Fig. 3b. Red and blue values represent positive and negative correlation between the two analyzed transcriptomes
Fig. 4
Fig. 4
Vav2 and Vav3 regulate the miR-200c–Zeb2 axis in 4T1 cells. a qRT-PCR showing the abundance of miR-200c (top) and Zeb2 mRNA (bottom) in indicated 4T1 cell lines. Expression values are plotted relative to the levels of the indicated transcript in the parental cell line (which was given an arbitrary value of 1 and represented in the figure as a gray horizontal lane). ***P ≤ 0.001 (n = 3 independent experiments, each performed in triplicate). a.u., arbitrary units. b Representative immunoblot showing the abundance of Zeb2 and actin (loading control) in indicated cell lines (top) (n = 3 independent experiments). c qRT-PCR showing the abundance of indicated miR-200c and specific transcripts (bottom) in indicated 4T1 cell derivatives. Expression values are plotted as in a. ***P ≤ 0.001 (n = 3 independent experiments, each performed in triplicate). d Response of indicated 4T1 cell derivatives (left) to doxorubicin (500 ng/ml). Values represent the variation relative to untreated cells (which was given an arbitrary value of 100). ***P ≤ 0.001 (n = 3 independent experiments, each performed in triplicate). e Metastasis formed in the lung by the indicated intravenously injected cells. **P ≤ 0.01; ***P ≤ 0.001 (n = 4 animals/cell line)
Fig. 5
Fig. 5
Vav proteins regulate epithelial morphology using a Rac1-dependent, PI3Kα-dependent, and Nr2f1-dependent mechanism. a Sequence logos of the transcription factor binding sites enriched in the promoter region of Vav-regulated microRNAs. b Changes in expression of the indicated transcripts in KD2/3 versus parental 4T1 cells according to microarray analyses [43]. c Abundance of indicated transcripts (top) in the Cancer Cell Line Encyclopedia collection of human breast cancer cell lines (left) [65]. In red, we show cell lines used in subsequent analyses (left). Changes in abundance are plotted as in Fig. 3a. d Expression correlation matrix of indicated transcripts in the human breast tumor samples present in the GSE65194 microarray dataset. Positive and negative correlation is shown in red and blue, respectively. The size and color intensity of circles are proportional to the Pearson correlation coefficient found for each transcript pair. Correlations with P values above the significance threshold of 0.05 have been labeled with an asterisk. e GSEA showing the enrichment of previously described Nr2f1 gene targets [38] in the Vav-regulated 4T1 cell transcriptome [43]. Further information about this type of analysis has been provided in the legend to Fig. 3b. f qRT-PCR-determined abundance of indicated transcripts (bottom) upon the transient expression of Nr2f1 in 4T1 cells. Expression values are plotted relative to the levels of the indicated transcript in the parental cell line (which was given an arbitrary value of 1). *P ≤ 0.05; ***P ≤ 0.001 (n = 3 independent experiments, each performed in triplicate). g Abundance of the Nr2f1 mRNA in indicated 4T1 cells and experimental conditions. Experiments were performed as in f. *P ≤ 0.05; ***P ≤ 0.01; ***P ≤ 0.001 (n = 3 independent experiments, each performed in triplicate). hj Abundance of Zeb2 (h), Cdh1 (i), and Vim (j) transcripts in control and indicated 4T1 cell derivatives (bottom). Experiments were performed as in f. ***P ≤ 0.001 (n = 3 independent experiments, each performed in triplicate). k Representative example of the morphology of indicated 4T1 cell lines in 2D (top) and 3D (bottom) cultures (n = 3 independent experiments). Scale bars, 50 μm
Fig. 6
Fig. 6
Vav proteins regulate 3D EMT using Zeb2- and E-cadherin-independent mechanisms. a Defects shown by the indicated 4T1 cell derivatives in primary tumorigenesis and specific steps of the metastatic dissemination to the lung [26]. The epithelial and mesenchymal status in 2D and 3D obtained in this work are also included. b Representative example of the morphology of indicated 4T1 cell lines in 2D culture (n = 3 independent experiments). Scale bar, 50 μm. c Representative immunoblot showing the abundance of indicated endogenous proteins in lysates from 4T1 cell line derivatives shown on top. Actin has been used as loading control (n = 3 independent experiments). d Representative example of the morphology of indicated 4T1 cell lines in 3D culture (n = 3 independent experiments). Scale bar, 50 μm
Fig. 7
Fig. 7
Prognostic value of Vav EMT- and lung metastasis-associated gene signatures. a Expression correlation matrix of indicated transcripts in human luminal breast tumor samples present in the GSE65194 microarray dataset (luminal tumors) [66]. In these analyses, the abundance of VAV2 and VAV3 mRNAs (VAV, red lettering) was pooled together to calculate the expression correlation values. The graphic representation was made as indicated in Fig. 5d. b Graph representing the Pearson correlation coefficient of the ZEB2 mRNA with indicated transcripts, tumor subtypes, and microarray datasets 1 (GSE65194) [66], 2 (GSE25066) [67, 68] and 3 (GSE78958) [69]. The gray areas depict the nonstatistically significant values according to statistical threshold used in the analyses (P ≤ 0.05). c, d Patients were stratified into high (red lanes) and low (blue lanes) groups according to their similarity to the miR-200c–Vav2;Vav3-associated EMT (c, top panels; d, left panel), the Vav2;Vav3-dependent prometastatic (c and d, middle panels), and the MammaPrint (c, bottom panels; d, right panel) signatures and curves plotted according to either distant recurrence-free survival (c) in the indicated patient groups (top, gray boxes) or lung metastasis-free survival (d). Datasets used in these analyses were GSE25066 (for the survival analyses) [67, 68], GSE2603 (for the survival analyses) [70], and GSE2603 (metastasis free-survival) [70]

References

    1. De Craene B, Berx G. Regulatory networks defining EMT during cancer initiation and progression. Nat Rev Cancer. 2013;13:97–110. doi: 10.1038/nrc3447. - DOI - PubMed
    1. Dykxhoorn DM, Wu Y, Xie H, Yu F, Lal A, Petrocca F, et al. miR-200 enhances mouse breast cancer cell colonization to form distant metastases. PLoS ONE. 2009;4:e7181. doi: 10.1371/journal.pone.0007181. - DOI - PMC - PubMed
    1. Fischer KR, Durrans A, Lee S, Sheng J, Li F, Wong ST, et al. Epithelial-to-mesenchymal transition is not required for lung metastasis but contributes to chemoresistance. Nature. 2015;527:472–6. doi: 10.1038/nature15748. - DOI - PMC - PubMed
    1. Lamouille S, Xu J, Derynck R. Molecular mechanisms of epithelial-mesenchymal transition. Nat Rev Mol Cell Biol. 2014;15:178–96. doi: 10.1038/nrm3758. - DOI - PMC - PubMed
    1. Nieto MA, Huang RY, Jackson RA, Thiery JP. EMT: 2016. Cell. 2016;166:21–45. - PubMed

Publication types