. 2018 Jul 24:12:55.
doi: 10.3389/fncir.2018.00055. eCollection 2018.

Temporal Coding of Voice Pitch Contours in Mandarin Tones

Affiliations

Temporal Coding of Voice Pitch Contours in Mandarin Tones

Fei Peng et al. Front Neural Circuits. .

Abstract

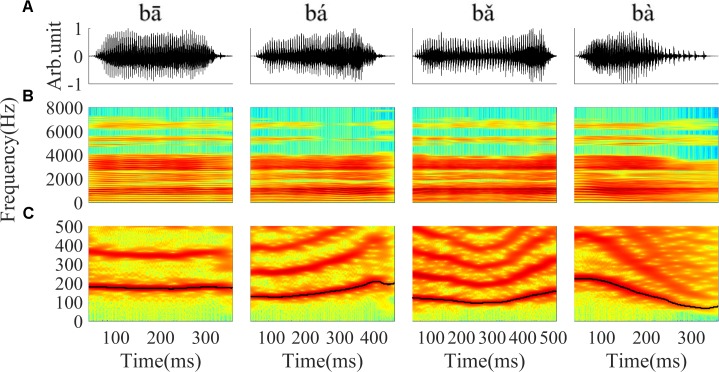
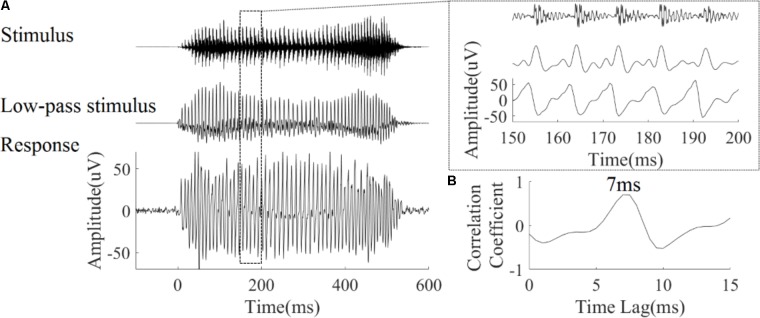
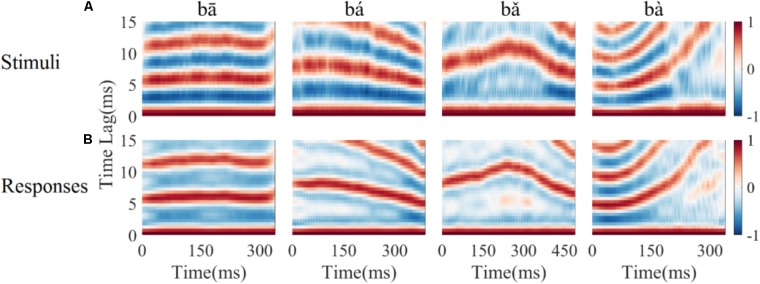
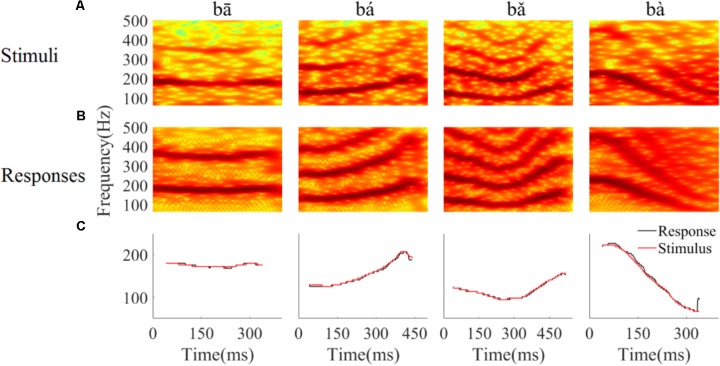
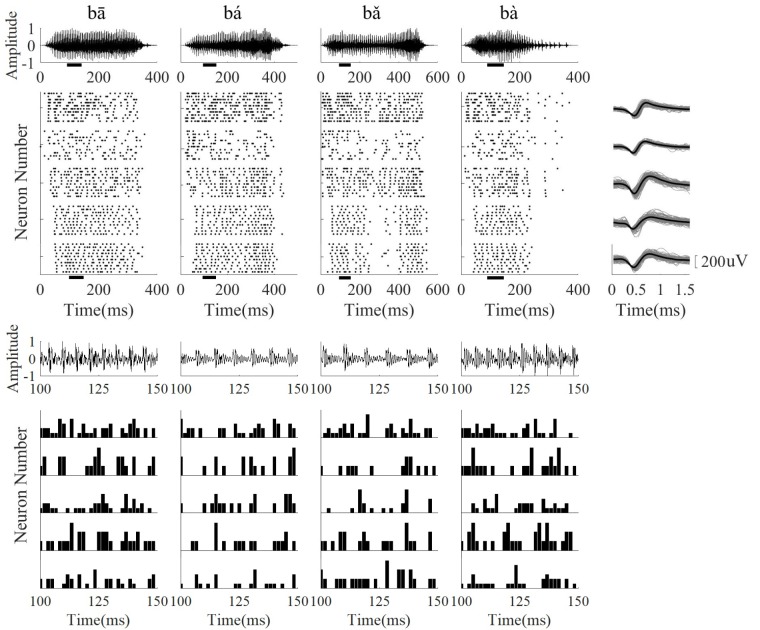
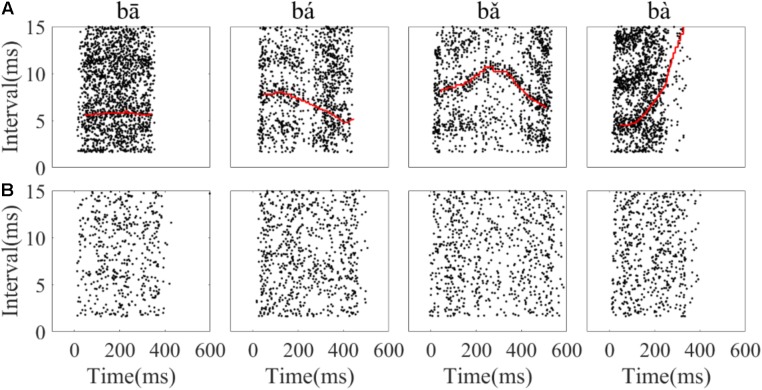
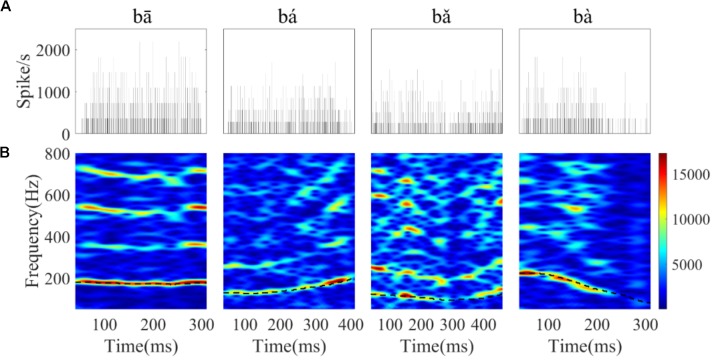
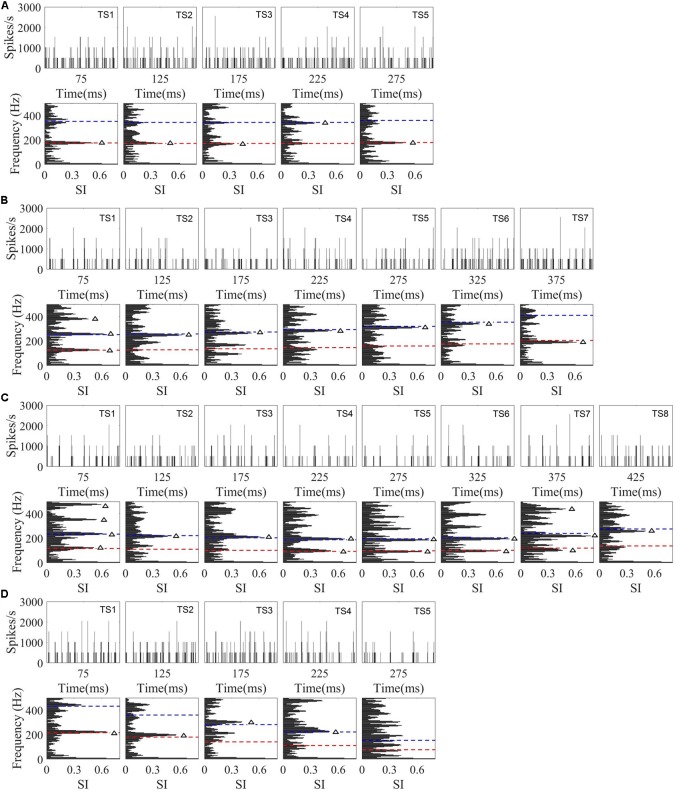
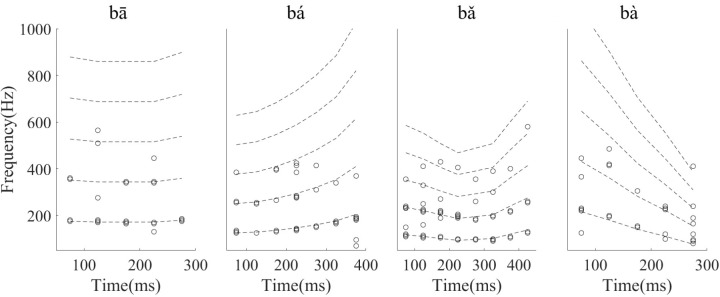
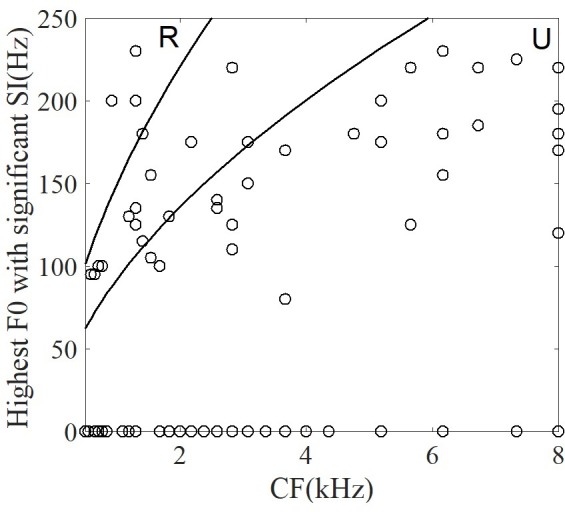
Accurate perception of time-variant pitch is important for speech recognition, particularly for tonal languages with different lexical tones such as Mandarin, in which different tones convey different semantic information. Previous studies reported that the auditory nerve and cochlear nucleus can encode different pitches through phase-locked neural activities. However, little is known about how the inferior colliculus (IC) encodes the time-variant periodicity pitch of natural speech. In this study, the Mandarin syllable /ba/ pronounced with four lexical tones (flat, rising, falling then rising and falling) were used as stimuli. Local field potentials (LFPs) and single neuron activity were simultaneously recorded from 90 sites within contralateral IC of six urethane-anesthetized and decerebrate guinea pigs in response to the four stimuli. Analysis of the temporal information of LFPs showed that 93% of the LFPs exhibited robust encoding of periodicity pitch. Pitch strength of LFPs derived from the autocorrelogram was significantly (p < 0.001) stronger for rising tones than flat and falling tones. Pitch strength are also significantly increased (p < 0.05) with the characteristic frequency (CF). On the other hand, only 47% (42 or 90) of single neuron activities were significantly synchronized to the fundamental frequency of the stimulus suggesting that the temporal spiking pattern of single IC neuron could encode the time variant periodicity pitch of speech robustly. The difference between the number of LFPs and single neurons that encode the time-variant F0 voice pitch supports the notion of a transition at the level of IC from direct temporal coding in the spike trains of individual neurons to other form of neural representation.

Keywords: fundamental frequency; inferior colliculus; natural speech; temporal coding; time-variant; voice pitch contours.


Figures

FIGURE 1
FIGURE 1
The waveform, spectrogram and F0 curve of the four Mandarin tones used in the current study. (A) From left to right, waveform of ‘bā’,‘bá’, ‘bǎ’, ‘bà’ stimulus, respectively. (B) Spectrogram of ‘bā’, ‘bá’, ‘bǎ’, ‘bà’. (C) The low frequency (0–500 Hz) spectrogram with the F0 curve shown by a black line. The colors in the spectrogram represent spectral energy from blue (low) to red (high).
FIGURE 2
FIGURE 2
(A) Stimulus waveform (top), low-pass filtered stimulus waveform (middle) and one representative trace of an LFP response (CF = 5.19 kHz) waveform (bottom) to the flat tone stimulus ‘bā’. The right panel shows a magnified version from 150 to 200 ms. (B) The cross-correlation between the low-pass stimulus and response; the peak corresponded to a latency of 7 ms.
FIGURE 3
FIGURE 3
Autocorrelograms of the stimuli (row A), and one representative LFP response (CF = 5.19 kHz) (row B). The time indicated on the horizontal axis represents the start of each 40 ms time bin calculated, the vertical axis represents the time lag (ms) between original signal and a time shifted copy signal, and colors represent the strength of correlation (red is positive, blue is negative).
FIGURE 4
FIGURE 4
Spectrograms of the stimulus (A) and single representative LFP recording (CF = 2.38 kHz) (B). (C) F0 curve of stimulus (red) and response (black). From left to right, each column corresponds to flat tone, rising tone, falling then rising tone and falling tone, respectatively. In rows (A,B), the horizontal axis indicates the midpoint of each 80 ms hanning window, vertical axis indicates frequency, and the colors indicate spectral energy (red is highest). In row (C), the horizontal axis represents the midpoint of each time bin, the black line represents the response F0 curve and red line represents the stimulus F0 curve.
FIGURE 5
FIGURE 5
The stimulus waveform (top row), five representative neuron raster plots (from top to bottom, CF was 2.59, 5.19, 6.73, 2.59, 5.19 kHz, respectively), and corresponding neuron spike wavefoms (right column). The PSTH of each neuron in a short time segment (100–150 ms) is shown in the bottom panel. From (left) to (right), the stimulus waveforms were ‘bā’,‘bá’, ‘bǎ’, ‘bà’, respectively. For the spike waveforms, the gray lines represent each single spike waveform and the black line represents the mean waveform. The short black bars below the horizontal axis in the stimulus waveform and raster plots represent the time segment used for calculating the PSTH.
FIGURE 6
FIGURE 6
Example of running all-order intervals of two representative IC neurons’ responses to the four speech stimuli. (A) One neuron (CF = 2.83 kHz) in which the most frequent intervals followed the corresponding fundamental period of the stimulus (red line in each figure). (B) One neuron (CF = 3.08 kHz) with intervals that did not match the F0 period. From left to right, each figure corresponds to stimulus ‘bā’,‘bá’, ‘bǎ’, ‘bà’, respectively. Each dot represents an interspike interval (vertical axis) at specific end time (horizantal axis) relative to stimulus onset.
FIGURE 7
FIGURE 7
The PSTHs (A) and spectrograms of the corresponding PSTH (B) of a single neuron (CF = 8 kHz) in response to the four tones. The horizontal axis of the spectrogram indicates the midpoint of each 80 ms hanning window, the vertical axis indicates frequency, and the colors indicate the amplitude of the Fourier transform at each time bin (red is highest). The black dashed line in each figure corresponds to the stimulus F0 curve.
FIGURE 8
FIGURE 8
Example of the PSTHs at each time segment, and PSTH response spectra from a single neuron (CF = 5.66 kHz) response to four tones. (A–D) Correspond to flat tone, rising tone, falling then rising tone, and falling tone, respectively. For each PSTH, the horizontal axis represents time relative to onset of speech, the vertical axis indicates the spike rate per 0.195ms bin, and the time segment (TS) is indicated in the right corner of each plot. The stimulus F0 (red line) and 2F0 (blue line) are plotted in each response spectrum. The triangle symbol in the response spectrum represents a significantly synchronized frequency.
FIGURE 9
FIGURE 9
The significant synchronization frequency component with maximum synchronized index for neurons with at least one significantly synchronized frequency (n = 42). Each circle indicates one neuron significantly synchronized frequency at each time segment, and the dashed line indicates the stimulus F0 and harmonics. The time indicated in the x axis is the midpoint of each time segment.
FIGURE 10
FIGURE 10
The correlation between the highest F0 with a significant SI and CF of single neuron. The two lines correspond to the range of resolvability (see ‘Discussion’). The harmonics of stimuli (upper left) around the CF would be resolved (‘R’ in figure), whereas the harmonics around CF (lower right) would be unresolved (‘U’ in figure).

References

    1. Albrecht D., Davidowa H. (1989). Action of urethane on dorsal lateral geniculate neurons. Brain Res. Bull. 22 923–927. 10.1016/0361-9230(89)90001-4 - DOI - PubMed
    1. Andoni S., Li N., Pollak G. D. (2007). Spectrotemporal receptive fields in the inferior colliculus revealing selectivity for spectral motion in conspecific vocalizations. J. Neurosci. 27 4882–4893. 10.1523/JNEUROSCI.4342-06.2007 - DOI - PMC - PubMed
    1. Bartlett E. L., Wang X. (2007). Neural representations of temporally modulated signals in the auditory thalamus of awake primates. J. Neurophysiol. 97 1005–1017. 10.1152/jn.00593.2006 - DOI - PubMed
    1. Batra R., Kuwada S., Stanford T. R. (1989). Temporal coding of envelopes and their interaural delays in the inferior colliculus of the unanesthetized rabbit. J. Neurophysiol. 61 257–268. 10.1152/jn.1989.61.2.257 - DOI - PubMed
    1. Bendor D., Wang X. (2005). The neuronal representation of pitch in primate auditory cortex. Nature 436 1161–1165. 10.1038/nature03867 - DOI - PMC - PubMed

Publication types

LinkOut - more resources