

Projecting Pharmaceutical Expenditure in EU5 to 2021: Adjusting for the Impact of Discounts and Rebates
- PMID: 30088251
- PMCID: PMC6244625
- DOI: 10.1007/s40258-018-0419-1
Projecting Pharmaceutical Expenditure in EU5 to 2021: Adjusting for the Impact of Discounts and Rebates
Abstract
Background: Within (European) healthcare systems, the predominant goal for pharmaceutical expenditure is cost containment. This is due to a general belief among healthcare policy makers that pharmaceutical expenditure-driven by high prices-will be unsustainable unless further reforms are enacted.
Objective: The aim of this paper is to provide more realistic expectations of pharmaceutical expenditure for all key stakeholder groups by estimating pharmaceutical expenditure at 'net' prices. We also aim to estimate any gaps developing between list and net pharmaceutical expenditure for the EU5 countries (i.e. France, Germany, Italy, Spain, and the UK).
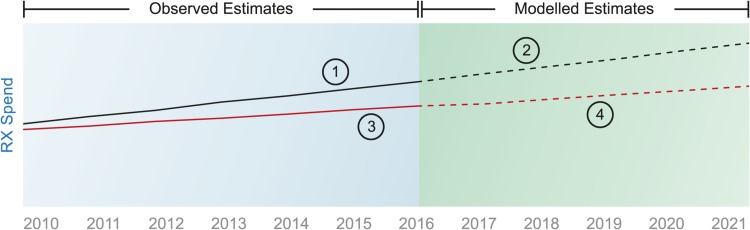
Methods: We adjusted an established forecast of pharmaceutical expenditure for the EU5 countries, from 2017 to 2021, by reflecting discounts and rebates not previously considered, i.e. we moved from 'list' to 'net' prices, as far as data were available.
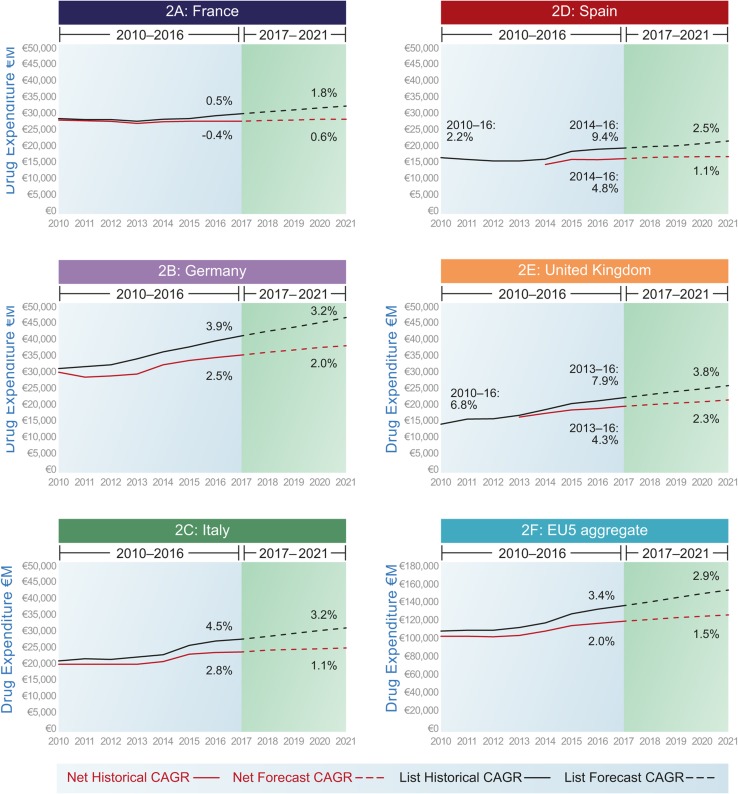
Results: We found an increasing divergence between expenditure measured at list and net prices. When the forecasts for the five countries were aggregated, the EU5 (unweighted) average historical growth (2010-2016) rate fell from 3.4% compound annual growth rate at list to 2.5% at net. For the forecast, the net growth rate was estimated at 1.5 versus 2.9% at list.
Conclusions: Our results suggest that future growth in pharmaceutical expenditure in Europe is likely to be (1) lower than previously understood from forecasts based on list prices and (2) below predicted healthcare expenditure growth in Europe and in line with long-term economic growth rates. For policy makers concerned about the sustainability of pharmaceutical expenditure, this study may provide some comfort, in that the perceived problem is not as large as expected.
Conflict of interest statement
Data availability statement
The datasets generated during and/or analysed during the current study are not publicly available because they are owned by a third party (IQVIA). Aggregated data might be available from the corresponding author on reasonable request. The data we used on the level of rebates and discounts are available publicly (see references in text).
Conflict of interest
JE, MS, BG, PA, CJ have received an honorarium from Celgene International for attending an advisory meeting. JM-F received an honorarium from Celgene International for attending an advisory meeting and to support the writing of the paper. SF and AP are employees of Celgene International. AH is employed by Dolon Ltd, a consultancy that provides services to pharmaceutical companies, including Celgene International. All authors have no conflicts of interest that are directly relevant to the content of this article.
Figures
References
-
- OECD. Pharmaceutical spending (indicator). 2018. 10.1787/998febf6-en. Accessed 5 Jul 2018.
-
- OECD. Ensuring health system sustainability and access to innovation. http://www.oecd.org/health/health-systems/Ensuring-health-system-sustain.... Accessed 1 Aug 2018.
-
- OECD. Pharmaceuticals. http://www.oecd.org/els/health-systems/pharmaceuticals.htm. Accessed 1 Aug 2018.
MeSH terms
LinkOut - more resources
Full Text Sources
Other Literature Sources
