. 2018 Aug 8;12(8):e0006710.
doi: 10.1371/journal.pntd.0006710. eCollection 2018 Aug.

Aberrant plasma MMP and TIMP dynamics in Schistosoma - Immune reconstitution inflammatory syndrome (IRIS)

Affiliations

Aberrant plasma MMP and TIMP dynamics in Schistosoma - Immune reconstitution inflammatory syndrome (IRIS)

Odin Goovaerts et al. PLoS Negl Trop Dis. .

Abstract

Background: Among the different faces of immune reconstitution inflammatory syndrome (IRIS) developing in HIV-patients, no clinical definition has been reported for Schistosomiasis-IRIS (Schisto-IRIS). Although Schisto-IRIS remains largely uninvestigated, matrix metalloproteinases (MMP) and tissue inhibitors of metalloproteinases (TIMP) have previously been associated with S. mansoni infection and tuberculosis-IRIS. Here, we aimed to investigate the relevance of these markers in Schisto-IRIS.

Methodology: Patients were diagnosed with IRIS related to S. mansoni within a cohort of patients with Schistosomiasis-HIV co-infection, using a clinical working definition of Schisto-IRIS. We compared 9 patients who developed Schisto-IRIS to 9 Schisto+HIV+ controls who did not, and 9 Schisto-HIV+ controls. Plasma levels of MMP-1, MMP-7, MMP-10, TIMP-1, TIMP-2, sCD14, intestinal fatty-acid binding protein, C-reactive protein, and 8 anti-nuclear antibodies (ANA) were analyzed prior to and during 3 months of ART.

Principal findings: Although no differences were observed for MMP-1 and -7, MMP-10 levels decreased significantly in Schisto+HIV+ controls during 3 months of ART (p = 0.005) while persisting in Schisto-IRIS patients at significantly higher levels compared to Schisto-HIV+ controls (p≤0.030). In contrast TIMP-1 levels only decreased significantly in Schisto-IRIS patients (p = 0.012), while TIMP-2 levels were lower compared to Schisto+HIV+ controls at 2 weeks (p = 0.007), 1 month (p = 0.005) and 3 months (p = 0.031) of ART. Five out of 8 ANAs studied decreased significantly in Schisto-IRIS patients after 1 month of ART(p≤0.039), whereas only 1 ANA decreased for Schisto+HIV+ controls (p = 0.027).

Conclusions/significance: In this study, we propose a working definition for the diagnosis of Schisto-IRIS in resource limited settings. We report persistent plasma levels of MMP-10, along with a more pronounced decrease in TIMP-1 and ANA-levels, and low levels of TIMP-2 during 3 months of ART. Corresponding to the clinical symptoms, these data suggest that Schisto-IRIS is marked by unbalanced MMP/TIMP dynamics which favor inflammation.


Conflict of interest statement

The authors have declared that no competing interests exist.

Figures

Fig 1
Fig 1. Flow chart of study population.
Chart shows the selection of patients for this case-control study, nested within a previous prospective study on HIV-schistosoma co-infection. A number of Schisto-IRIS patients (17/26) were excluded due to sample or data issues, resulting in 9 patients selected with clinical data and non-haemolitic samples available at each time point. Additional Schisto+HIV+ (n = 9) and Schisto-HIV+ (n = 9) patients were randomly selected as controls, except for allowing comparable gender distribution between groups.
Fig 2
Fig 2. Patient follow-up.
Chart shows a time line of patient follow-up during the study. Before enrolment, adult HIV+ patients who were ART naïve and receiving voluntary counseling and testing (VCT) were screened for TB, malaria and hepatitis B virus (HBV), and soil transmitted helminths (STH). Patients then underwent clinical and lab-investigations at baseline (i.e. prior to starting ART and PZQ treatment), and at 2 weeks, 1 month and 3 months after starting ART. Additional screening for signs of S. mansoni infection by ultrasound were performed at baseline and month 3. aPatients initiated ART and PZQ treatment in close proximity to each other, prior the week 2 visit. Since patients had to be referred to the ART-treatment center, some patients received PZQ before starting ART and some shortly after. bKato Katz smear was performed at each visit by performing 2 smears on 1 stool sample for quantitative evaluation of S. manoni, Ascaris lumbricoides, Trichuris trichuria, hookworm, while S. haematobium eggs were evaluated by a urine filtration method.
Fig 3
Fig 3. Time analysis of CD4 counts.
Graph shows CD4 counts before and during ART in Schisto-IRIS patients (red circles), Schisto+HIV+ controls (blue triangles) and Schisto-HIV+ controls (green squares). The significant change over for each patient group was calculated using the Friedman test (p-values shown in graphs), with Dunn’s multiple comparison post-hoc tests to indicate differences between time points (indicated by horizontal bars with an asterisk). B = baseline, W2 = week 2, M1 = month 1, and M3 = month 3.
Fig 4
Fig 4. Correlation of treatment interval with onset of IRIS.
Graph shows a correlation between ART-PZQ interval and onset of IRIS symptoms (#days since ART initiation), negative values indicate PZQ treatment prior to ART and dotted line represents 0 days interval.
Fig 5
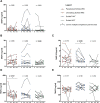
Fig 5. Time analysis of MMPs and TIMPs.
Graphs show plasma levels of (A) MMP-1, (B) MMP-7, (C) MMP-10, (D) TIMP-1, and (E) TIMP-2 before and during ART in Schisto-IRIS patients (red circles), Schisto+HIV+ controls (blue triangles) and Schisto-HIV+ controls (green squares). The significant change over time for each patient group was calculated using the Friedman test (p-values shown in graphs), with Dunn’s multiple comparison post-hoc tests to indicate differences between time points (indicated by horizontal bars with an asterisk). B = baseline, W2 = week 2, M1 = month 1, and M3 = month 3.
Fig 6
Fig 6. Time analysis of CRP, I-FABP and sCD14.
Graphs show plasma levels of (A) CRP, (B) I-FABP and (C) sCD14 before and during ART in Schisto-IRIS patients (red circles), Schisto+HIV+ controls (blue triangles) and Schisto-HIV+ controls (green squares). The significant change over time for each patient group was calculated using the Friedman test (p-values shown in graphs), with Dunn’s multiple comparison post-hoc tests to indicate differences between time points when applicable (indicated by horizontal bars with an asterisk). One Schisto-HIV+ patient did not have sufficient sample volume for CRP determination. B = baseline, W2 = week 2, M1 = month 1, and M3 = month 3.
Fig 7
Fig 7. Time analysis of 8 anti-nuclear antibodies.
Graphs show semi-quantitative values of plasma levels of ANAs, calculated as a ratio of positive cut-off control (index value). Index values of (A) U1 snRNP, (B) snRNP/Sm complex, (C) Sm, (D) SS-A, (E) SS-B, (F) Scl 70, (G) CenpB and (H) Jo-1 before and during 1 month of ART are shown in Schisto-IRIS patients (red circles) and Schisto+HIV+ controls (blue triangles). The significant change over time for each patient group was calculated using the Wilcoxon-signed rank test (p-values shown in graphs). B = baseline, M1 = month 1.

References

    1. Meintjes G, Lynen L (2008) Prevention and treatment of the immune reconstitution inflammatory syndrome. Curr Opin HIV AIDS 3: 468–476. 10.1097/COH.0b013e3282fe6e84 - DOI - PubMed
    1. Meintjes G, Lawn SD, Scano F, Maartens G, French MA, Worodria W, Elliott JH, Murdoch D, Wilkinson RJ, Seyler C, John L, van der Loeff MS, Reiss P, Lynen L, Janoff EN, Gilks C, Colebunders R (2008) Tuberculosis-associated immune reconstitution inflammatory syndrome: case definitions for use in resource-limited settings. Lancet Infect Dis 8: 516–523 10.1016/S1473-3099(08)70184-1 - DOI - PMC - PubMed
    1. Muller M, Wandel S, Colebunders R, Attia S, Furrer H, Egger M (2010) Immune reconstitution inflammatory syndrome in patients starting antiretroviral therapy for HIV infection: a systematic review and meta-analysis. Lancet Infect Dis 10: 251–261. 10.1016/S1473-3099(10)70026-8 - DOI - PMC - PubMed
    1. Lawn SD, Meintjes G (2011) Pathogenesis and prevention of immune reconstitution disease during antiretroviral therapy. Expert Rev Anti Infect Ther 9: 415–430. 10.1586/eri.11.21 - DOI - PMC - PubMed
    1. Fernando R, Miller R (2002) Immune reconstitution eosinophilia due to schistosomiasis. Sex Transm Infect 78: 76. - PMC - PubMed

Publication types

MeSH terms

Substances