. 2018 Aug 7;24(6):1434-1444.e7.
doi: 10.1016/j.celrep.2018.07.009.

Functional Annotation of ESR1 Gene Fusions in Estrogen Receptor-Positive Breast Cancer

Affiliations

Functional Annotation of ESR1 Gene Fusions in Estrogen Receptor-Positive Breast Cancer

Jonathan T Lei et al. Cell Rep. .

Abstract

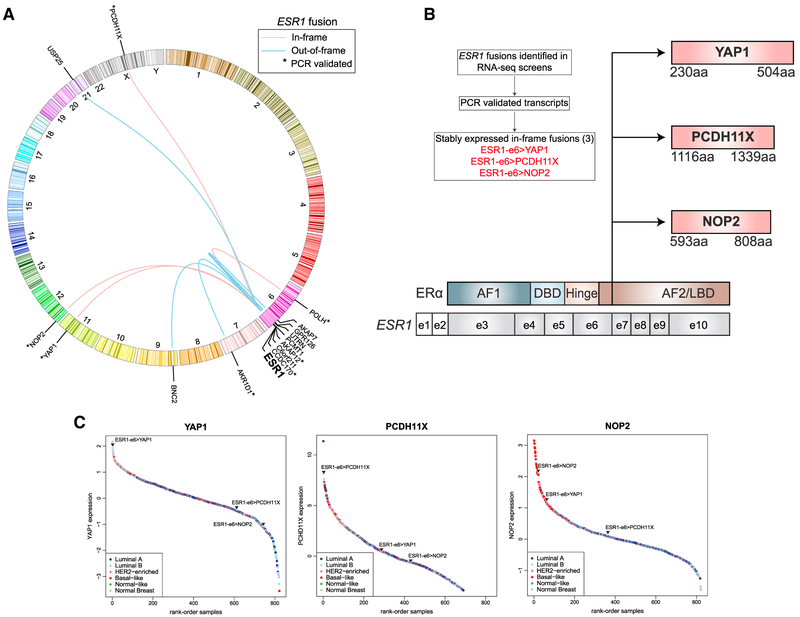
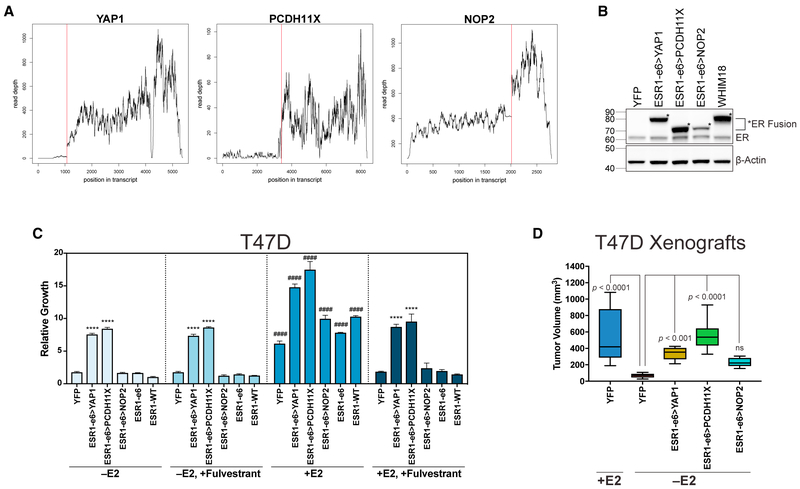
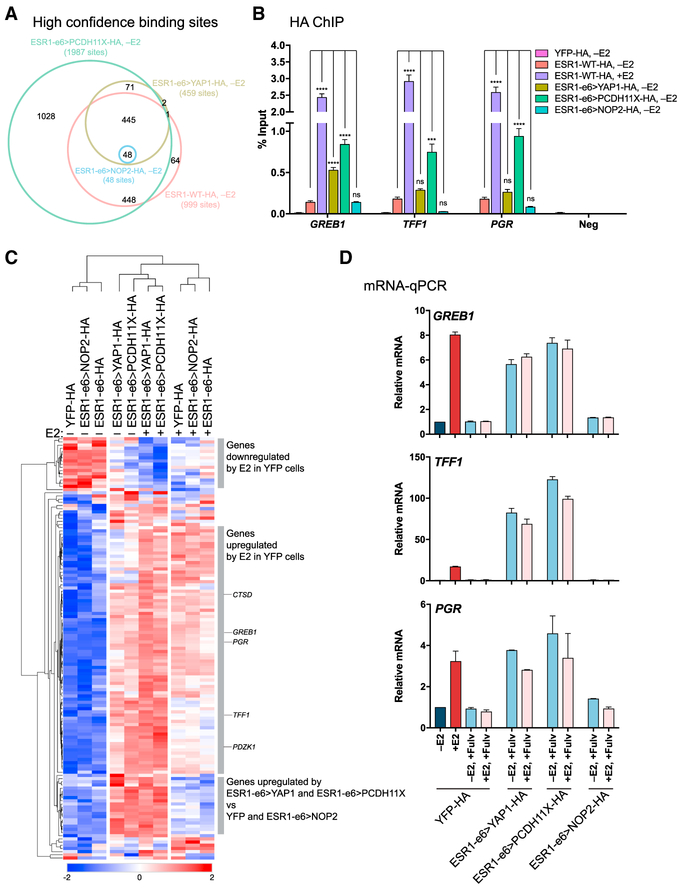
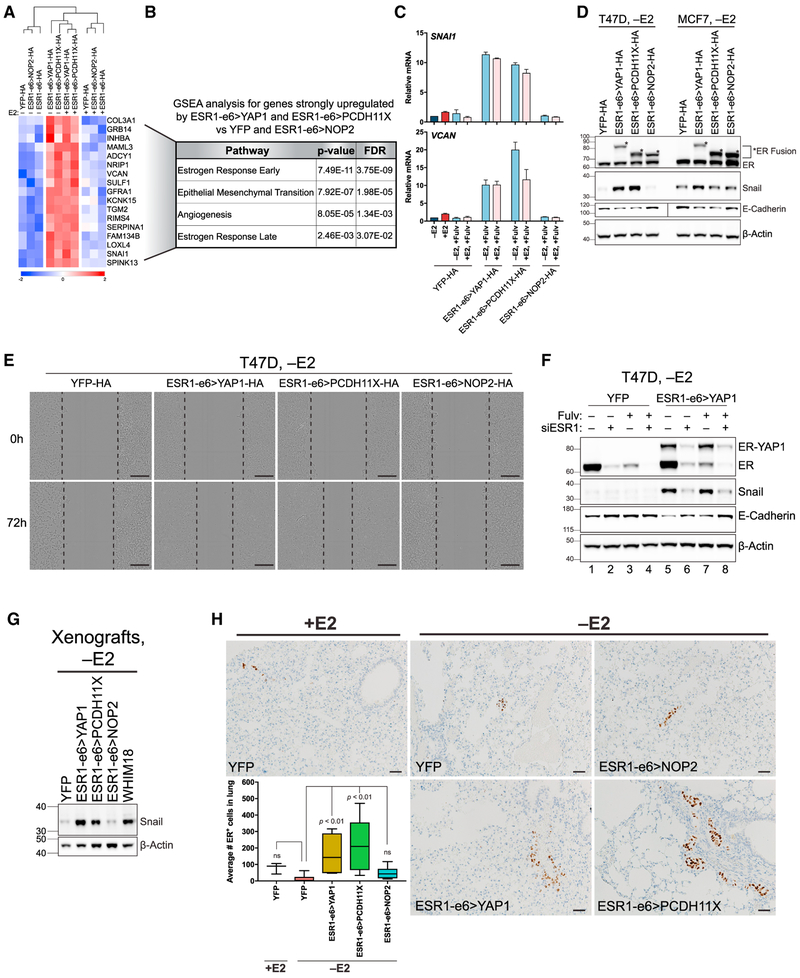
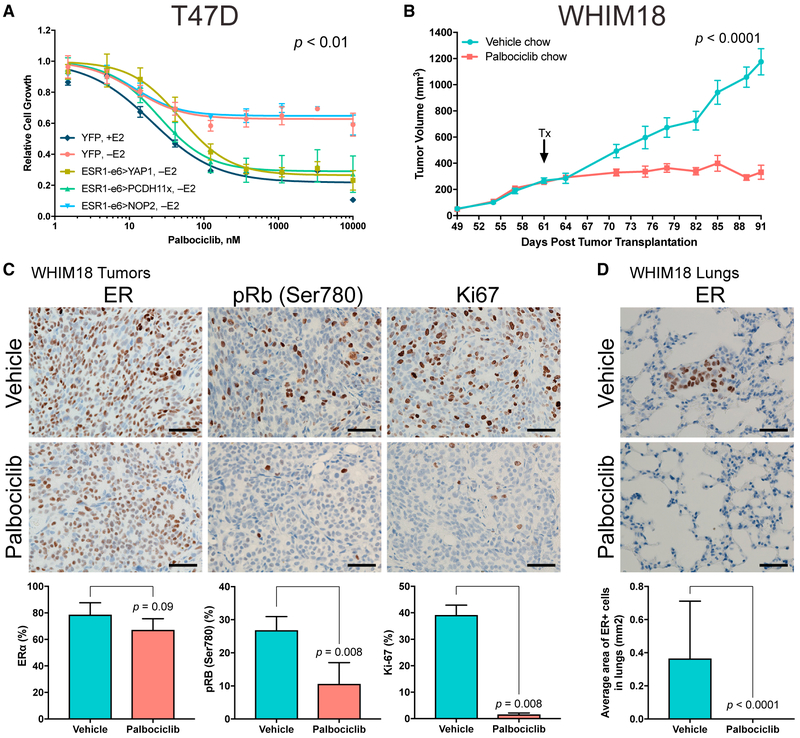
RNA sequencing (RNA-seq) detects estrogen receptor alpha gene (ESR1) fusion transcripts in estrogen receptor-positive (ER+) breast cancer, but their role in disease pathogenesis remains unclear. We examined multiple ESR1 fusions and found that two, both identified in advanced endocrine treatment-resistant disease, encoded stable and functional fusion proteins. In both examples, ESR1-e6>YAP1 and ESR1-e6>PCDH11X, ESR1 exons 1-6 were fused in frame to C-terminal sequences from the partner gene. Functional properties include estrogen-independent growth, constitutive expression of ER target genes, and anti-estrogen resistance. Both fusions activate a metastasis-associated transcriptional program, induce cellular motility, and promote the development of lung metastasis. ESR1-e6>YAP1- and ESR1-e6>PCDH11X-induced growth remained sensitive to a CDK4/6 inhibitor, and a patient-derived xenograft (PDX) naturally expressing the ESR1-e6>YAP1 fusion was also responsive. Transcriptionally active ESR1 fusions therefore trigger both endocrine therapy resistance and metastatic progression, explaining the association with fatal disease progression, although CDK4/6 inhibitor treatment is predicted to be effective.

Keywords: EMT; ESR1 fusions; PDX; breast cancer; endocrine therapy resistance; metastasis.


Figures

Figure 1.
Figure 1.. Identification and Verification of ESR1 Fusions
(A) Circos plot depicting ESR1 fusion events from Table S1. In-frame ESR1 fusions are depicted with a red line, and out-of-frame ESR1 fusions depicted with a blue line. Asterisks denote PCR-validated transcripts (Figure S1). (B)Of eight ESR1 fusions identified in (A) that were PCR validated, only three ESR1 fusions produced stable, in-frame proteins (indicated in red): ESR1-e6>YAP1, ESR1-e6>PCDH11X, and ESR1-e6>NOP2. Illustration depicting in-frame ESR1 fusions with ESR1 codon structure shown at the bottom. Non-coding exons (e) 1 and 2 are shown as white boxes, and gray boxes depict exons encoding domains shown above. Vertical line indicates shared break points after exon 6 of ESR1. All depicted fusions retain exons encoding amino acids (aa) 1–365 of ER corresponding to the activation function 1 (AF1) domain, DNA-binding domain (DBD), the hinge region that includes the nuclear localization domain, and part of the activation function 2 (AF2)/ligand-binding domain (LBD). (C)RNA-seq determined rank-ordered expression of YAP1, PCDH11X, and NOP2 from 728 TCGA breast tumor samples, shown as colored circles according to subtype. Triangles indicate ranked expression from indicated ESR1 fusion containing sample among the TCGA breast samples. See also Figure S1.
Figure 2.
Figure 2.. In-Frame ESR1 Fusions from Endocrine-Refractory Disease Confer Estrogen-Independent and Fulvestrant-Resistant Growth of ER+ Breast Cancer Cells
(A) RNA-seq mapped read depth was calculated across YAP1, PCDH11X, and NOP2 genes in corresponding fusion containing tumors. Red line indicates fusion breakpoints. (B) Immunoblotting with an N-terminal ER antibody in hormone-deprived stable T47D and WHIM18 PDX. Asterisks indicate ER fusion. (C) Cell proliferation studies of hormone-deprived stable T47D cells (−E2), after fulvestrant treatment (−E2, +Fulvestrant), after E2 stimulation (+E2), or after E2 stimulation with fulvestrant treatment (+E2, +Fulvestrant). Bar graphs show average ± SEM from three independent experiments. ****p < 0.0001 and ####p < 0.0001 as described in STAR Methods. (D) Box and whisker plots show tumor volumes of T47D xenograft tumors grown with (+E2) or without E2 supplementation (−E2). Boxes depict interquartile range, center line represents median, and whiskers extend to minimum and maximum values for each group (n = 6). p values show significance comparing YFP −E2 to all other groups. See also Figure S2.
Figure 3.
Figure 3.. Active ESR1 Fusions Promote Estrogen-Independent Expression of Target Genes
(A) Venn diagram depicting overlap of binding sites from hormone-deprived stable T47D cells expressing HA-tagged ESR1 constructs identified by HA-ChIP-seq. (B) HA-ChIP followed by qPCR for ER-binding regions of ER-responsive genes and negative ER-binding region. Bar graphs show average values from three experiments ± SEM. Asterisks denote significant differences as described in STAR Methods. (C) Heatmap showing differentially expressed genes near 445 sites bound by ESR1-e6>YAP1, ESR1-e6>PCDH11X, and ESR1-WT identified in (A). Known ER-responsive genes are indicated (CTSD, GREB1, PGR, TFF1, and PDZK1). Scale bar indicates row Z score. (D) Bar graphs depicting relative fold changes of estrogen-responsive genes whose ER-binding regions were examined in (B) from hormone-deprived stable T47D cells, normalized to YFP −E2 (dark blue bar), after E2 addition (+E2, red bar), or in combination with fulvestrant (light blue and pink bars). −E2 and +E2 for ESR1 fusion-expressing cells have been omitted for clarity; see Figure S3F for complete data. Data are shown as averages from two independent experiments ± SEM. See also Figure S3.
Figure 4.
Figure 4.. Active ESR1 Fusions Promote Metastasis by Upregulating an EMT-like Transcriptional Program
(A) Heatmap depicting genes upregulated by ESR1-e6>YAP1 and ESR1-e6>PCDH11X versus YFP and ESR1-e6>NOP2 (from bottom of Figure 3C). Scale bar indicates row Z score. (B) GSEA using genes identified in (A). (C) Bar graphs depicting expression of SNAI1 and VCAN, by mRNA-qPCR in hormone-deprived stable T47D cells (−E2). Values are normalized to YFP −E2 (dark blue bar), treated with E2 (+E2, red bar), and in combination with fulvestrant (light blue and pink bars). −E2 and +E2 conditions for all cell lines are shown in Figure S4B. Data are averages of two independent experiments ± SEM. (D) Immunoblotting for endogenous ER (ER) and ER fusion (asterisks) using an N-terminal ERα antibody, Snail, and E-cadherin in hormone-deprived stable T47D and MCF7 cells. Vertical line in E-cadherin blot indicates different exposures taken for T47D and MCF7. (E) Scratch wound healing assay images of hormone-deprived stable T47D at 0 and 72 hr post-wounding. Dotted black line indicates leading edge of cells. Scale bar, 300 μm. (F) Immunoblotting of hormone-deprived T47D cells pre-treated with vehicle (Fulv−) or fulvestrant (Fulv+) before transfecting negative control siRNA (siRNA−) or siRNA against the N terminus of ESR1 (siESR1+). (G) Immunoblotting for Snail in T47D xenograft and WHIM18 PDX tumors. (H) ER IHC images performed on lungs of mice bearing T47D xenografted tumors from Figure 2D. Box and whiskers plots show IHC quantification of ER+ cells, with boxes depicting interquartile range, center line representing median value, and whiskers extending to minimum and maximum values for each group (n=5). p values indicate significance comparing YFP −E2 versus fusion-bearing groups or versus YFP +E2. Scale bar, 100 μm. See also Figure S4 and Table S3.
Figure 5.
Figure 5.. Growth Driven by ESR1 Fusions Can Be Suppressed with CDK4/6 Inhibitor Treatment
(A) Growth of hormone-deprived stable T47D cells in response to increasing concentrations of a CDK4/6 inhibitor, palbociclib. YFP +E2 used as control. P value describes significance between YFP +E2, ESR1-e6>YAP1, and ESR1-e6>PCDH11x slopes compared with YFP −E2. Data shown are averages of three independent experiments ± SEM. (B) Tumor volumes of WHIM18 PDX in the absence of exogenous E2 supplementation. Arrow indicates treatment start (Tx) with vehicle or palbociclib containing chow. P value describes significance of tumor growth rates (slopes) derived from tumor volumes at day of randomization to experiment end. Data are shown as averages from 8–11 mice per treatment group ± SEM. (C) Representative IHC images for ER, pRb, and Ki-67 from vehicle and palbociclib-treated WHIM18 tumors. Quantification of IHC staining below with significance comparing treatment groups. Data are averages counts from five tumor sections from each treatment group, with error bars representing SD. (D) ER IHC images of lungs from WHIM18-bearing mice. Micrometastatic ER+ lesions were quantified by measuring area of ER+ cells. Data are shown as average ER+ areas from five lung sections per treatment group. P value determined as in (C). Scale bar, 100 μm in (C) and (D). See also Figure S5.

References

    1. Bailey TL, and Elkan C (1994). Fitting a mixture model by expectation maximization to discover motifs in biopolymers. Proc. Int. Conf. Intell. Syst. Mol. Biol 2, 28–36. - PubMed
    1. Carroll JS, Meyer CA, Song J, Li W, Geistlinger TR, Eeckhoute J, Brodsky AS, Keeton EK, Fertuck KC, Hall GF, et al. (2006). Genome-wide analysis of estrogen receptor binding sites. Nat. Genet 38, 1289–1297. - PubMed
    1. Ciriello G, Gatza ML, Beck AH, Wilkerson MD, Rhie SK, Pastore A, Zhang H, McLellan M, Yau C, Kandoth C, et al.; TCGA Research Network (2015). Comprehensive molecular portraits of invasive lobular breast cancer. Cell 163, 506–519. - PMC - PubMed
    1. Ellis MJ, Suman VJ, Hoog J, Lin L, Snider J, Prat A, Parker JS, Luo J, DeSchryver K, Allred DC, et al. (2011). Randomized phase II neoadjuvant comparison between letrozole, anastrozole, and exemestane for postmenopausal women with estrogen receptor-rich stage 2 to 3 breast cancer: clinical and biomarker outcomes and predictive value of the baseline PAM50-based intrinsic subtype—ACOSOG Z1031. J. Clin. Oncol 29, 2342–2349. - PMC - PubMed
    1. Ellis MJ, Ding L, Shen D, Luo J, Suman VJ, Wallis JW, Van Tine BA, Hoog J, Goiffon RJ, Goldstein TC, et al. (2012). Whole-genome analysis informs breast cancer response to aromatase inhibition. Nature 486,353–360. - PMC - PubMed

Publication types

Substances