. 2018;18(4):173-190.
doi: 10.1159/000488780. Epub 2018 Aug 8.

Estimating the Evolution of Disease in the Parkinson's Progression Markers Initiative

Affiliations

Estimating the Evolution of Disease in the Parkinson's Progression Markers Initiative

Samuel Iddi et al. Neurodegener Dis. 2018.

Abstract

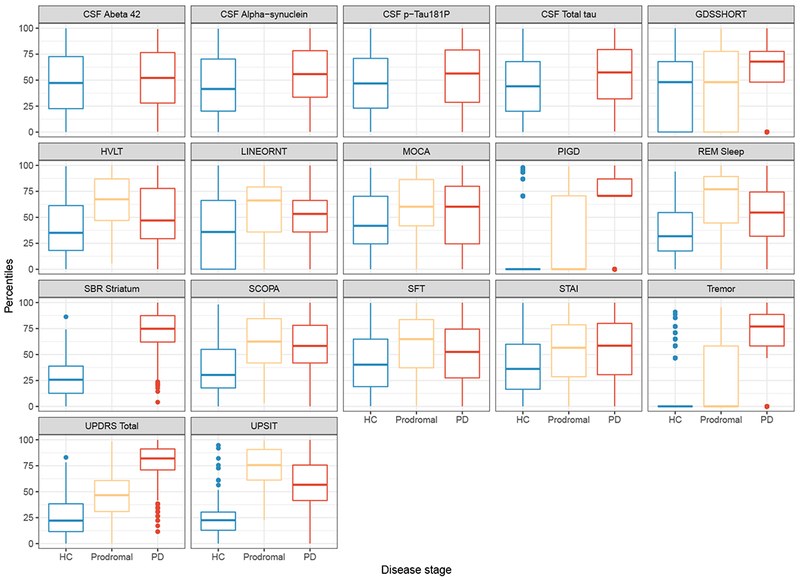
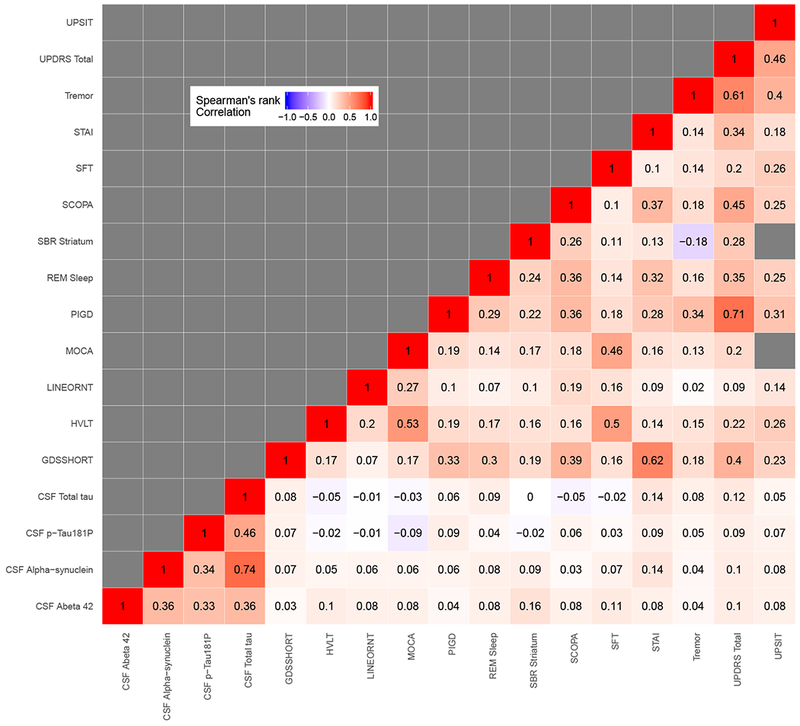
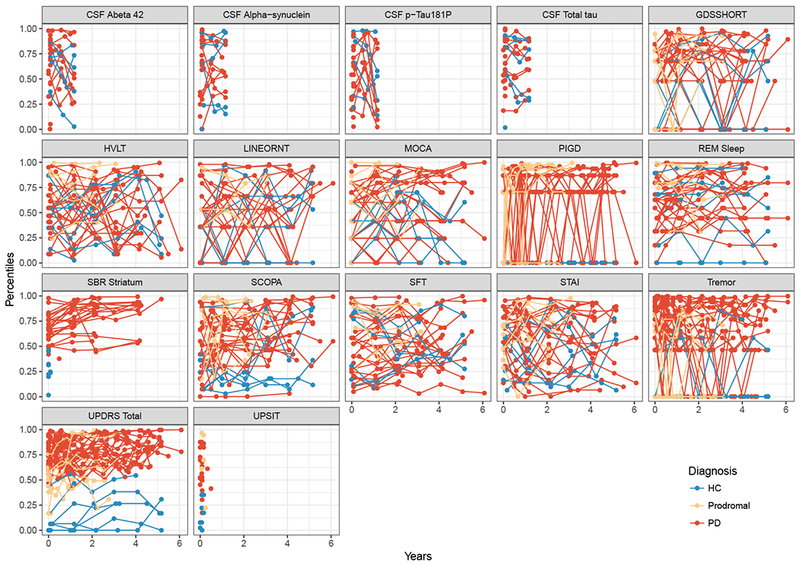
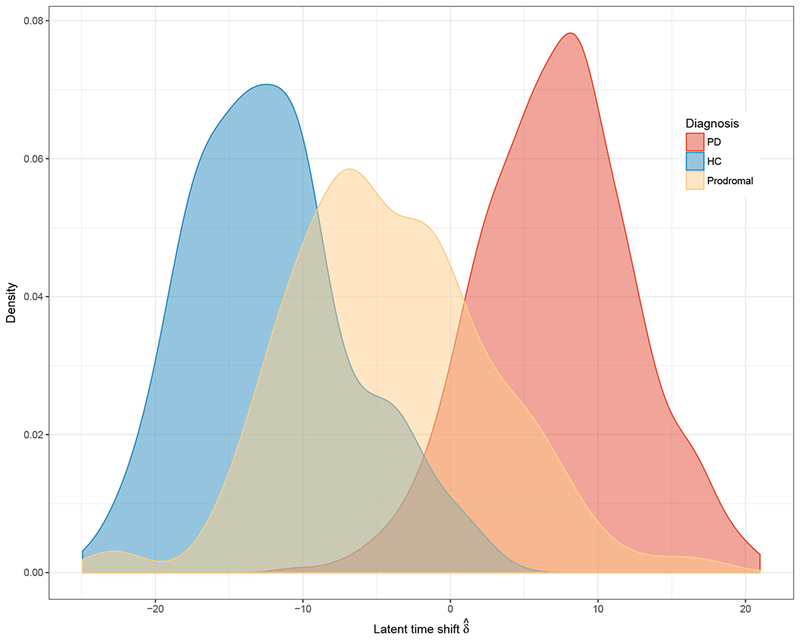
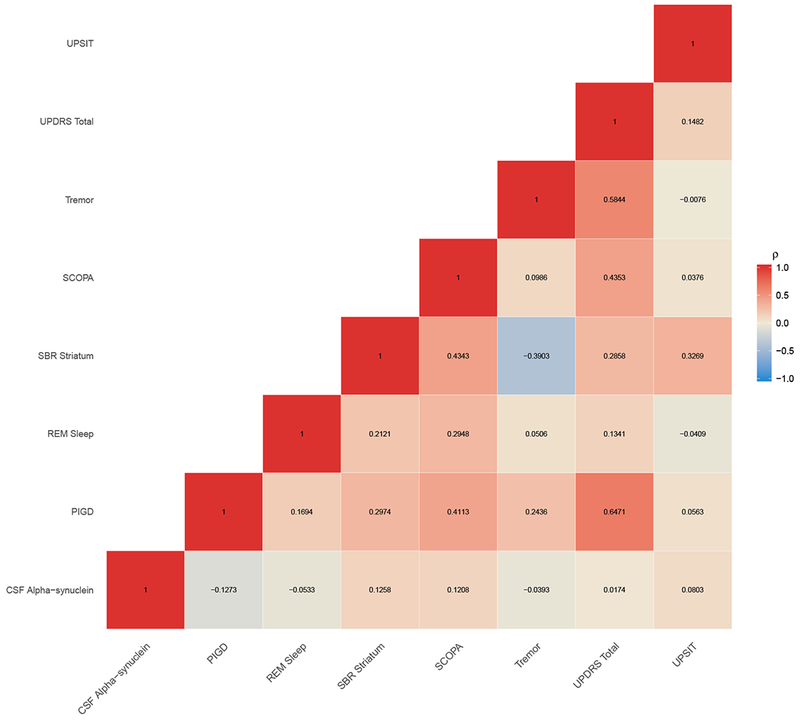
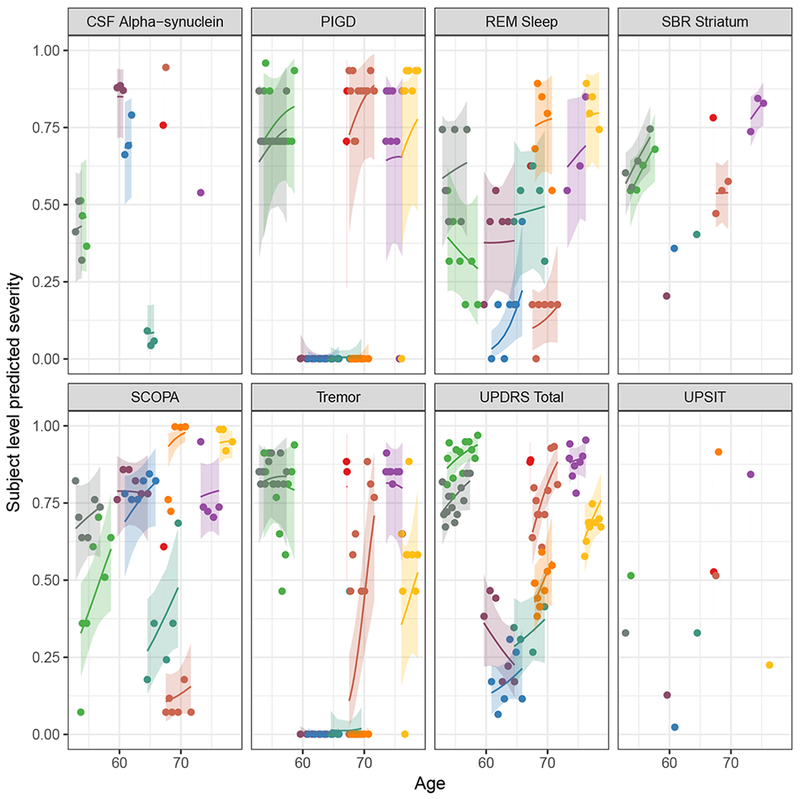
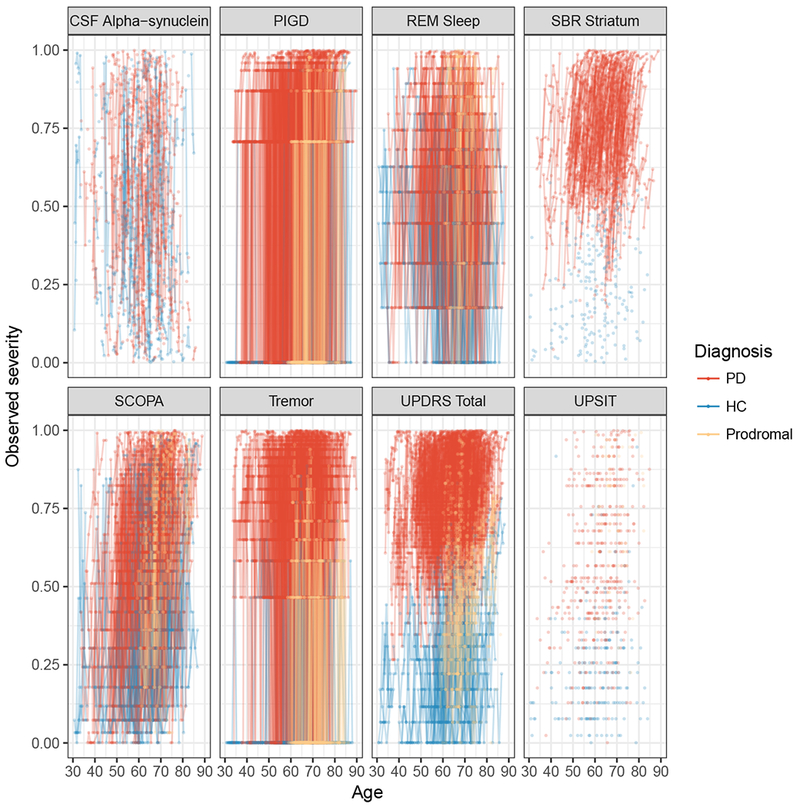
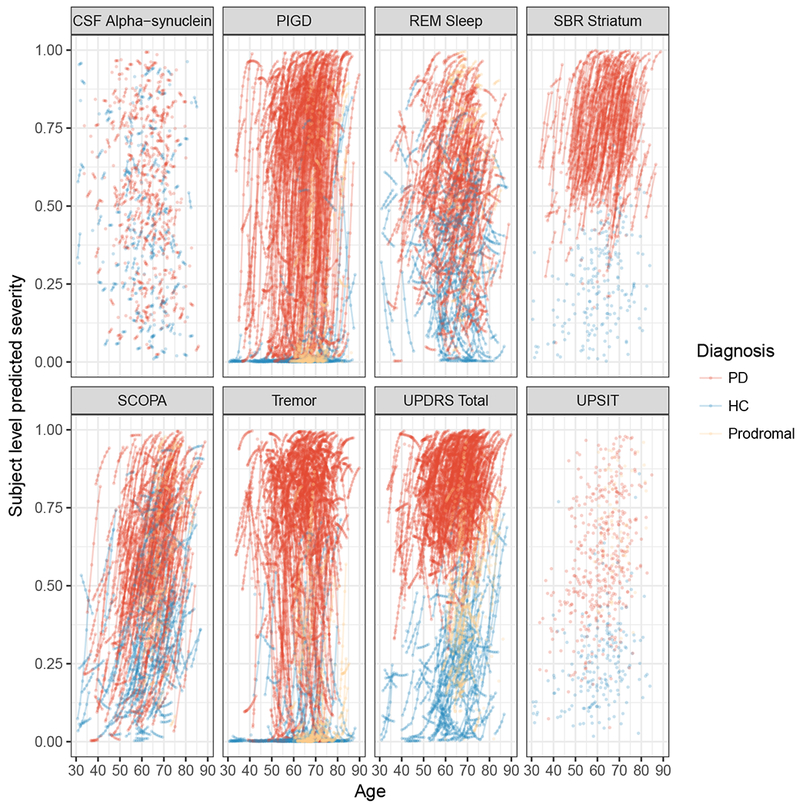
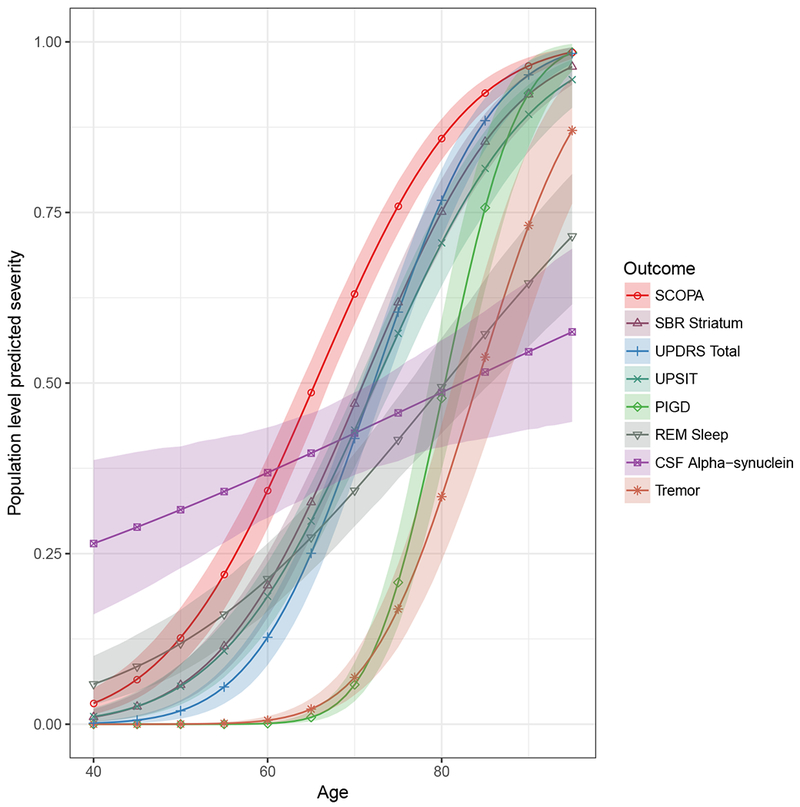
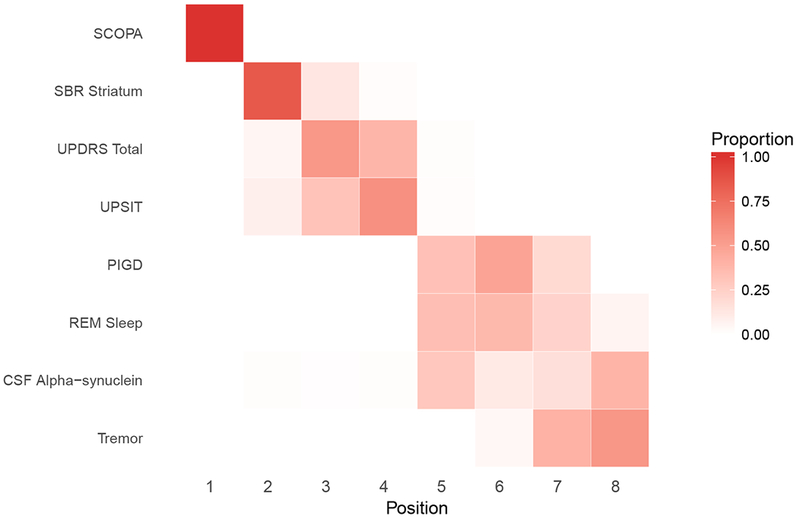
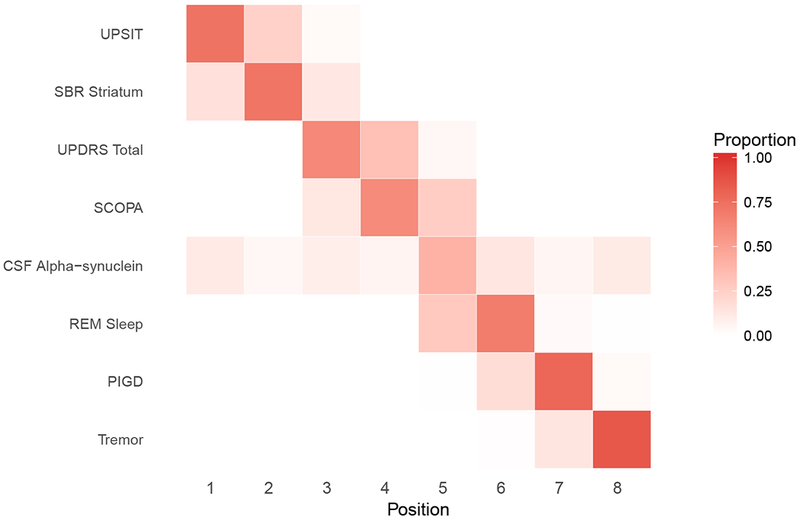
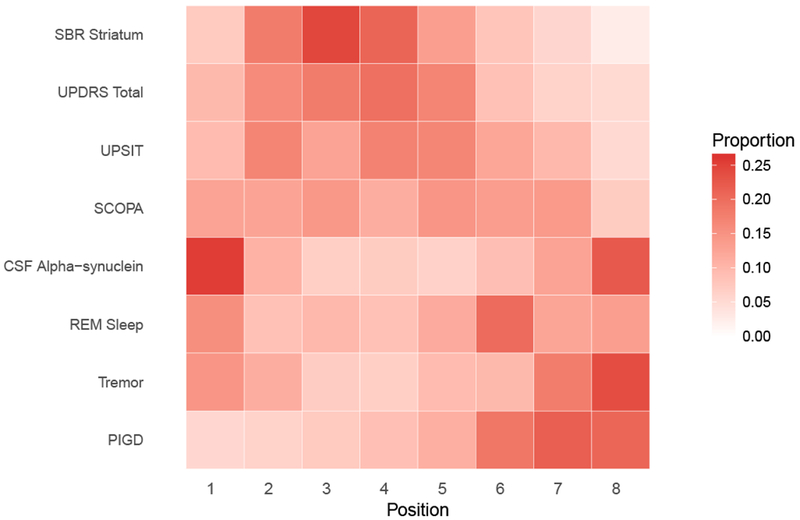
Parkinson's disease is the second most common neurological disease and affects about 1% of persons over the age of 60 years. Due to the lack of approved surrogate markers, confirmation of the disease still requires postmortem examination. Identifying and validating biomarkers are essential steps toward improving clinical diagnosis and accelerating the search for therapeutic drugs to ameliorate disease symptoms. Until recently, statistical analysis of multicohort longitudinal studies of neurodegenerative diseases has usually been restricted to a single analysis per outcome with simple comparisons between diagnostic groups. However, an important methodological consideration is to allow the modeling framework to handle multiple outcomes simultaneously and consider the transitions between diagnostic groups. This enables researchers to monitor multiple trajectories, correctly account for the correlation among biomarkers, and assess how these associations may jointly change over the long-term course of disease. In this study, we apply a latent time joint mixed-effects model to study biomarker progression and disease dynamics in the Parkinson's Progression Markers Initiative (PPMI) and examine which markers might be most informative in the earliest phases of disease. The results reveal that, even though diagnostic category was not included in the model, it seems to accurately reflect the temporal ordering of the disease state consistent with diagnosis categorization at baseline. In addition, results indicated that the specific binding ratio on striatum and the total Unified Parkinson's Disease Rating Scale (UPDRS) show high discriminability between disease stages. An extended latent time joint mixed-effects model with heterogeneous latent time variance also showed improvement in model fit in a simulation study and when applied to real data.

Keywords: Biomarkers; Clinical diagnosis; Disease trajectories; Joint mixed-effects models; Latent time shift; Multicohort longitudinal data; Multilevel Bayesian models; Parkinson’s disease.


Conflict of interest statement

Conflict of Interest

None declared.

Figures

Figure 1:
Figure 1:
(a) Box-plot (b) Correlation matrix Box-plot and Correlation Matrix: The left panel shows box-plots of the observed quantiles of each outcome by disease category. The right panel shows Spearman’s correlation between the outcomes. Abbreviations: PIGD, Posture Instability and Gait Difficulty; RBD, REM sleep behavior disorder; UPSIT, University of Pennsylvania Smell Identification Test; MOCA, Montreal Cognitive Assessment; HVLT, Hopkins Verbal Learning Test; GDS, Geriatric Depression Scale; SFT, Semantic Fluency Test; SCOPA, Scale for Outcomes in Parkinson’s; LINEORT, Line Orientation Test; UPDRS, Unified Parkinson Disease Rating Scale; STAI, State Trait Anxiety Index; PD, Parkinson Disease; HC, Healthy Control.
Figure 1:
Figure 1:
(a) Box-plot (b) Correlation matrix Box-plot and Correlation Matrix: The left panel shows box-plots of the observed quantiles of each outcome by disease category. The right panel shows Spearman’s correlation between the outcomes. Abbreviations: PIGD, Posture Instability and Gait Difficulty; RBD, REM sleep behavior disorder; UPSIT, University of Pennsylvania Smell Identification Test; MOCA, Montreal Cognitive Assessment; HVLT, Hopkins Verbal Learning Test; GDS, Geriatric Depression Scale; SFT, Semantic Fluency Test; SCOPA, Scale for Outcomes in Parkinson’s; LINEORT, Line Orientation Test; UPDRS, Unified Parkinson Disease Rating Scale; STAI, State Trait Anxiety Index; PD, Parkinson Disease; HC, Healthy Control.
Figure 2:
Figure 2:
Observed subject-specific profile showing the profiles for 50 randomly selected subjects per out-come and by disease category. Abbreviations: PIGD, Posture Instability and Gait Difficulty; RBD, REM sleep behavior disorder; UPSIT, University of Pennsylvania Smell Identification Test; MOCA, Montreal Cognitive Assessment; HVLT, Hopkins Verbal Learning Test; GDS, Geriatric Depression Scale; SFT, Semantic Fluency Test; SCOPA, Scale for Outcomes in Parkinson’s; LINEORT, Line Orientation Test; UPDRS, Unified Parkinson Disease Rating Scale; STAI, State Trait Anxiety Index; PD, Parkinson Disease; HC, Healthy Control.
Figure 3:
Figure 3:
Distribution of estimate of time shift, δ^ι by disease status. Abbreviations: PD, Parkinson’s Disease; HC, Healthy Control.
Figure 4:
Figure 4:
Correlation between random slopes for pair of outcomes. Abbreviations: PIGD, Posture Instability and Gait Difficulty; RBD, REM sleep behavior disorder; UPSIT, University of Pennsylvania Smell Identification Test; SCOPA, Scale for Outcomes in Parkinson’s; UPDRS, Unified Parkinson Disease Rating Scale; PD, Parkinson Disease; HC, Healthy Control.
Figure 5:
Figure 5:
Subject-level prediction for random subjects. Each color represents the predicted profile of a randomly selected individual. Abbreviations: PIGD, Posture Instability and Gait Difficulty; REM Sleep, Rapid Eye Movement Sleep behavior disorder; UPSIT, University of Pennsylvania Smell Identification Test; SCOPA, Scale for Outcomes in Parkinson’s; UPDRS, Unified Parkinson Disease Rating Scale; PD, Parkinson Disease; HC, Healthy Control.
Figure 6:
Figure 6:
(a) Observed severity (b) Subject-level predicted severity The left panel shows observed trajectories. The right panel shows the predicted profile for all subjects by outcome. Abbreviations: PIGD, Posture Instability and Gait Difficulty; REM Sleep, Rapid Eye Movement Sleep behavior disorder; UPSIT, University of Pennsylvania Smell Identification Test; SCOPA, Scale for Outcomes in Parkinson’s; UPDRS, Unified Parkinson Disease Rating Scale; PD, Parkinson Disease; HC, Healthy Control.
Figure 6:
Figure 6:
(a) Observed severity (b) Subject-level predicted severity The left panel shows observed trajectories. The right panel shows the predicted profile for all subjects by outcome. Abbreviations: PIGD, Posture Instability and Gait Difficulty; REM Sleep, Rapid Eye Movement Sleep behavior disorder; UPSIT, University of Pennsylvania Smell Identification Test; SCOPA, Scale for Outcomes in Parkinson’s; UPDRS, Unified Parkinson Disease Rating Scale; PD, Parkinson Disease; HC, Healthy Control.
Figure 7:
Figure 7:
Population level predicted severity for female with mean age and median latent time of a healthy control. The legend is ordered by the age at which the predicted severity level for each outcome is 0.5 (sliced horizontally). Abbreviations: PIGD, Posture Instability and Gait Difficulty; REM Sleep, Rapid Eye Movement Sleep behavior disorder; UPSIT, University of Pennsylvania Smell Identification Test; SCOPA, Scale for Outcomes in Parkinson’s; UPDRS, Unified Parkinson Disease Rating.
Figure 8:
Figure 8:
(a) Female. (b) Male. Positional variance diagram of the central ordering. The x-axis is the event position. Difference in ordering may be attributed to the strong effect of gender on some of these outcomes. Abbreviations: PIGD, Posture Instability and Gait Difficulty; REM Sleep, Rapid Eye Movement Sleep behavior disorder; UPSIT, University of Pennsylvania Smell Identification Test; SCOPA, Scale for Outcomes in Parkinson’s; UPDRS, Unified Parkinson Disease Rating Scale; PD, Parkinson Disease; HC, Healthy Control.
Figure 8:
Figure 8:
(a) Female. (b) Male. Positional variance diagram of the central ordering. The x-axis is the event position. Difference in ordering may be attributed to the strong effect of gender on some of these outcomes. Abbreviations: PIGD, Posture Instability and Gait Difficulty; REM Sleep, Rapid Eye Movement Sleep behavior disorder; UPSIT, University of Pennsylvania Smell Identification Test; SCOPA, Scale for Outcomes in Parkinson’s; UPDRS, Unified Parkinson Disease Rating Scale; PD, Parkinson Disease; HC, Healthy Control.
Figure 9:
Figure 9:
Positional variance diagram of the central ordering. Abbreviations: PIGD, Posture Instability and Gait Difficulty; REM Sleep, Rapid Eye Movement Sleep behavior disorder; UPSIT, University of Pennsylvania Smell Identification Test; SCOPA, Scale for Outcomes in Parkinson’s; UPDRS, Unified Parkinson Disease Rating Scale; PD, Parkinson Disease; HC, Healthy Control.

References

    1. Brockmann K, Schulte C, Deuschle C, Hauser A-K, Heger T, Gasser T, Maetzler W, & Berg D (2015). Neurodegenerative CSF markers in genetic and sporadic PD: Classification and prediction in a longitudinal study. Parkinsonism and Related Disorders, 21, 1427–1434. - PubMed
    1. Guerrero R, Schmidt-Richbergh A, Ledig C, Tong T, Wolz R, & Rueckert D (2016). Instantiated mixed effects modeling of Alzheimer’s disease markers. NeuroImage, 142, 113–125. - PubMed
    1. Iddi S, & Molenberghs G (2012). A joint marginalized multilevel model for longitudinal outcomes. Journal of Applied Statistics, 39,24132430.
    1. Kennedy RE, Cutter GR, Wang G, & Schneider LS (2015). Using baseline cognitive severity for enriching Alzheimer’s disease clinical trials: How does mini-mental state examination predict rate of change? Alzheimer’s & Dementia: Translational Research & Clinical Interventions, 1,46–52. - PMC - PubMed
    1. Klotsche J, Reese JP, Winter Y, Oertel WH, Irving H, Wittchen H, Rehm J, & Dodel R (2011). Trajectory classes of decline in health-related quality of life in Parkinson’s disease: A pilot study. Value in Health, 14,329–338. - PubMed

Publication types