. 2018 Aug 8;19(1):295.
doi: 10.1186/s12859-018-2289-9.

PRS-on-Spark (PRSoS): a novel, efficient and flexible approach for generating polygenic risk scores

Affiliations

PRS-on-Spark (PRSoS): a novel, efficient and flexible approach for generating polygenic risk scores

Lawrence M Chen et al. BMC Bioinformatics. .

Abstract

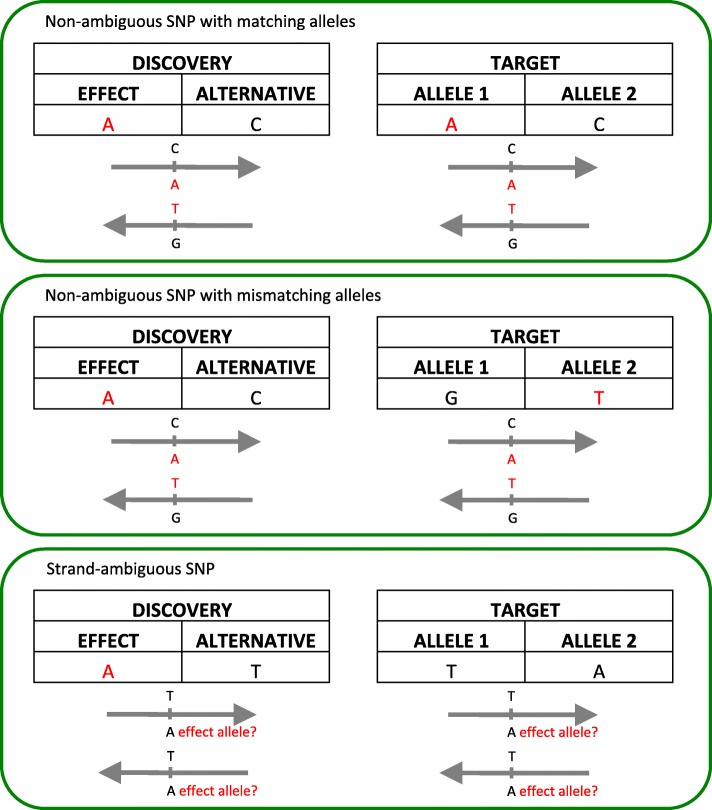
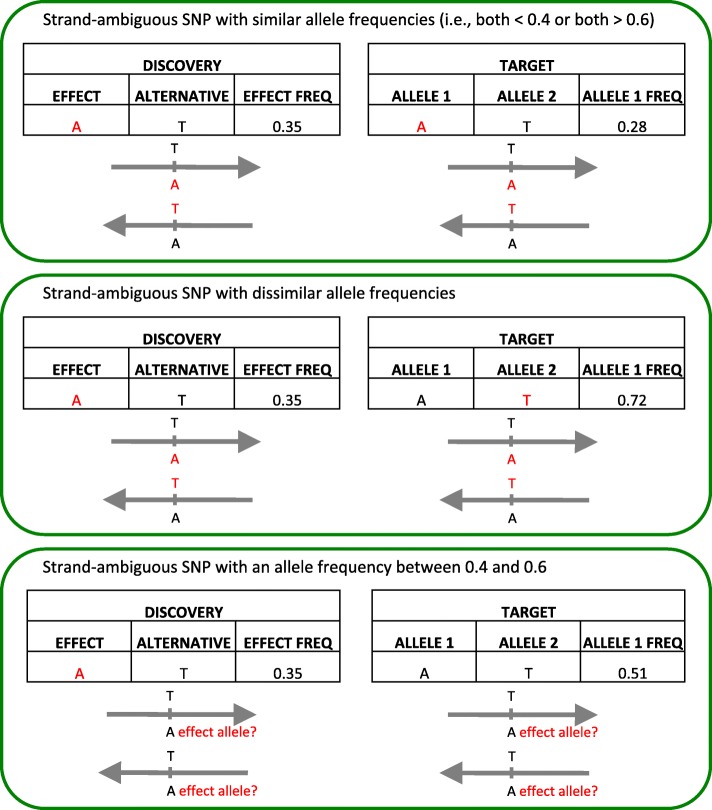
Background: Polygenic risk scores (PRS) describe the genomic contribution to complex phenotypes and consistently account for a larger proportion of variance in outcome than single nucleotide polymorphisms (SNPs) alone. However, there is little consensus on the optimal data input for generating PRS, and existing approaches largely preclude the use of imputed posterior probabilities and strand-ambiguous SNPs i.e., A/T or C/G polymorphisms. Our ability to predict complex traits that arise from the additive effects of a large number of SNPs would likely benefit from a more inclusive approach.

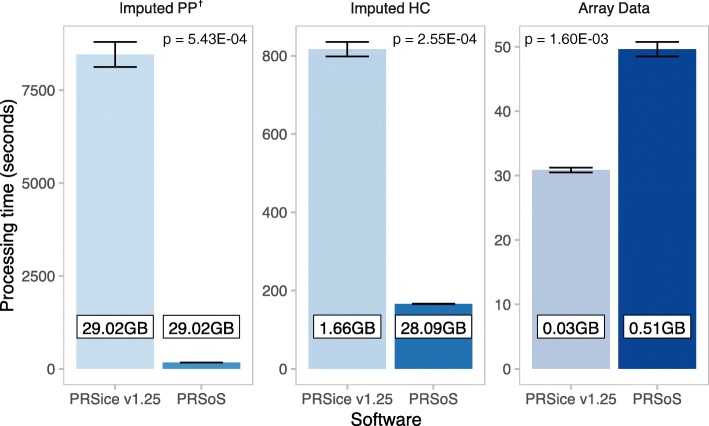
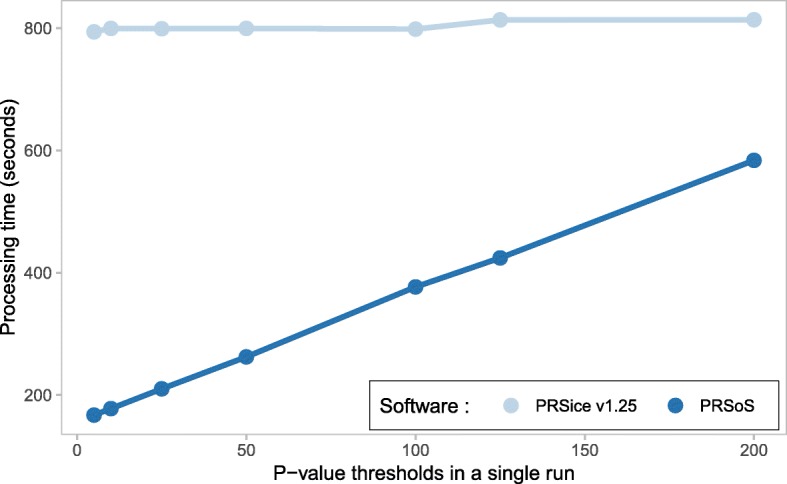
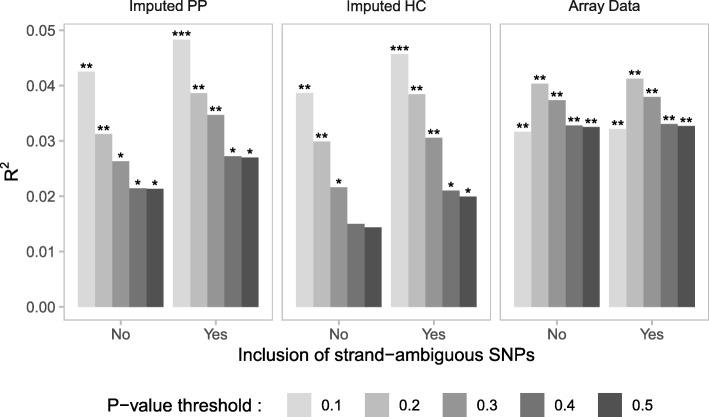
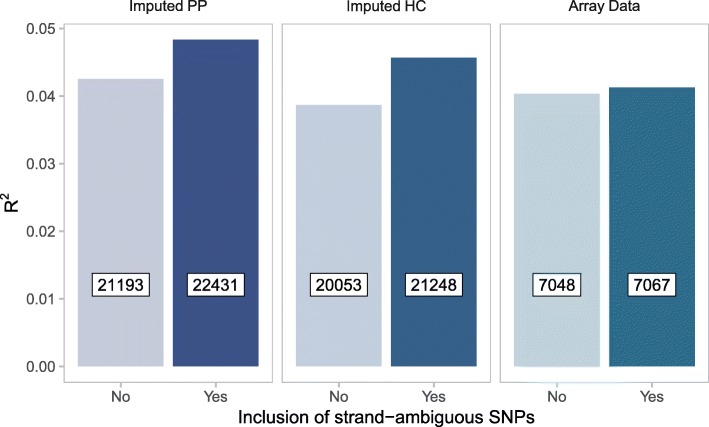
Results: We developed PRS-on-Spark (PRSoS), a software implemented in Apache Spark and Python that accommodates different data inputs and strand-ambiguous SNPs to calculate PRS. We compared performance between PRSoS and an existing software (PRSice v1.25) for generating PRS for major depressive disorder using a community cohort (N = 264). We found PRSoS to perform faster than PRSice v1.25 when PRS were generated for a large number of SNPs (~ 17 million SNPs; t = 42.865, p = 5.43E-04). We also show that the use of imputed posterior probabilities and the inclusion of strand-ambiguous SNPs increase the proportion of variance explained by a PRS for major depressive disorder (from 4.3% to 4.8%).

Conclusions: PRSoS provides the user with the ability to generate PRS using an inclusive and efficient approach that considers a larger number of SNPs than conventional approaches. We show that a PRS for major depressive disorder that includes strand-ambiguous SNPs, calculated using PRSoS, accounts for the largest proportion of variance in symptoms of depression in a community cohort, demonstrating the utility of this approach. The availability of this software will help users develop more informative PRS for a variety of complex phenotypes.

Keywords: Bioinformatics; Genetic profile score, Multi-core processing; Major depressive disorder; PRS-on-spark; PRSoS; Polygenic risk score.


Conflict of interest statement

Fully informed written consent was obtained from participants and ethical approval for this study obtained from the Comité d’éthique de la recherche at the Douglas Hospital Research Centre (Montreal, Canada).

Not applicable.

The authors declare that they have no competing interests.

Springer Nature remains neutral with regard to jurisdictional claims in published maps and institutional affiliations.

Figures

Fig. 1
Fig. 1
Allele matching for polygenic risk scores (PRS) between discovery and target data. The effect alleles and their reverse complements are indicated in red. Matching the effect alleles from the discovery data with the reported alleles in the target data is straightforward when SNPs are not strand-ambiguous (top and middle panel). The allele in the target data can be misassigned for strand-ambiguous SNPs (bottom)
Fig. 2
Fig. 2
PRSoS allele matching solution for strand-ambiguous SNPs. The effect alleles and their reverse complements are indicated in red. The discovery effect allele and the target allele 1 are the same if their allele frequencies are both less than 0.4 or both more than 0.6 (top). The target allele 1 is not the effect allele if one has low allele frequency and the other has high allele frequency (middle). Strand-ambiguous SNPs with an allele frequency between 0.4 and 0.6 are excluded to increase the certainty of matching alleles
Fig. 3
Fig. 3
PRSice v1.25 and PRSoS performance across datasets. Bar plot shows the results of the performance test comparing running PRSice v1.25 and PRSoS across the datasets. Error bars indicate standard deviations. Numbers in boxed inserts indicate the size of the genotype data input. Note that the file sizes used for the Imputed PP are same for PRSice v1.25 and PRSoS, thus illustrating the processing speed difference with same file size input. Imputed PP = imputed posterior probabilities, Imputed HC = imputed posterior probabilities converted to “hard calls”, Array Data = observed genotypes. Significance values derived from paired t-tests
Fig. 4
Fig. 4
PRSice v1.25 and PRSoS performance across increasing number of p-value thresholds. Line plot shows the results of the performance test comparing PRSice v1.25 and PRSoS across increasing number of p-value thresholds to construct in a single run using a dataset based on imputed posterior probabilities converted to “hard calls” (Imputed HC)
Fig. 5
Fig. 5
A PRS for major depressive disorder (MDD) predicts symptoms of depression. Bar plots show the proportion of variance explained by PRS for MDD in the prediction of symptoms of depression. PRS were calculated across three datasets including or excluding strand-ambiguous SNPs at a range of p-value thresholds (PT = 0.1, 0.2, 0.3, 0.4, and 0.5). *p < 0.05, **p < 0.01, ***p < 0.001. Imputed PP = imputed posterior probabilities, Imputed HC = imputed posterior probabilities converted to “hard calls”, Array Data = observed genotypes
Fig. 6
Fig. 6
Best-fit PRS model selection. Bar plots show the proportion of variance in depressive symptoms explained by PRS for major depressive disorder (MDD) as a function of dataset with and without strand-ambiguous SNPs. Only the best-fit models are shown (PT: Imputed PP = 0.1, Imputed HC = 0.1, Array Data = 0.2). Numbers in boxed inserts refer to the number of SNPs included in each PRS. Imputed PP = imputed posterior probabilities, Imputed HC = imputed posterior probabilities converted to “hard calls”, Array Data = observed genotypes

References

    1. Wray NR, Goddard ME, Visscher PM. Prediction of individual genetic risk to disease from genome-wide association studies. Genome Res. 2007;17:1520–1528. doi: 10.1101/gr.6665407. - DOI - PMC - PubMed
    1. Krapohl E, Euesden J, Zabaneh D, Pingault J-B, Rimfeld K, von Stumm S, et al. Phenome-wide analysis of genome-wide polygenic scores. Mol Psychiatry. 2016;21:1188–1193. doi: 10.1038/mp.2015.126. - DOI - PMC - PubMed
    1. Belsky DW, Moffitt TE, Houts R, Bennett GG, Biddle AK, Blumenthal JA, et al. Polygenic risk, rapid childhood growth, and the development of obesity. Arch Pediatr Adolesc Med. 2012;166:515–521. doi: 10.1001/archpediatrics.2012.131. - DOI - PMC - PubMed
    1. Cross-Disorder Group of the Psychiatric Genomics Consortium Identification of risk loci with shared effects on five major psychiatric disorders: a genome-wide analysis. Lancet. 2013;381:1371–1379. doi: 10.1016/S0140-6736(12)62129-1. - DOI - PMC - PubMed
    1. The International Schizophrenia Consortium Common polygenic variation contributes to risk of schizophrenia and bipolar disorder. Nature. 2009;10:8192. - PMC - PubMed

LinkOut - more resources