

Type 2 diabetes affects bone cells precursors and bone turnover
- PMID: 30089481
- PMCID: PMC6083573
- DOI: 10.1186/s12902-018-0283-x
Type 2 diabetes affects bone cells precursors and bone turnover
Abstract
Background: Here we study the effect of type 2 diabetes (T2DM) on bone cell precursors, turnover and cytokines involved in the control of bone cell formation and activity.
Methods: We enrolled in the study 21 T2DM women and 21 non diabetic controls matched for age and body mass index (BMI). In each subject we measured bone cell precursors, Receptor Activator of Nuclear Factor κB (RANKL), Osteoprotegerin (OPG), Sclerostin (SCL) and Dickoppf-1 (DKK-1) as cytokines involved in the control of osteoblast and osteoclast formation and activity, bone density (BMD) and quality trough trabecular bone score (TBS) and bone turnover. T2DM patients and controls were compared for the analyzed variables by one way ANOVA for Gaussian ones and by Mann-Whitney or Kruskal-Wallis test for non-Gaussian variables.
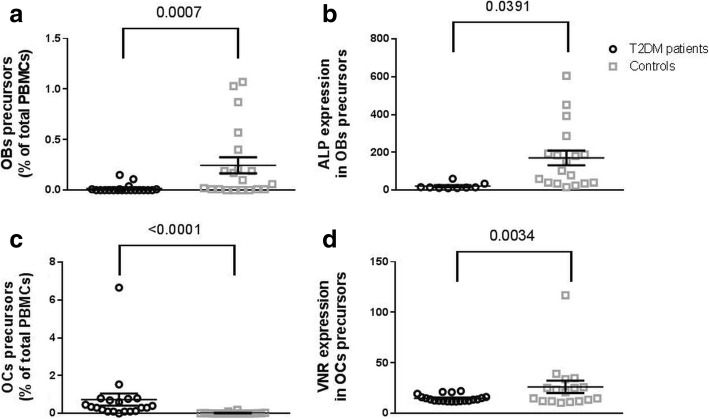
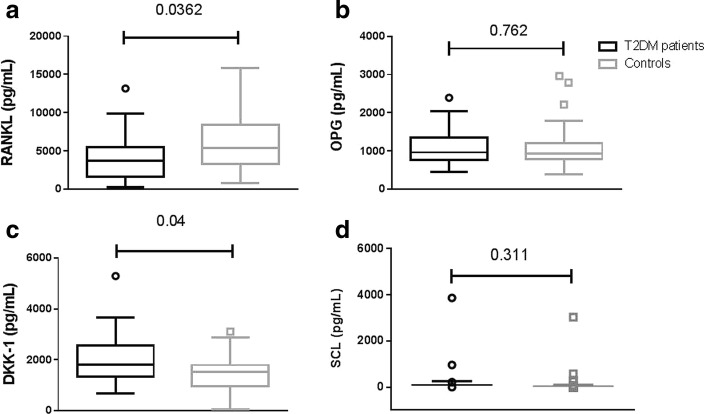
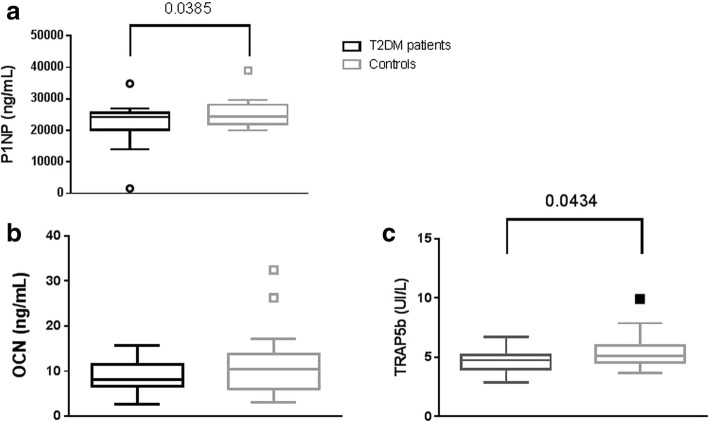
Results: RANKL was decreased and DKK-1 increased in T2DM. Accordingly, patients with T2DM have lower bone turnover compared to controls. BMD and TBS were not significantly different from healthy controls. Bone precursor cells were more immature in T2DM. However the number of osteoclast precursors was increased and that of osteoblasts decreased.
Conclusions: Patients with T2DM have more immature bone cells precursors, with increased number of osteoclasts and decreased osteoblasts, confirming low bone turnover and reduced cytokines such as RANKL and DKK-1. BMD and TBS are not significantly altered in T2DM although, in contrast with other studies, this may be due to the match of patients and controls for BMI rather than age.
Keywords: Bone density; Diabetes; Osteoblast; Osteoclast; Receptor activator of nuclear factor κB; Sclerostin.
Conflict of interest statement
The study was approved by the Ethics Committee of our Hospital (“Comitato Etico Interaziendale A.O.U. Città della Salute e della Scienza di Torino - A.O. Ordine Mauriziano - A.S.L. TO1”), in accordance with the ethical standards of the Declaration of Helsinki and its later amendments. Informed consent was obtained from all individual participants included in the study.
Not applicable.
The authors declare that they have no competing interests.
Springer Nature remains neutral with regard to jurisdictional claims in published maps and institutional affiliations.
Figures
References
MeSH terms
Substances
LinkOut - more resources
Full Text Sources
Other Literature Sources
Medical
Research Materials
Miscellaneous
