. 2018 Aug 9;3(15):e99292.
doi: 10.1172/jci.insight.99292.

Pyruvate dehydrogenase complex stimulation promotes immunometabolic homeostasis and sepsis survival

Affiliations

Pyruvate dehydrogenase complex stimulation promotes immunometabolic homeostasis and sepsis survival

Charles E McCall et al. JCI Insight. .

Abstract

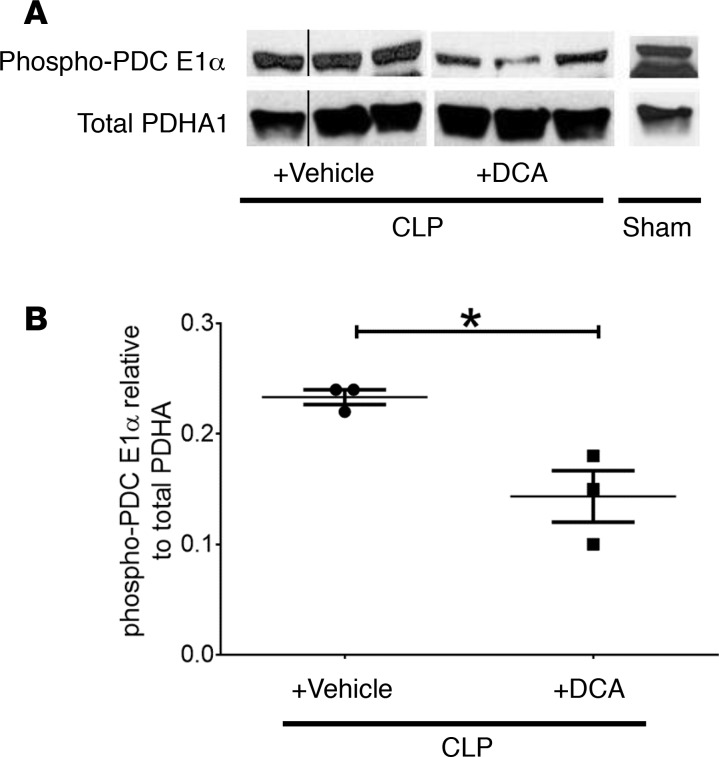
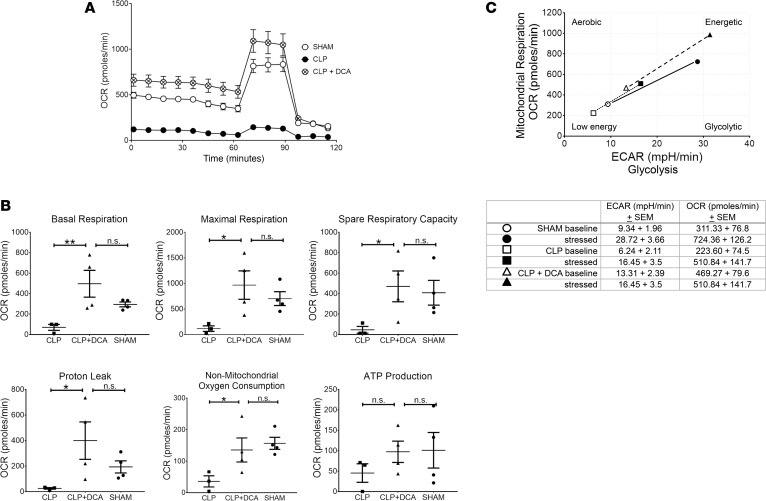
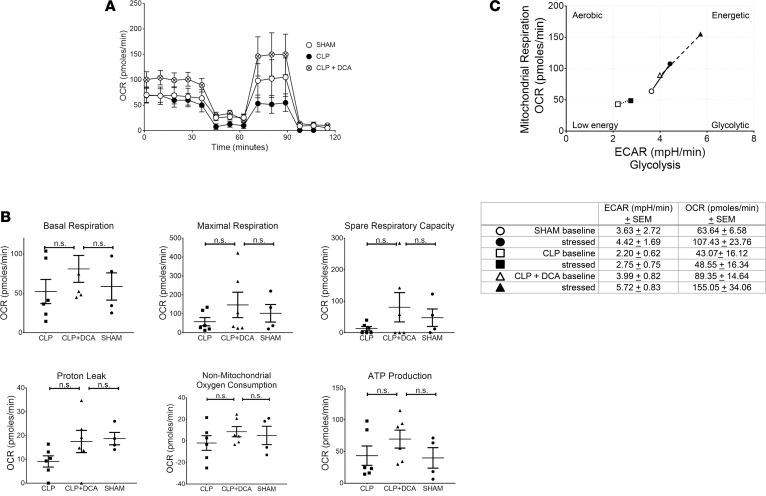
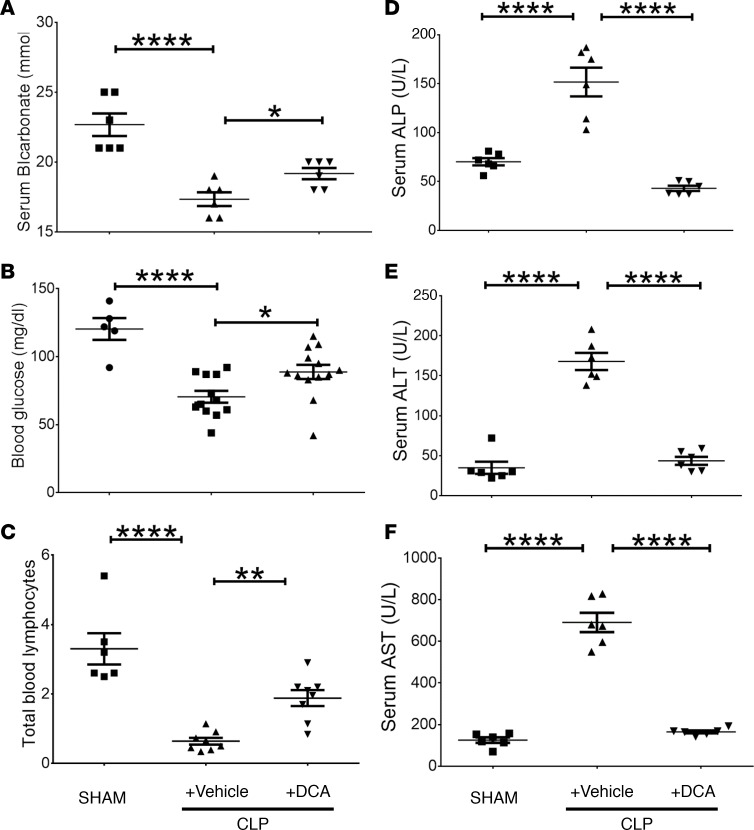
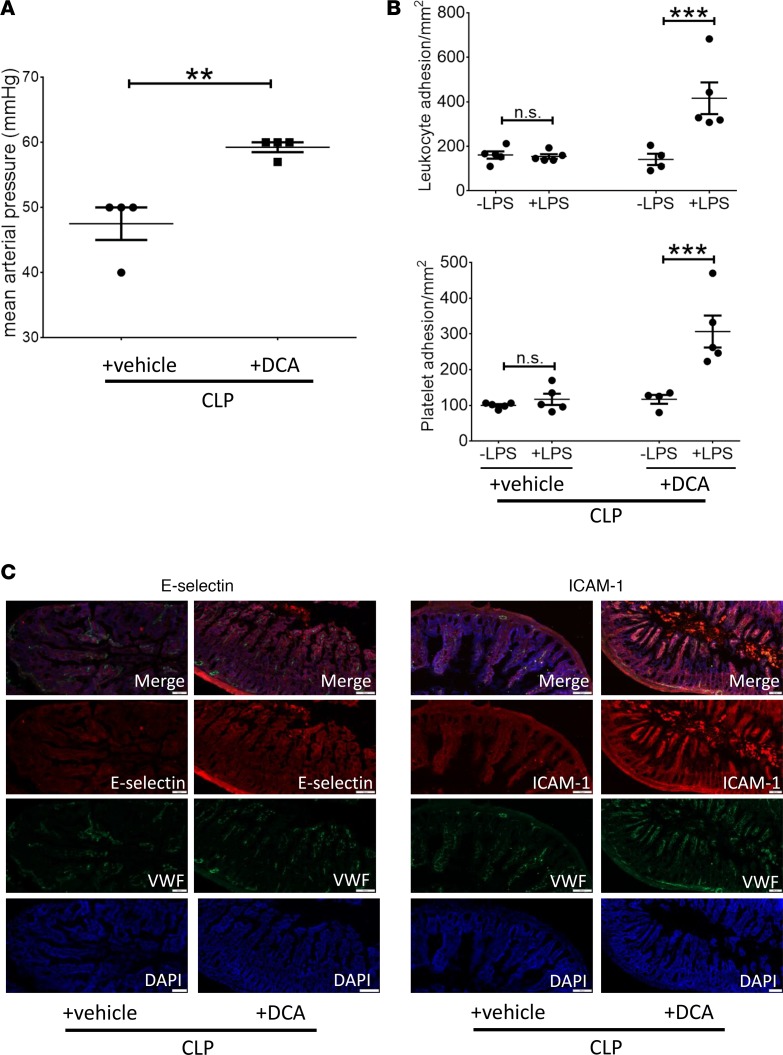
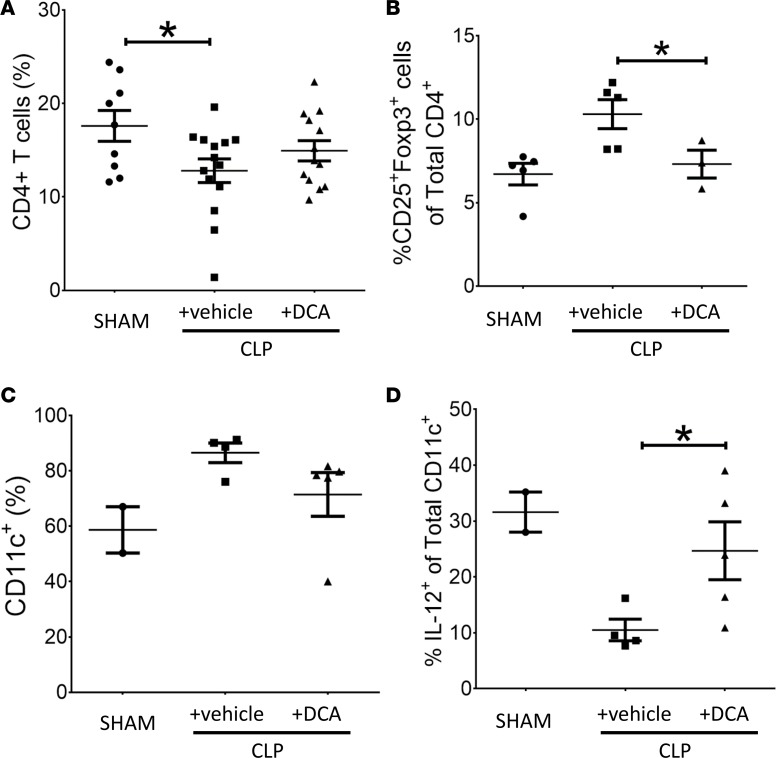
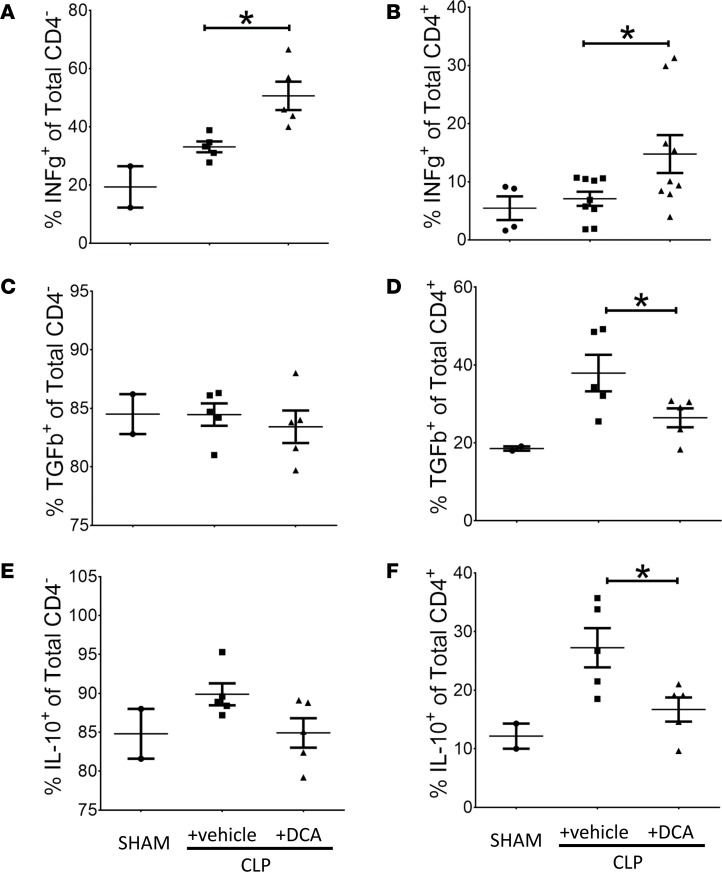
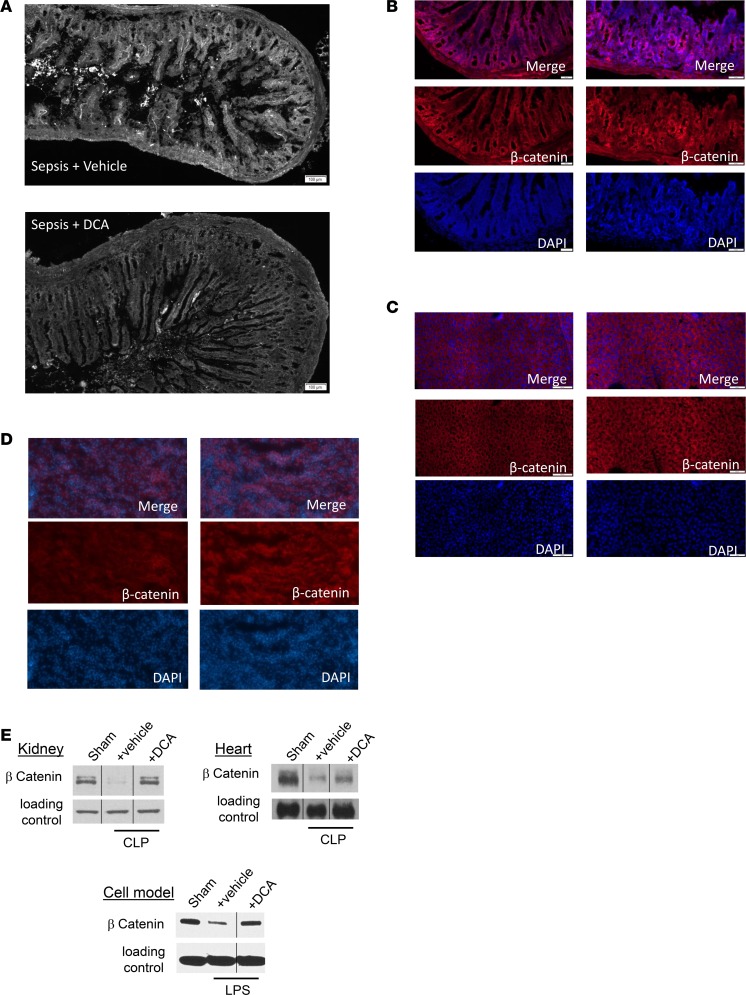
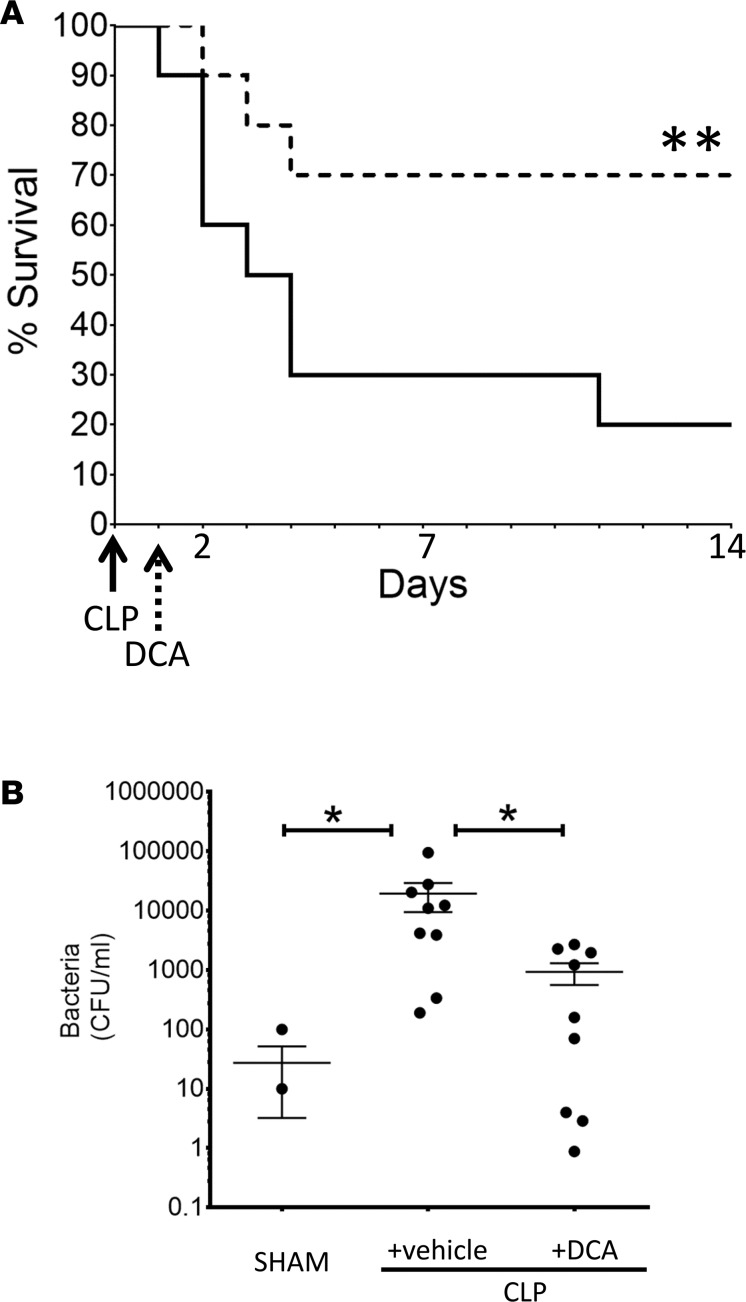
Limited understanding of the mechanisms responsible for life-threatening organ and immune failure hampers scientists' ability to design sepsis treatments. Pyruvate dehydrogenase kinase 1 (PDK1) is persistently expressed in immune-tolerant monocytes of septic mice and humans and deactivates mitochondrial pyruvate dehydrogenase complex (PDC), the gate-keeping enzyme for glucose oxidation. Here, we show that targeting PDK with its prototypic inhibitor dichloroacetate (DCA) reactivates PDC; increases mitochondrial oxidative bioenergetics in isolated hepatocytes and splenocytes; promotes vascular, immune, and organ homeostasis; accelerates bacterial clearance; and increases survival. These results indicate that the PDC/PDK axis is a druggable mitochondrial target for promoting immunometabolic and organ homeostasis during sepsis.

Keywords: Glucose metabolism; Homeostasis; Immunology; Infectious disease; Mitochondria.


Conflict of interest statement

Conflict of interest: The authors have declared that no conflict of interest exists.

Figures

Figure 1
Figure 1. Dichloroacetate (DCA) treatment activates pyruvate dehydrogenase complex (PDC).
(A and B) DCA represses phosphorylation at deactivating serine sites on PDC. Homogenized liver tissue obtained from SHAM, cecal ligation and puncture (CLP)+ DCA, and CLP+ vehicle was probed with a mixture of anti–phospho-S232 and S300 antibodies to PDC E1α rate-limiting component for acetyl Co-A generation using Western blot. Anti–phospho-S232 and S300 on PDC in the CLP+ DCA group were significantly reduced vs. CLP+ vehicle. Western blot signals were quantified using ImageJ. Unpaired t test determined significance. *P < 0.05.
Figure 2
Figure 2. Dichloroacetate (DCA) effects on isolated hepatocyte mitochondrial bioenergetics.
Mitochondrial bioenergetics at 6 hours after DCA or vehicle administered 24 hours after cecal ligation and puncture (CLP) compared with SHAM were assessed using Seahorse XF24. A shows Seahorse tracing averaging oxygen consumption rate (OCR) values from SHAM, CLP (plus vehicle; denoted as CLP), and CLP+ DCA groups. B displays bar graphs of basal and maximum respiration, spare respiratory capacity, proton leak, nonmitochondrial oxygen consumption, and ATP production. Isolated hepatocytes from the CLP+ DCA group showed significantly increased basal and maximum respiration, spare respiratory capacity, proton leak, and nonmitochondrial oxygen consumption compared with CLP, and they were not significantly different compared with SHAM counterparts. Similarly, the energy index in CLP+ DCA group was well above that of CLP alone and SHAM groups (C). n = 4 for CLP+ DCA treatment, n = 3 for CLP, n = 4 for SHAM. Results were assessed by 1-way ANOVA and Sidak’s post hoc test. *P < 0.05; **P < 0.01. Extracellular acidification rate, ECAR.
Figure 3
Figure 3. Dichloroacetate (DCA) treatment increases mitochondrial respiration and improves the metabolic potential of mitochondria in splenocytes from septic mice.
Seahorse XF24 Analyzer and the mitochondrial stress test was used to determine oxygen consumption rate (OCR) in splenocytes from SHAM (n = 4), cecal ligation and puncture (CLP) (n = 6), or CLP+ DCA (n = 6) mice. A shows tracing of average values from SHAM, CLP, and CLP+ DCA groups. (B) OCR data generated using the mitochondrial stress test by Seahorse WAVE 2.4 Software (Agilent) was analyzed using GraphPad Prism 7.04 Software and ANOVA with Fisher’s LSD post-test. (C) The Seahorse WAVE 2.4 Software was used to evaluate the metabolic potential of mitochondria using the extracellular acidification rate (ECAR) and OCR in splenocytes from SHAM (n = 4), CLP (n = 6), and DCA-treated CLP mice (n = 6) as measured by the Seahorse XFe24 Analyzer.
Figure 4
Figure 4. Dichloroacetate (DCA) treatment alters serum and cell markers associated with sepsis.
(A) Serum bicarbonate levels in mice with cecal ligation and puncture (CLP) with vehicle were lower than those in SHAM-operated mice; bicarbonate levels significantly increased in CLP+ DCA vs. CLP+ vehicle group. B shows that serum glucose levels were significantly lower in CLP+ vehicle vs. SHAM group and increased in CLP+ DCA vs. CLP+ vehicle mice. C shows a significant decrease in total lymphocyte count in CLP+ vehicle vs. SHAM group, with a significant increase in total lymphocyte count in CLP+ DCA vs. CLP+ vehicle. D–F show that liver enzymes, alkaline phosphatase (ALP) (D), alanine aminotransferase (ALT) (E), and aspartate aminotransferase (AST) (F) increased significantly in CLP+ vehicle vs. SHAM groups and that all 3 enzymes normalized (to SHAM levels) in response to DCA treatment in CLP+ DCA vs. CLP+ vehicle group. A, D, E, and F, n = 6; B, n = 5 SHAM, n = 12 CLP, n = 13 CLP+ DCA; C, n = 6/SHAM, n = 8/group in CLP+ vehicle and CLP+ DCA. Assessed by 1-way ANOVA with Sidak’s post hoc multiple comparisons test. *P < 0.05; **P < 0.01; ****P < 0.0001.
Figure 5
Figure 5. Dichloroacetate (DCA) treatment increases blood pressure and improves microvascular dysfunction.
Septic animals were treated with DCA or vehicle 24 hours after cecal ligation and puncture (CLP) and assessed 6 hours after treatment. (A) Mean arterial pressure (MAP), measured via carotid artery cannulation, was significantly higher in CLP+ DCA vs. CLP+ vehicle group. (B) Mice treated with DCA (CLP+ DCA) or vehicle (CLP+ vehicle) were challenged with either normal saline (denoted as –LPS) or LPS (+LPS) i.p., and leukocyte and platelet adhesion were determined 4 hours later in the small intestine using intravital microscopy. CLP+ vehicle group did not show significant increase in leukocyte or platelet adhesion in response to LPS (+LPS) vs. normal saline (–LPS) stimulation and remained endotoxin tolerant. However, in CLP+ DCA groups, leukocyte and platelet adhesion increased significantly in response to LPS (vs. respective –LPS group), demonstrating endotoxin responsiveness. (C) E-selectin (left panel), ICAM1 (right panel) adhesion molecules, von Willebrand factor (VWF) endothelial marker, and nuclear DAPI staining show qualitatively increased E-selectin and ICAM1 expression in small intestinal tissue sections of CLP+ DCA vs. CLP+ vehicle group. IHC scale bar: 100 μm; A, n = 4 per group, t test. B, n = 5 in ±LPS vehicle and +LPS DCA, n = 4 in –LPS DCA. Assessed by 1-way ANOVA with Tukey post hoc multiple comparison test. C, n = 3. One exemplary result is shown. **P < 0.01; ***P < 0.001.
Figure 6
Figure 6. Dichloroacetate (DCA) treatment repolarizes effector and repressor immune cell responses in the spleen.
To examine the effect of pyruvate dehydrogenase kinase (PDK) inhibition on immune polarity, we used flow cytometry to analyze isolated splenocytes for CD4+ T cells and CD11c+ DCs obtained from post–cecal ligation and puncture (CLP) mice with or vehicle (CLP+ vehicle) vs. DCA (CLP+ DCA) treatment. Isolated splenocytes were assayed 6 hours after DCA/vehicle treatments and compared with SHAM control. The proportion of total CD4+ cells among total splenocytes was significantly lower in both the sepsis groups (CLP+ vehicle and CLP+ DCA) and was unaffected by DCA (A). The proportion of CD25+FoxP3+CD4+ Tregs were not significantly higher in CLP+ vehicle group vs. SHAM, while the proportion of CD25+FoxP3+CD4+ cells in the CLP+ DCA group was significantly lower vs. CLP+ vehicle group (B). Sepsis also induced an increase in the frequency of CD11c+ cells in CLP+ vehicle vs. SHAM group, and this trend was not affected by DCA (C). However, sepsis caused a marked fall in IL-12+CD11c+ cell frequency in CLP+ vehicle vs. SHAM group and a significant increase in IL-12+CD11c+ cells vs. CLP+ vehicle group (D). A, SHAM n = 9, CLP n = 14, CLP+ DCA n = 13; B, SHAM n = 5, CLP n = 5, CLP+ DCA n = 3; C, SHAM n = 2, CLP n = 4, CLP+ DCA n = 5; D, SHAM n = 2, CLP n = 4, CLP+ DCA n = 5. Assessed by 1-way ANOVA with Sidak’s post hoc multiple comparisons. *P < 0.05.
Figure 7
Figure 7. Dichloroacetate (DCA) reverses immune repressor and activator cytokines in the spleen of septic mice.
To investigate the effect of pyruvate dehydrogenase kinase (PDK) inhibition on repressor vs. activator cytokines, we assessed the IFN-γ (proimmune), TGFβ (antiimmune), and IL-10 (antiimmune) axes in CD4 and CD4+ T cells. DCA increased the percentage of IFN-γ+ cells in both CD4 and in CD4+ T cells (A and B). In contrast, there were no significant difference between CLP+ vehicle vs. CLP+ DCA groups in TGFβ+ and IL-10+ frequency in CD4 T cells (C and E). DCA reversed the sepsis-induced increase in the percentage of TGFβ+ and IL-10+ cytokines in CD4+ T cells (D and F). A, SHAM n = 4, CLP n = 9, CLP+ DCA n = 9; Sidak’s multiple comparisons. B, SHAM n = 2, CLP n = 5, CLP+ DCA n = 5; Sidak’s multiple comparisons. C, SHAM n = 2, CLP n = 5, CLP+ DCA n = 5; Sidak’s multiple comparisons. D, SHAM n = 4, CLP n = 9, CLP+ DCA n = 9; Sidak’s multiple comparisons. E, SHAM n = 2, CLP n = 5, CLP+ DCA n = 5; Sidak’s multiple comparisons. F, SHAM n = 2, CLP n = 5, CLP+ DCA n = 5; Sidak’s multiple comparisons.
Figure 8
Figure 8. Dichloroacetate (DCA) improves small intestinal villus structure and increases expression of the β-catenin anabolic transcription factor for cell and organ regeneration pathways.
(A) Small intestine sample from mice with cecal ligation and puncture (CLP) with vehicle or DCA were examined by light microscopy and assessed in a blinded fashion. Blunting of small intestinal villi occurred as expected after 30 hours of sepsis. CLP+ DCA mice showed improved structural features of the intestine, with a possible increase in villus length, vs. CLP+ vehicle group (A). To assess effects of DCA on organs and cells, we used organ and immune cell regeneration promoter β-catenin and compared CLP+ vehicle vs. CLP+ DCA treatment using IHC. β-Catenin immunofluorescence increased CLP+ DCA compared with CLP+ vehicle group in small intestine (B), liver (C), and kidney (D) tissue sections. To further examine this potential anabolic marker, we performed immunoblots in different tissues and cells in SHAM, CLP+ vehicle, and CLP+ DCA groups. β-Catenin expression decreased in CLP+ vehicle vs. SHAM in kidney and heart tissue samples (E). We also found in a human monocyte in vitro cell model of sepsis 24 hours after endotoxin tolerance development that 5 mM DCA increased β-catenin expression (E). IHC scale bar: 100 μm. n = 3 animals were studied in each cohort for each tissue using IHC. For immunoblots, n ≥ 2 experiments, and 1 exemplary experiment is shown for isolated hepatocytes, heart, and kidney tissue each. For THP-1 cells, 3 distinct in vitro experiments were performed, and 1 example is shown.
Figure 9
Figure 9. Dichloroacetate (DCA) improves survival and accelerates bacterial clearance in septic mice.
(A) To assess the effect of DCA on survival, we treated mice 24 hours after cecal ligation and puncture (CLP) with a single i.p. dose of 25 mg/kg of DCA (CLP+ DCA) vs. a vehicle control (CLP+ vehicle) and followed 14-day survival. Kaplan-Maier survival curve shows that DCA (CLP+ DCA) significantly improved 14-day survival vs. vehicle treatment (CLP+ vehicle) in the absence of antibiotics. n = 20 in each of 2 cohorts. n = 20 mice/cohort; Log-rank (Mantel-Cox) test. **P < 0.01. (B) To determine the effect of infection in the absence of antibiotics, we assessed bacterial clearance from the peritoneal cavity, using colony count methodology. Animals were treated with vehicle or DCA as a single dose of 25 mg/kg i.p. 24 hours after CLP sepsis induction, and samples were obtained 6 hours after vehicle or DCA treatment. DCA significantly reduced the microbial colony counts in the peritoneum. SHAM, n = 4; CLP, n = 7; CLP+ DCA, n = 7,. Sidak’s multiple comparisons test. Note: Since the axis is logarithmic, only values greater than zero can be plotted. For this graph, 2 values were zero or negative, so they are not visible on the graph.

Similar articles

Cited by

References

    1. Norata GD, et al. The Cellular and Molecular Basis of Translational Immunometabolism. Immunity. 2015;43(3):421–434. doi: 10.1016/j.immuni.2015.08.023. - DOI - PubMed
    1. O’Neill LA, Pearce EJ. Immunometabolism governs dendritic cell and macrophage function. J Exp Med. 2016;213(1):15–23. doi: 10.1084/jem.20151570. - DOI - PMC - PubMed
    1. Olenchock BA, Rathmell JC, Vander Heiden MG. Biochemical Underpinnings of Immune Cell Metabolic Phenotypes. Immunity. 2017;46(5):703–713. doi: 10.1016/j.immuni.2017.04.013. - DOI - PMC - PubMed
    1. O’Sullivan D, Pearce EL. Immunology. Expanding the role of metabolism in T cells. Science. 2015;348(6238):976–977. doi: 10.1126/science.aac4997. - DOI - PubMed
    1. Singer M. The role of mitochondrial dysfunction in sepsis-induced multi-organ failure. Virulence. 2014;5(1):66–72. doi: 10.4161/viru.26907. - DOI - PMC - PubMed

Publication types

MeSH terms

Substances