. 2018 Aug 9;3(15):e121153.
doi: 10.1172/jci.insight.121153.

Cardiovascular consequences of KATP overactivity in Cantu syndrome

Affiliations

Cardiovascular consequences of KATP overactivity in Cantu syndrome

Yan Huang et al. JCI Insight. .

Abstract

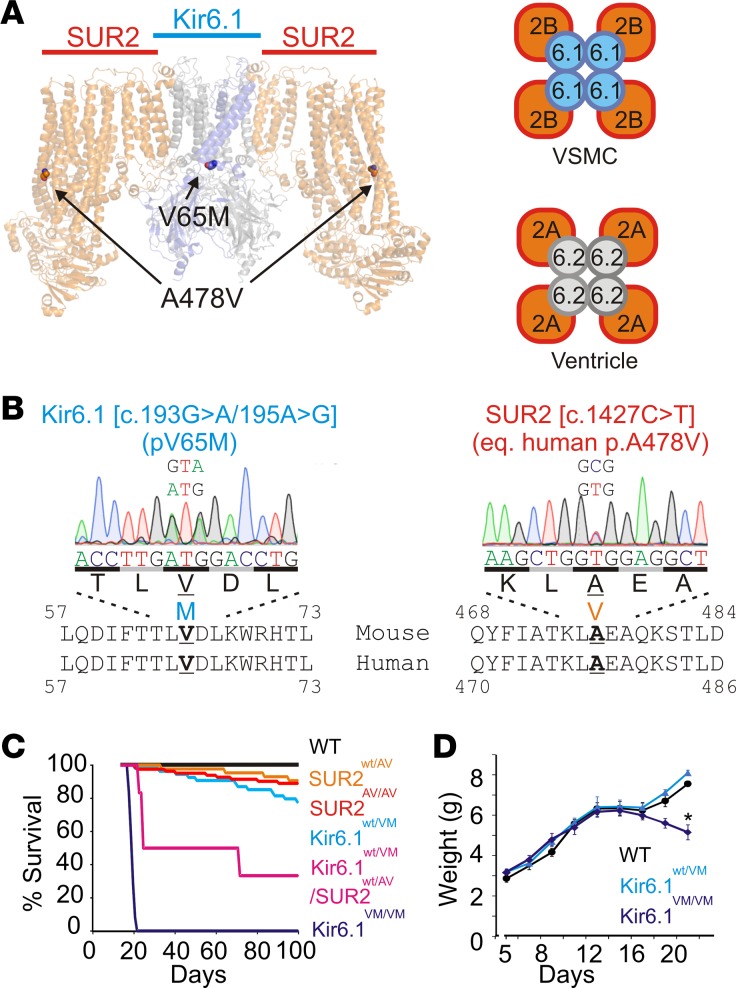
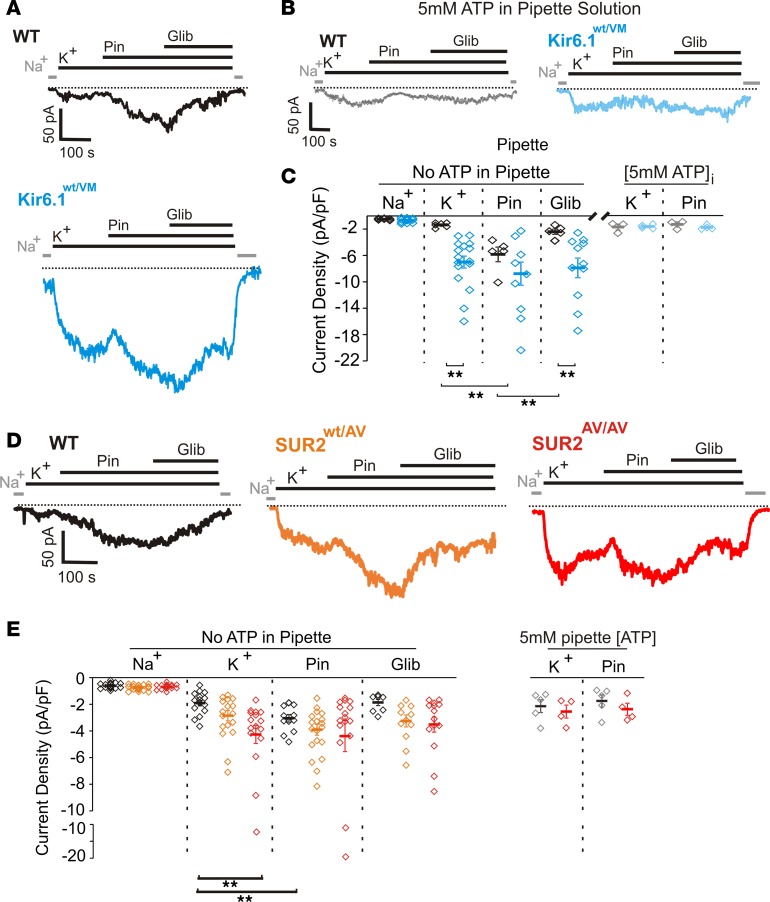
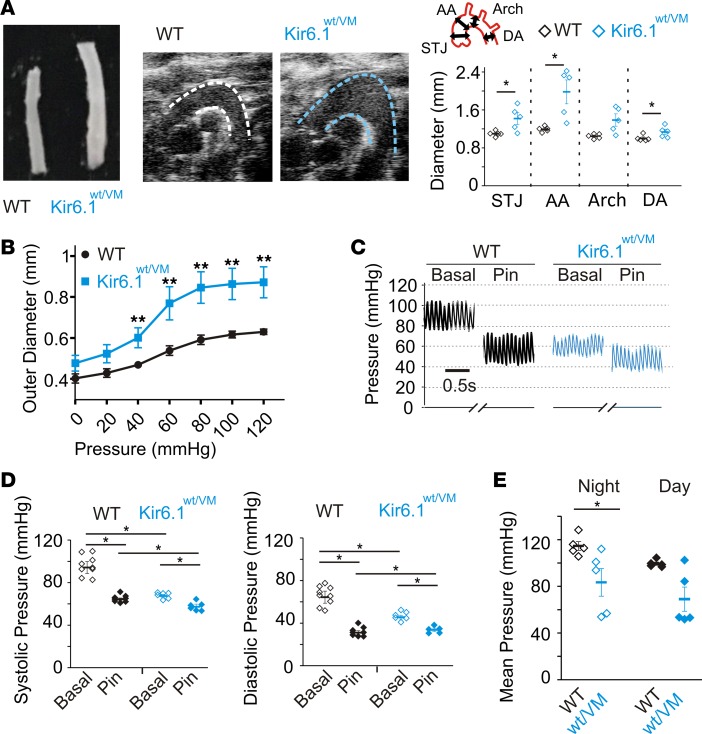
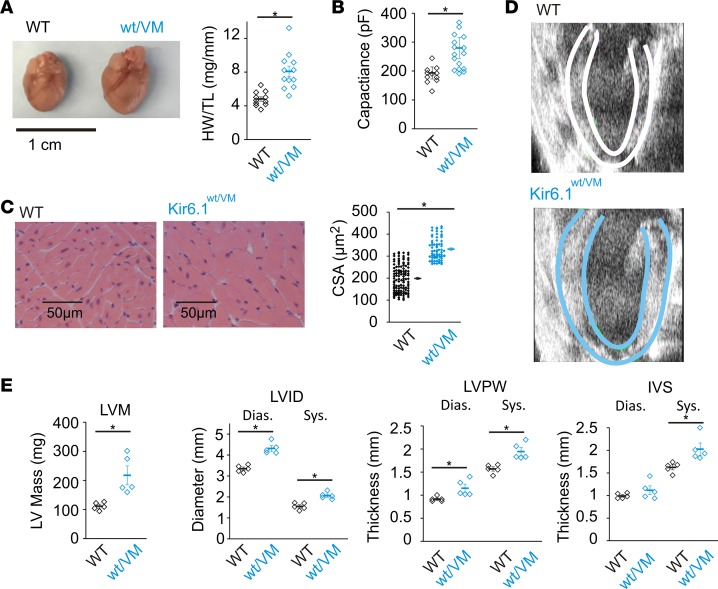
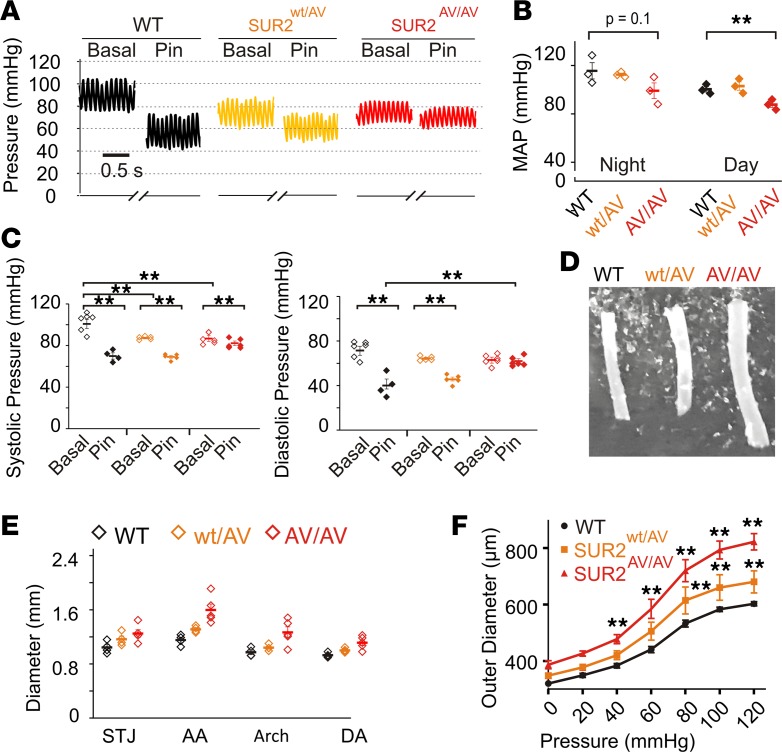
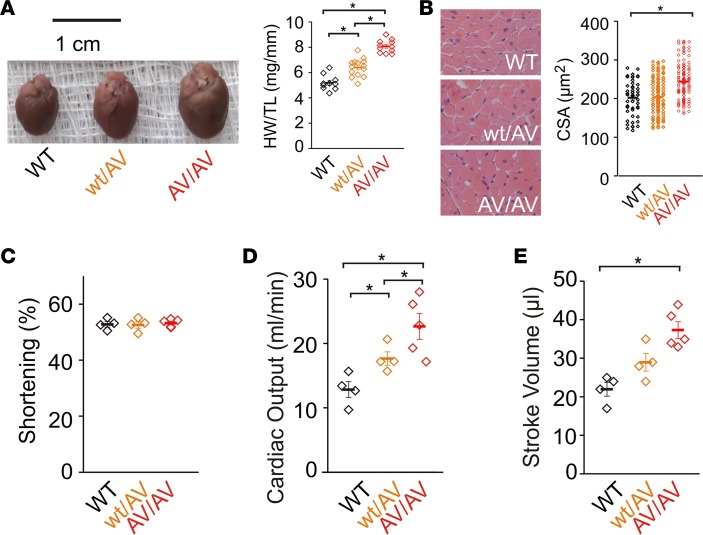
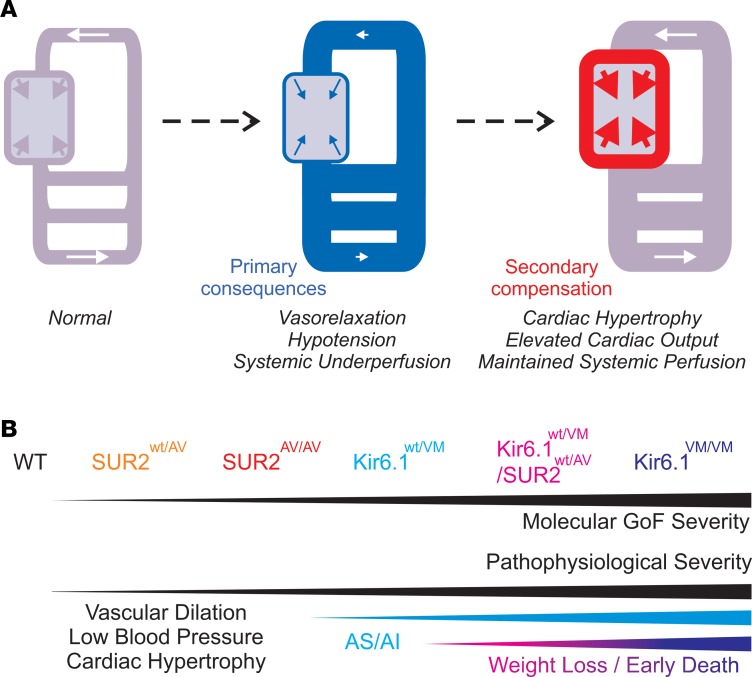
Cantu syndrome (CS) is characterized by multiple vascular and cardiac abnormalities including vascular dilation and tortuosity, systemic hypotension, and cardiomegaly. The disorder is caused by gain-of-function (GOF) mutations in genes encoding pore-forming (Kir6.1, KCNJ8) and accessory (SUR2, ABCC9) ATP-sensitive potassium (KATP) channel subunits. However, there is little understanding of the link between molecular dysfunction and the complex pathophysiology observed, and there is no known treatment, in large part due to the lack of appropriate preclinical disease models in which to test therapies. Notably, expression of Kir6.1 and SUR2 does not fully overlap, and the relative contribution of KATP GOF in various cardiovascular tissues remains to be elucidated. To investigate pathophysiologic mechanisms in CS we have used CRISPR/Cas9 engineering to introduce CS-associated SUR2[A478V] and Kir6.1[V65M] mutations to the equivalent endogenous loci in mice. Mirroring human CS, both of these animals exhibit low systemic blood pressure and dilated, compliant blood vessels, as well dramatic cardiac enlargement, the effects being more severe in V65M animals than in A478V animals. In both animals, whole-cell patch-clamp recordings reveal enhanced basal KATP conductance in vascular smooth muscle, explaining vasodilation and lower blood pressure, and demonstrating a cardinal role for smooth muscle KATP dysfunction in CS etiology. Echocardiography confirms in situ cardiac enlargement and increased cardiac output in both animals. Patch-clamp recordings reveal reduced ATP sensitivity of ventricular myocyte KATP channels in A478V, but normal ATP sensitivity in V65M, suggesting that cardiac remodeling occurs secondary to KATP overactivity outside of the heart. These SUR2[A478V] and Kir6.1[V65M] animals thus reiterate the key cardiovascular features seen in human CS. They establish the molecular basis of the pathophysiological consequences of reduced smooth muscle excitability resulting from SUR2/Kir6.1-dependent KATP GOF, and provide a validated animal model in which to examine potential therapeutic approaches to treating CS.

Keywords: Cardiology; Cardiovascular disease; Genetic diseases; Ion channels.


Conflict of interest statement

Conflict of interest: The authors have declared that no conflict of interest exists.

Figures

Figure 1
Figure 1. Generation of the Cantu mice.
(A) Left: Structural representation of the pancreatic Kir6.2/SUR1 KATP channel (PDB ID: 5WUA) with the equivalent position of Kir6.1[V65M] and SUR2[A478V] highlighted. Right: Predominant isoform composition of vascular smooth muscle (Kir6.1/SUR2B) and ventricular (Kir6.2/SUR2A) KATP channels. (B) Sequencing chromatograms from heterozygous Kir6.1wt/VM and SUR2wt/AV animals. (C) Kaplan-Meier survival curves for WT and Cantu animals (n = 8–25 in each genotype). (D) Body weight measurements from Kir6.1wt/VM, Kir6.1VM/VM, and WT littermate mice prior to weaning; Kir6.1VM/VM mice lose weight prior to premature death at around 20 days (n = 15–25 animals). Statistical significance was determined by multiway ANOVA followed by t test pairwise comparison with Bonferroni’s correction for multiple comparisons (adjusted α = 0.05/3 = 0.017). *P < 0.05.
Figure 2
Figure 2. Smooth muscle KATP channels in Kir6.1wt/VM and SUR2wt/AV mice.
(A) Representative whole-cell voltage-clamp recordings from acutely isolated aortic smooth muscle cells from WT (top) and Kir6.1wt/VM (bottom) mice. Cells were voltage clamped at –70 mV. (B) Representative whole-cell voltage-clamp recordings from Kir6.1wt/VM aortic smooth muscle cells using an intracellular pipette solution containing 5 mM ATP. (C) Summary of whole-cell current densities from voltage-clamp recordings of Kir6.1wt/VM aortic smooth muscle cells showing significant increases in basal and pinacidil-activated KATP conductances, which are resistant to glibenclamide inhibition (n ≥ 5 for WT and 11 for Kir6.1wt/VM from ≥ 3 mice each). (D) Representative whole-cell voltage-clamp recordings from acutely isolated aortic smooth muscle cells from WT (left, black), heterozygous SUR2wt/AV (middle, orange), and homozygous SUR2AV/AV (right, red) mice using an intracellular pipette solution absent of nucleotides (–70 mV holding potential). (E) Left: Summary of whole-cell current densities from voltage-clamp recordings of aortic smooth muscle cells from WT, SUR2wt/AV, and SUR2AV/AV mice showing significant increases in basal and pinacidil-activated KATP conductances (n ≥ 8 for WT, 11 for SUR2wt/AV, and 14 for SUR2AV/AV from ≥ 3 mice each). Right: Summary of experiments in which 5 mM ATP was included in the patch pipette shown for WT and SURAV/AV cells. Statistical significance was determined by multiway ANOVA followed by t test pairwise comparison with Bonferroni’s correction for multiple comparisons. Adjusted α = 0.008 (C) and 0.003 (E). **P < 0.01.
Figure 3
Figure 3. KATP channels in Kir6.1wt/VM and SUR2wt/AV ventricular myocytes.
(A) Representative inside-out voltage-clamp recordings of KATP channel activity from acutely dissociated ventricular myocytes from WT (left) and Kir6.1wt/VM mice showing the response to MgATP (recording from –50 mV holding potential). (B) Summary [MgATP]-response curves from excised patch experiments (IC50 values from individual experiments shown in inset; n = 10 for WT and Kir6.1wt/VM from ≥ 3 mice each). (C) Representative inside-out voltage-clamp recordings of KATP channel activity from acutely dissociated ventricular myocytes from WT (left, black), SUR2wt/AV (middle, orange), and SUR2AV/AV (right, red) mice showing the response to MgATP (recording from –50 mV holding potential). (D) Summary MgATP dose-response curves from excised patch experiments shows increased MgATP IC50 in SUR2wt/AV and SUR2AV/AV mice (IC50 values from individual experiments shown in inset; n = 7 from WT, 9 from SUR2wt/AV, and SUR2AV/AV, from ≥ 3 mice each). Statistical significance was determined by multiway ANOVA followed by t test pairwise comparison with Bonferroni’s correction for multiple comparisons (adjusted α = 0.017). *P < 0.05.
Figure 4
Figure 4. The effects of KATP gain of function on vascular structure and function in Kir6.1wt/VM.
(A) Left: Isolated descending thoracic aortas show significant gross enlargement in Kir6.1wt/VM (middle). Sagittal 2D echocardiographic images of the aortic arch reveal significant dilation in Kir6.1wt/VM mice (aortic boundaries indicated by dashed lines). Right: Measurements of aortic diameter derived from 2D sagittal echocardiographic imaging at different points around the aortic arch in WT (black) and Kir6.1wt/VM mice (blue). STJ, sinotubular junction; AA, ascending aorta; Arch, aortic arch; DA, descending aorta; as shown in inset; n = 5). (B) Vessel compliance measurements from pressurized carotid arteries of WT (black) and Kir6.1wt/V (blue) mice (n = 4 for WT, n = 7 for Kir6.1wt/VM). (C) Representative blood pressure measurements from anesthetized mice showing decreased basal systemic pressures in Kir6.1wt/VM mice and blunted response to the KATP channel activator pinacidil. (D) Summary data showing systolic (left) and diastolic (right) pressures from anesthetized mice (n = 9 for WT and 6 for Kir6.1wt/VM). (E) Telemetric measurements of mean arterial pressure from ambulatory WT and Kir6.1wt/VM mice (n = 5 for both WT and Kir6.1wt/VM). Statistical significance was determined by multiway ANOVA followed by t test pairwise comparison with Bonferroni’s correction for multiple comparisons. Adjusted α = 0.013 (A), 0.007 (B), 0.013 (D), and 0.025 (E). *P < 0.05; **P < 0.01.
Figure 5
Figure 5. Cardiac hypertrophy in the Kir6.1wt/VM mouse.
(A) Left: Gross heart size is increased in Kir6.1wt/VM mice. Right: Heart weight normalized to tibia length (HW/TL; mg/mm; n = 11 for WT and 12 for Kir6.1wt/VM). (B) Cardiomegaly results from cellular hypertrophy as indicated by increased cell capacitance (measured from whole-cell voltage-clamp recordings of isolated ventricular myocytes (n = 11 for WT and 16 for Kir6.1wt/VM) and (C) from measurements of cell surface area (CSA) from H&E-stained ventricular tissue (n = 116 cells from 3 mice for WT and 69 cells from 3 mice for Kir6.1wt/VM). (D) Parasternal long-axis echocardiographic imaging shows increased left ventricle (LV) internal diameter and wall thickness in Kir6.1wt/VM (endo- and epicardial boundaries indicated by white or blue lines for WT and Kir6.1wt/VM, respectively). (E) M-mode echocardiographic quantification of LV mass (LVM; far left), LV internal diameter (LVID; middle left), LV posterior wall (LVPW; middle right), and intraventricular septum (IVS; far right) are increased in Kir6.1wt/VM mice (n = 5 for both). Statistical significance determined by t test for A, C, and LVM (in E). For LVID, LVPW, and IVS in E, statistical significance was determined by multiway ANOVA followed by t test pairwise comparison with Bonferroni’s correction for multiple comparisons (adjusted α = 0.025). *P < 0.05.
Figure 6
Figure 6. Aortic insufficiency and aortic regurgitation in the Kir6.1wt/VM mouse.
(A) Echocardiographic imaging in diastole reveals aortic valve insufficiency (AI; aortic regurgitation) in 4 of 5 Kir6.1wt/VM mice tested (AI not observed in any WT mice; n = 5), see also Supplemental Video 1. (B) 2D color Doppler echocardiographic imaging in systole shows aortic valve stenosis in 4 of 5 Kir6.1wt/VM but 0 of 5 WT mice (see also Supplemental Video). In A and B, statistical significance was determined by t test. *P < 0.05. (C) Correlation of AI with aortic diameter at the sinotubular junction (STJ) (left); left ventricular mass (LVM; derived from echocardiography) and aortic valve pressure gradient (middle); and LVM and AI area (right) in Kir6.1wt/VM mice. R denotes Pearson’s correlation coefficient.
Figure 7
Figure 7. Cardiac function in WT and Kir6.1wt/VM mice.
(A) Representative M-mode echocardiographic imaging of WT (top) and Kir6.1wt/VM mice (bottom) showing dilated left ventricle chambers and increased wall diameters. d, diastole; s, systole; IVS, interventricular septum; LVID, left ventricular internal diameter; LVPW, left ventricular posterior wall. (B) Left ventricle (LV) fractional shortening (FS) is unchanged in Kir6.1wt/VM as determined from M-mode echocardiograms (n = 5 for both). (C) Stroke volume (SV) is increased in Kir6.1wt/VM mice (n = 5 for both). (D) Heart rate (HR) is unchanged in lightly anesthetized Kir6.1wt/VM mice during echocardiographic investigation (n = 5 for both genotypes). (E) Cardiac output is markedly increased in Kir6.1wt/VM mice due to increased SV and preserved FS. (F) Peak myocardial strain rate (dV/dT max) was increased in Kir6.1wt/VM mice as determined from speckle tracking measurements. (G) Left: Representative ECG recordings from awake WT (black) and Kir6.1wt/VM (blue) mice. Right: Summary HR, RR-interval, QT duration, and corrected QT (QTc) from WT and Kir6.1wt/VM mice (data shown as mean ± SEM; n = 7 for WT, n=11 for Kir6.1wt/VM). Statistical significance determined by t test. *P < 0.05.
Figure 8
Figure 8. Vascular consequences in SUR2wt/AV mice.
(A) Representative blood pressures in anesthetized mice showing decreased basal pressures in SUR2wt/AV and SUR2AV/AV mice and blunted response to the KATP channel activator pinacidil. (B) Telemetric measurements of mean arterial pressure from ambulatory WT (black), SUR2wt/AV (orange), and SUR2AV/AV (red) mice show decreased blood pressure in SUR2AV/AV mice (n = 3 for each genotype). (C) Summary data showing basal and pinacidil-reduced systolic (left) and diastolic (right) pressures from anesthetized WT, SUR2wt/AV, and SUR2AV/AV mice (n = 6 for WT, 5 for SUR2wt/AV, and 6 for SUR2AV/AV). (D) Isolated descending thoracic aortae show progressive dilation in SUR2wt/AV and SUR2AV/AV mice. (E) Aortic diameter derived from 2D sagittal echocardiographic imaging at different points around the aortic arch in WT (black), SUR2wt/AV (orange), and SUR2AV/AV (red). STJ, sinotubular junction; AA, ascending aorta; Arch, aortic arch; DA, descending aorta; as shown in inset; n = 3 each). (F) Vessel compliance in pressurized carotid arteries of WT (black), SUR2wt/AV (orange), and SUR2AV/AV (red) mice reveal increased diameters in mutant mice across full pressure range (n = 4 for WT, 5 for SUR2wt/AV, and 5 for SUR2AV/AV). Statistical significance was determined by multiway ANOVA followed by t test pairwise comparison with Bonferroni’s correction for multiple comparisons. Adjusted α = 0.008 (B), 0.006 (C), and 0.004 (F). **P < 0.01.
Figure 9
Figure 9. Cardiac hypertrophy in SUR2wt/AV mice.
(A) Left: Gross heart size is increased in SUR2wt/AV and SUR2AV/AV mice. Right: Heart weight normalized to tibia length (HW/TL; mg/mm; n = 10 for WT, 14 for SUR2wt/AV, and 14 for SUR2AV/AV). (B) Cell surface area (CSA) measurements from H&E-stained ventricular sections shows cellular hypertrophy in SUR2AV/AV mice (n = 45 cells from 3 mice for WT, 162 cells from 3 mice for SUR2wt/AV, and 124 cells from 3 mice for SUR2AV/AV). (C) Fractional shortening is unchanged in SUR2wt/AV and SUR2AV/AV mice as determined from M-mode echocardiographic imaging. (D) Cardiac output is significantly increased in both SUR2wt/AV and SUR2AV/AV mice due to increased stroke volume (E) (n = 4 for WT and SUR2wt/AV and 5 for SUR2AV/AV). Statistical significance was determined by multiway ANOVA followed by t test pairwise comparison with Bonferroni’s correction for multiple comparisons (adjusted α = 0.017). *P < 0.05.
Figure 10
Figure 10. Progressive cardiovascular consequences of Cantu syndrome.
(A) The primary consequence of KATP GOF in the vasculature is reduced excitability, leading to functional and structural vasodilation, low blood pressure, and underperfusion. Secondarily, this leads to a compensatory cardiac hypertrophy and hypercontractility. (B) These features are present in even mild (e.g., SUR2wt/AV) CS models, but are exacerbated in more severe genotypes (e.g., Kir6.1wt/VM and SUR2AV/AV). The latter genotypes are associated with premature death, and very early death occurs immediately after weaning in the most severe genotypes (e.g., SUR2wt/AV/Kir6.1wt/VM and Kir6.1VM/VM).

References

    1. Cantú JM, García-Cruz D, Sánchez-Corona J, Hernández A, Nazará Z. A distinct osteochondrodysplasia with hypertrichosis- Individualization of a probable autosomal recessive entity. Hum Genet. 1982;60(1):36–41. doi: 10.1007/BF00281261. - DOI - PubMed
    1. Scurr I, et al. Cantú syndrome: report of nine new cases and expansion of the clinical phenotype. Am J Med Genet A. 2011;155A(3):508–518. - PubMed
    1. Grange DK, Lorch SM, Cole PL, Singh GK. Cantu syndrome in a woman and her two daughters: Further confirmation of autosomal dominant inheritance and review of the cardiac manifestations. Am J Med Genet A. 2006;140(15):1673–1680. - PubMed
    1. Leon Guerrero CR, et al. Neurologic and neuroimaging manifestations of Cantú syndrome: A case series. Neurology. 2016;87(3):270–276. doi: 10.1212/WNL.0000000000002861. - DOI - PMC - PubMed
    1. Brownstein CA, et al. Mutation of KCNJ8 in a patient with Cantú syndrome with unique vascular abnormalities - support for the role of K(ATP) channels in this condition. Eur J Med Genet. 2013;56(12):678–682. doi: 10.1016/j.ejmg.2013.09.009. - DOI - PMC - PubMed

Publication types

MeSH terms

Supplementary concepts