. 2018 Aug 9;3(15):e121256.
doi: 10.1172/jci.insight.121256.

Quantifying size and diversity of the human T cell alloresponse

Affiliations

Quantifying size and diversity of the human T cell alloresponse

Susan DeWolf et al. JCI Insight. .

Abstract

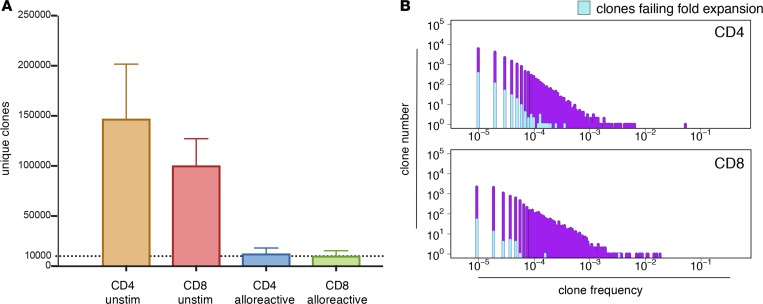
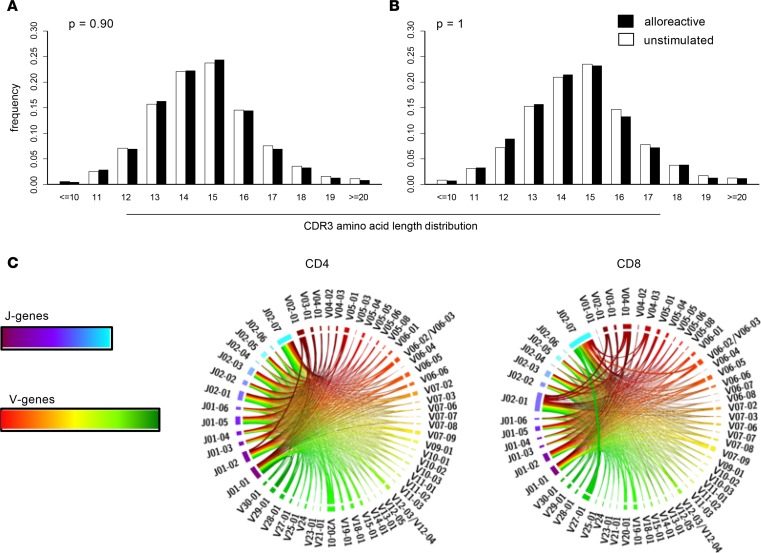
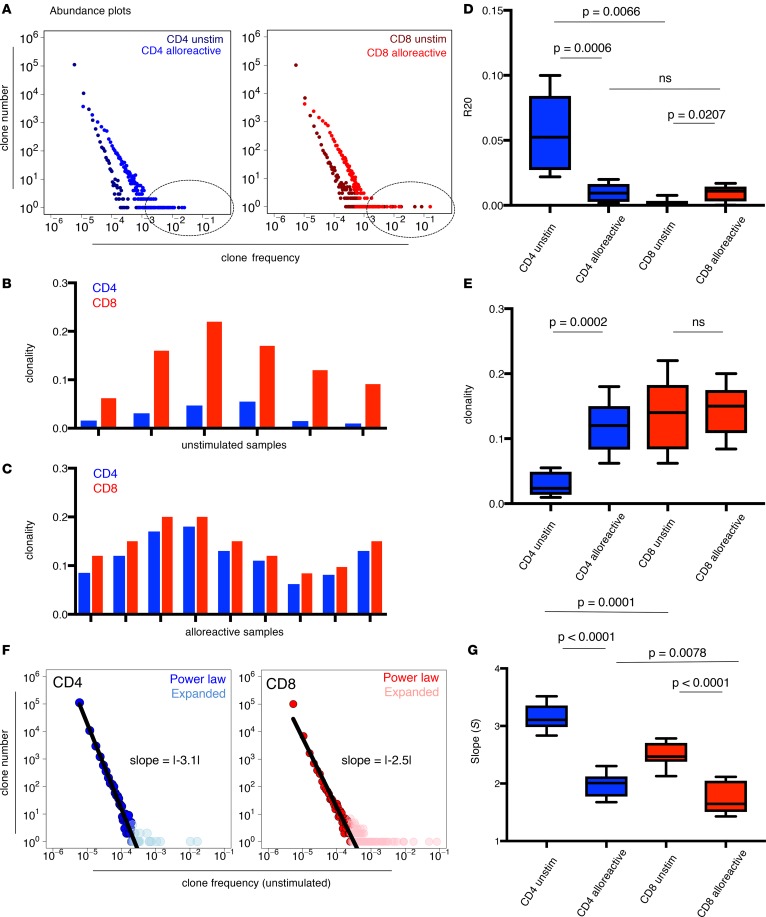
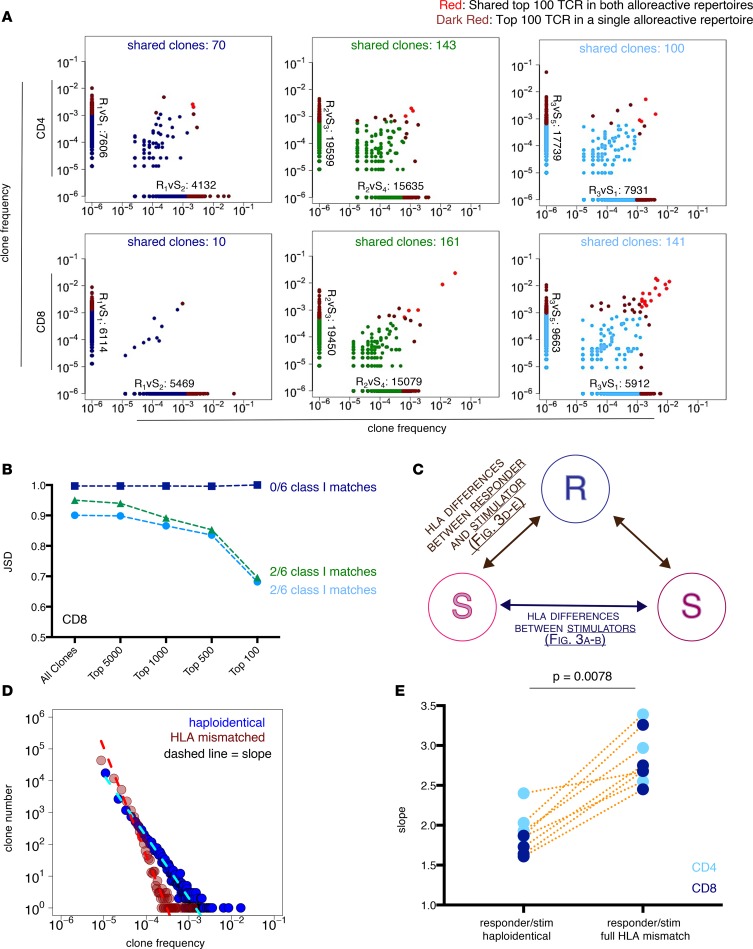
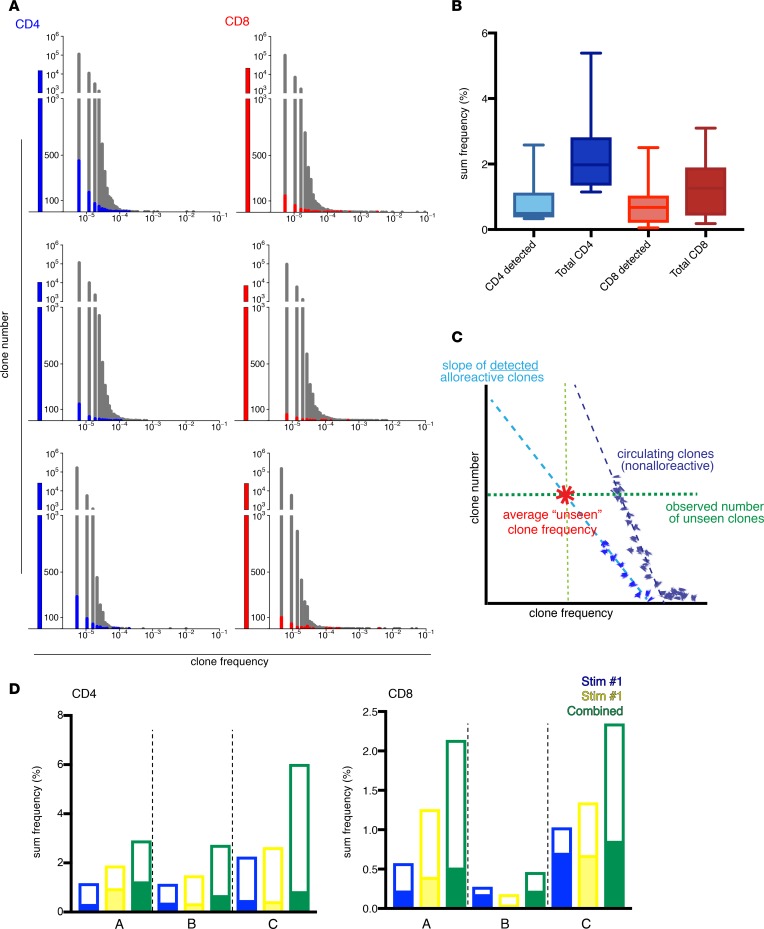
Alloreactive T lymphocytes are the primary mediators of immune responses in transplantation, both in the graft-versus-host and host-versus-graft directions. While essentially all clones comprising the human T cell repertoire have been selected on self-peptide presented by self-human leukocyte antigens (self-HLAs), much remains to be understood about the nature of clones capable of responding to allo-HLA molecules. Quantitative tools to study these cells are critical to understand fundamental features of this important response; however, the large size and diversity of the alloreactive T cell repertoire in humans presents a great technical challenge. We have developed a high-throughput T cell receptor (TCR) sequencing approach to characterize the human alloresponse. We present a statistical method to model T cell clonal frequency distribution and quantify repertoire diversity. Using these approaches, we measured the diversity and frequency of distinct alloreactive CD4+ and CD8+ T cell populations in HLA-mismatched responder-stimulator pairs. Our findings indicate that the alloimmune repertoire is highly specific for a given pair of individuals, that most alloreactive clones circulate at low frequencies, and that a high proportion of TCRs is likely able to recognize alloantigens.

Keywords: Bioinformatics; Immunology; T cells; T-cell receptor; Transplantation.


Conflict of interest statement

Conflict of interest: The authors have declared that no conflict of interest exists.

Figures

Figure 1
Figure 1. Defining unstimulated and alloreactive T cell repertoires.
(A) Number of unique productive clones identified in CD4+ and CD8+ unstimulated and alloreactive (2-fold-expansion criterion) populations (mean and standard deviation; n = 11 alloreactive, n = 8 unstimulated). (B) Representative histograms showing the number of clones in CFSElo MLR T cells failing the 2-fold-expansion criterion at each clonal frequency; all samples (n = 9) shown in Supplemental Figure 2.
Figure 2
Figure 2. Comparison of the unstimulated and alloreactive populations identified via high-throughput T cell receptor sequencing.
(A) CD4 and (B) CD8 representative graphs showing lack of significant difference (Mann-Whitney test) in CDR3 amino acid length distribution between unstimulated and alloreactive repertoires; all samples (n = 9) shown in Supplemental Figure 3. (C) CD4 and CD8 representative Circos plots showing diversity of Vβ and Jβ gene pairing in alloreactive repertoires; all samples (n = 9) shown in Supplemental Figure 4. The thickness of the line between each V-gene (right side of circle) and J-gene (left side of circle) is proportional to the frequency of a given combination.
Figure 3
Figure 3. T cell receptor sequencing to quantify diversity of CD4+ and CD8+ unstimulated and alloreactive T cell repertoires.
(A) Representative abundance plots of unstimulated and alloreactive repertoires showing the number of unique clones (clone number) at each frequency within a sample; encircled regions highlight high frequency populations within each sample; plots for all samples (n = 11) are shown in Supplemental Figure 5. (B) Clonality of CD4+ (blue) and CD8+ (red) unstimulated T cells. Each pair of bars represents 1 unstimulated CD4+/CD8+ pair (n = 6). (C) Clonality of CD4+ (blue) and CD8+ (red) alloreactive T cells (2-fold-expansion criterion). Each bar represents 1 alloreactive CD4+/CD8+ pair (n = 9). (D) Box plot (maximum to minimum) comparing fraction of clones accounting for top 20% of reads (R20) in unstimulated and alloreactive populations (samples described in B and C; unpaired t test comparing across alloreactive and unstimulated samples, otherwise paired t test, P = 0.01); tabulated values in Supplemental Table 1. (E) Box plot (maximum to minimum) comparing unstimulated and alloreactive repertoire clonality (samples described in B and C; unpaired t test, P = 0.01); tabulated values in Supplemental Table 1. (F) Representative power law slopes for CD4+ and CD8+ unstimulated sample; solid black line is best-fit line for clone frequency plotted against clone number (number of unique clones or clone count) on the logarithmic scale excluding expanded clones. (G) Box plot (maximum to minimum) comparing slope (S) for unstimulated and alloreactive repertoires (samples described in B and C; unpaired t test comparing across alloreactive and unstimulated comparisons, otherwise paired t test, P = 0.01); tabulated values in Supplemental Table 1.
Figure 4
Figure 4. Allospecificity of the alloreactive repertoire and the role of HLA.
(A) Scatter plots showing lack of overlap between alloreactive clones for 2 distinct alloreactive repertoires generated by 1 responder (R) paired with 2 different stimulators (S) (2-fold-expansion criterion). (B) Jensen-Shannon divergence (JSD) quantitatively compares T cell receptor (TCR) repertoire overlap between the distinct alloreactive populations in A, taking into account clone frequency (JSD 0 = complete overlap; JSD 1 = complete divergence). HLA matches between stimulators shown for class I; for class II, 0 or 1 of 4 (HLA-DR, -DQ) (2 fold-expansion criterion). (C) Schematic highlighting that different analytic strategies for investigating role of HLA-disparities in the alloresponse: comparisons can be between different stimulators (S) or between responder (R) and stimulator (S). (D) Illustrative example of 2 alloreactive repertoires, one HLA mismatched (red) and the other haploidentical (blue), showing power law abundance with a best-fit line used for slope calculation. Alloreactive populations were obtained from a kidney transplant subject. (E) Comparison of CD4 and CD8 slope measurement of alloreactive repertoires for 4 kidney transplant subjects each in response to 2 distinct stimulators, one unrelated HLA-mismatched (left) and one related haploidentical with 2 or more class I (HLA-A, -B) and class II (HLA-DR, -DQ) matches (right). Dashed line connects stimulator pairs for the same subject; Wilcoxon’s test for statistical comparison, P = 0.05). Supplemental Figure 7A shows individual slope plots for each subject (n = 4); raw data included in Supplemental Table 3 along including clonality and R20.
Figure 5
Figure 5. Frequency of alloreactive clones in circulation.
(A) Representative histograms for 3 healthy adults showing frequency distribution of alloreactive clones (blue CD4+, red CD8+) within the unstimulated population (gray). Undetected alloreactive clones (2-fold-expansion criterion, minimum-frequency threshold 10–5 within stimulated) clones are plotted to the left of the y axis. Histograms for all subjects (n = 9) shown in Supplemental Figure 8. (B) Sum frequency of CD4+ and CD8+ alloreactive clones detected in the corresponding unstimulated CD4+ and CD8+ populations (light blue and light red, respectively) and the total estimated frequency of alloreactive clones: sum frequency of detected clones with added sum frequency of unseen alloreactive clones (dark blue, dark red). Unseen frequencies of alloreactive clones calculated via the statistical model schematized in C and further described in the supplemental methods (n = 9 alloreactive, n = 6 unstimulated, individual values included in Table 1). (C) Schematic illustrating statistical model used to estimate average frequency of alloreactive clones not detected within the circulating population. (D) Cumulative frequency of detected (solid fill bars) and undetected (unfilled bars) alloreactive clones for 1 responder to 2 distinct stimulators (n = 3, corresponding to sample pairs shown in Figure 3A; “A,” “B,” and “C” on the x axis refer to each different responder).

References

    1. Sherman LA, Chattopadhyay S. The molecular basis of allorecognition. Annu Rev Immunol. 1993;11:385–402. doi: 10.1146/annurev.iy.11.040193.002125. - DOI - PubMed
    1. Wilson DB. Quantitative studies on the mixed lymphocyte interaction in rats. I. Conditions and parameters of response. J Exp Med. 1967;126(4):625–654. doi: 10.1084/jem.126.4.625. - DOI - PMC - PubMed
    1. Wilson DB, Silvers WK, Nowell PC. Quantitative studies on the mixed lymphocyte interaction in rats. II. Relationship of the proliferative response to the immunologic status of the donors. J Exp Med. 1967;126(4):655–665. doi: 10.1084/jem.126.4.655. - DOI - PMC - PubMed
    1. Wilson DB, Blyth JL, Nowell PC. Quantitative studies on the mixed lymphocyte interaction in rats. 3. Kinetics of the response. J Exp Med. 1968;128(5):1157–1181. doi: 10.1084/jem.128.5.1157. - DOI - PMC - PubMed
    1. Nisbet NW, Simonsen M, Zaleski M. The frequency of antigen-sensitive cells in tissue transplantation. A commentary on clonal selection. J Exp Med. 1969;129(3):459–467. doi: 10.1084/jem.129.3.459. - DOI - PMC - PubMed

Publication types

MeSH terms