Review
. 2018 Aug 7;50(8):1-14.
doi: 10.1038/s12276-018-0071-8.

Single-cell RNA sequencing technologies and bioinformatics pipelines

Affiliations
Review

Single-cell RNA sequencing technologies and bioinformatics pipelines

Byungjin Hwang et al. Exp Mol Med. .

Erratum in

Abstract

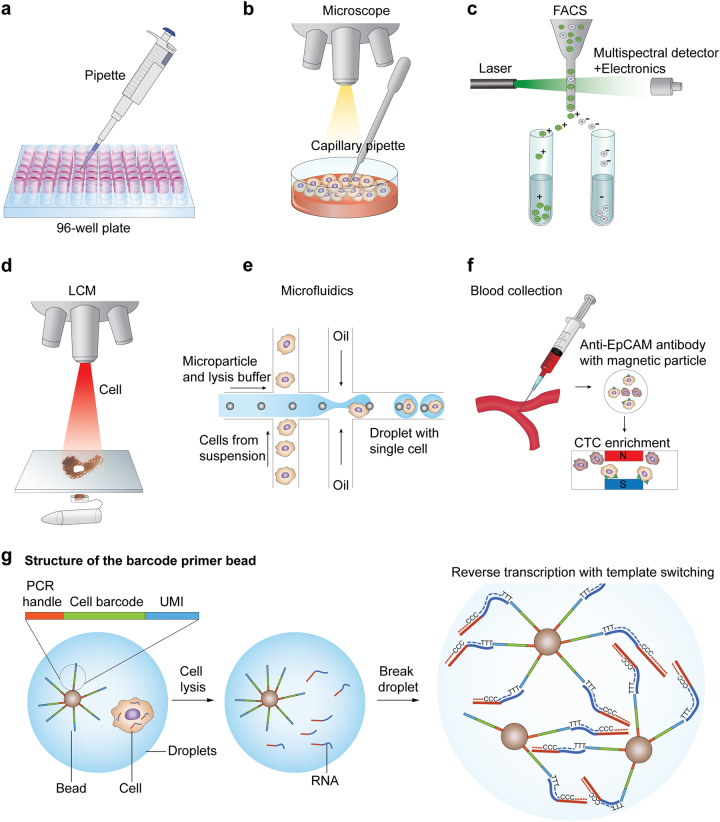
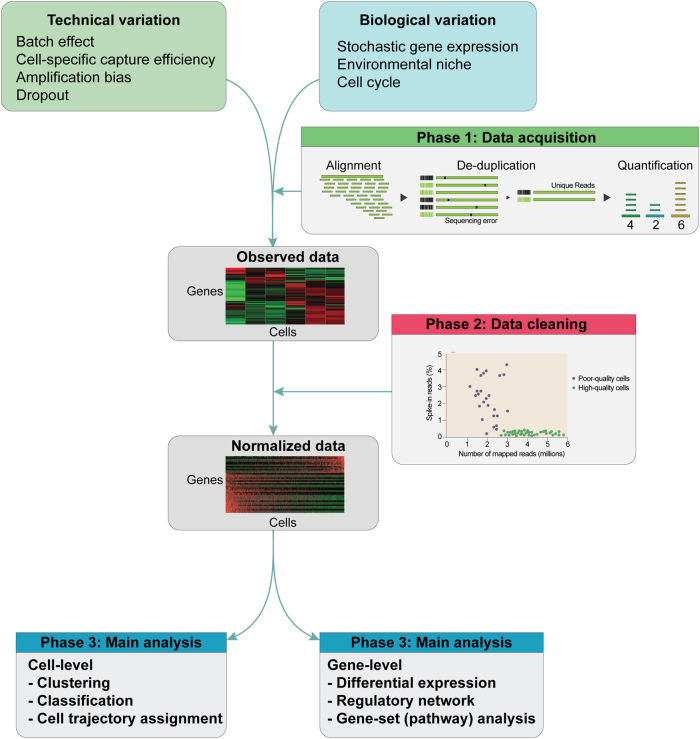
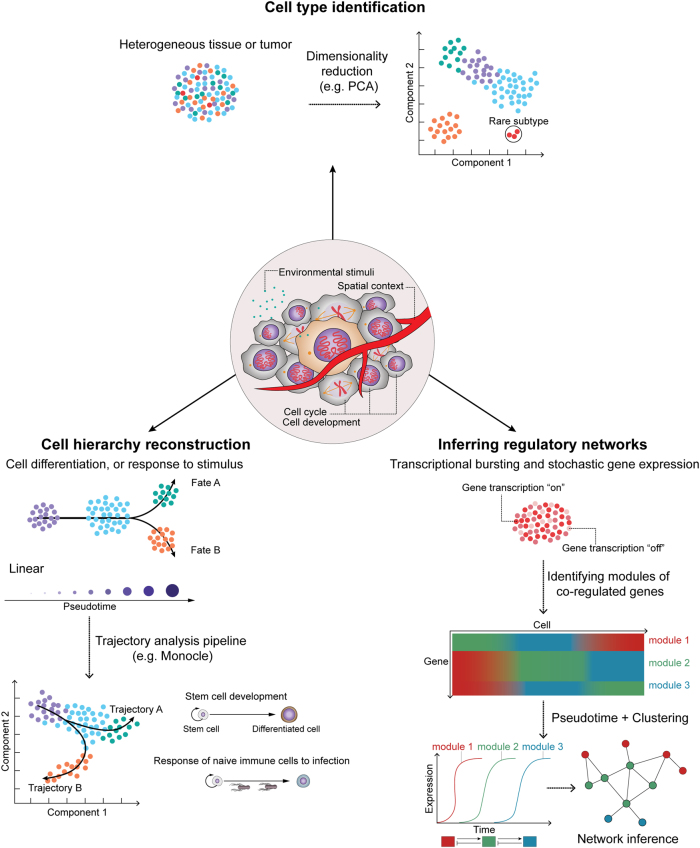
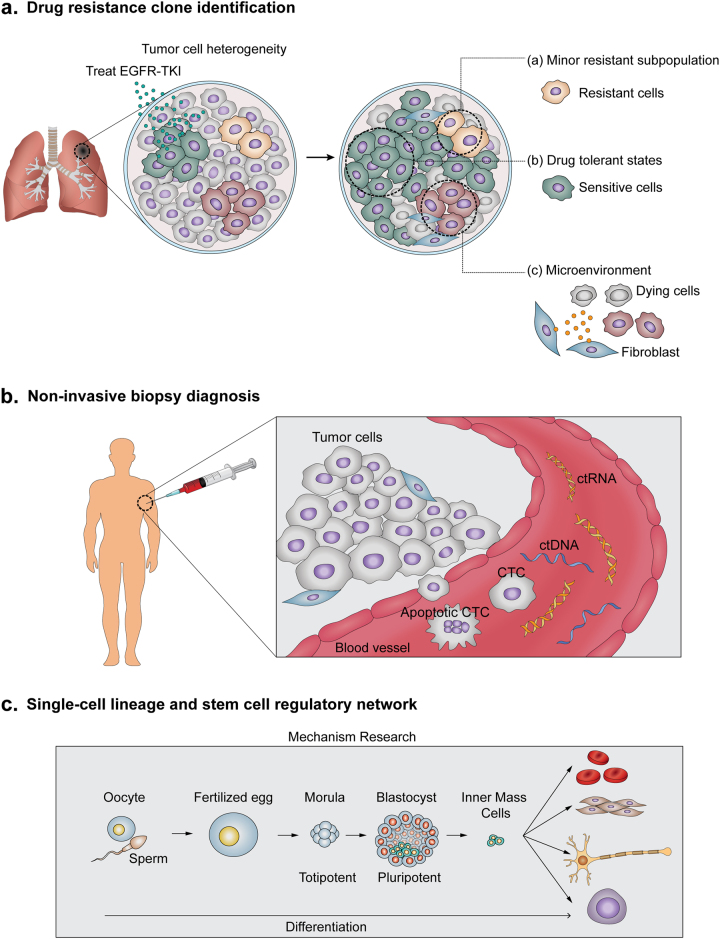
Rapid progress in the development of next-generation sequencing (NGS) technologies in recent years has provided many valuable insights into complex biological systems, ranging from cancer genomics to diverse microbial communities. NGS-based technologies for genomics, transcriptomics, and epigenomics are now increasingly focused on the characterization of individual cells. These single-cell analyses will allow researchers to uncover new and potentially unexpected biological discoveries relative to traditional profiling methods that assess bulk populations. Single-cell RNA sequencing (scRNA-seq), for example, can reveal complex and rare cell populations, uncover regulatory relationships between genes, and track the trajectories of distinct cell lineages in development. In this review, we will focus on technical challenges in single-cell isolation and library preparation and on computational analysis pipelines available for analyzing scRNA-seq data. Further technical improvements at the level of molecular and cell biology and in available bioinformatics tools will greatly facilitate both the basic science and medical applications of these sequencing technologies.


Conflict of interest statement

The authors declare that they have no conflict of interest.

Figures

Fig. 1
Fig. 1. Single-cell isolation and library preparation.
a The limiting dilution method isolates individual cells, leveraging the statistical distribution of diluted cells. b Micromanipulation involves collecting single cells using microscope-guided capillary pipettes. c FACS isolates highly purified single cells by tagging cells with fluorescent marker proteins. d Laser capture microdissection (LCM) utilizes a laser system aided by a computer system to isolate cells from solid samples. e Microfluidic technology for single-cell isolation requires nanoliter-sized volumes. An example of in-house microdroplet-based microfluidics (e.g., Drop-Seq). f The CellSearch system enumerates CTCs from patient blood samples by using a magnet conjugated with CTC binding antibodies. g A schematic example of droplet-based library generation. Libraries for scRNA-seq are typically generated via cell lysis, reverse transcription into first-strand cDNA using uniquely barcoded beads, second-strand synthesis, and cDNA amplification
Fig. 2
Fig. 2. A schematic overview of scRNA-seq analysis pipelines.
scRNA-seq data are inherently noisy with confounding factors, such as technical and biological variables. After sequencing, alignment and de-duplication are performed to quantify an initial gene expression profile matrix. Next, normalization is performed with raw expression data using various statistical methods. Additional QC can be performed when using spike-ins by inspecting the mapping ratio to discard low-quality cells. Finally, the normalized matrix is then subjected to main analysis through clustering of cells to identify subtypes. Cell trajectories can be inferred based on these data and by detecting differentially expressed genes between clusters
Fig. 3
Fig. 3. Methods for the quantification of expression in scRNA-seq.
a Reads per kilobase (RPK) is defined by multiplying the read counts of an isoform (i) by 1000 and dividing by isoform length. Reads per kilobase per million (RPKM) is defined to compare experiments or different samples (cells) so that additional normalization by the total fragment count is integrated in the denominator term, which is expressed in millions. b The metric TPM takes other isoforms into account, which contrasts with the RPKM metric. This metric quantifies the abundance of isoforms (i) using the RPK fraction across isoforms. c A schematic example illustrates the difference between the RPKM and TPM measures. TPM is efficient for measuring relative abundance because total normalized reads are constant across different cells. d However, we should be careful to interpret the fact that differentially expressed genes can be falsely annotated as a result of overexpression of the other isoforms
Fig. 4
Fig. 4. Addressing confounding factors in scRNA-seq.
a Technical batch effects are a well-known problem in scRNA-seq when the experiment (condition) is conducted in different plates (environment). Cell-specific scaling factors, such as capture and RT efficiency, dropout/amplification bias, dilution factor, and sequencing amount, must be considered in the normalization step. b Single-cell latent variable model (scLVM) can effectively remove the variation explained by the cell-cycle effect. The clear separation is lost in scLVM-corrected expression data using PCA (visualization adapted from ref. ). c The expression value y can be modeled as a linear combination of r technical and biological factors and k latent factors with a noise matrix
Fig. 5
Fig. 5. Applications of scRNA-seq computational approaches.
Cells are living in a dynamic context interacting with their surrounding environment. PCA can be used to identify known and unknown cell clusters. Cell hierarchy reconstruction can be performed after 2D projection of normalized gene expression profiles. Decoding the regulatory network integrates pseudotime-inferred trajectories and clustering gene expression information in 2D space
Fig. 6
Fig. 6. Many facets of scRNA-seq applications.
a Intratumor heterogeneity poses challenges in cancer genomics. scRNA-seq can tackle this problem by effectively identifying subgroups based on responsiveness in various contexts. b Liquid biopsy provides exciting opportunities, and scRNA-seq of CTCs could provide novel insights into biomarker characterization. c scRNA-seq can infer lineage information from the early developmental stage and can identify novel differential markers

References

    1. Li L, Clevers H. Coexistence of quiescent and active adult stem cells in mammals. Science. 2010;327:542–545. doi: 10.1126/science.1180794. - DOI - PMC - PubMed
    1. Huang S. Non-genetic heterogeneity of cells in development: more than just noise. Development. 2009;136:3853–3862. doi: 10.1242/dev.035139. - DOI - PMC - PubMed
    1. Shalek AK, et al. Single cell RNA Seq reveals dynamic paracrine control of cellular variation. Nature. 2014;510:363–369. doi: 10.1038/nature13437. - DOI - PMC - PubMed
    1. Eldar A, Elowitz MB. Functional roles for noise in genetic circuits. Nature. 2010;467:167–173. doi: 10.1038/nature09326. - DOI - PMC - PubMed
    1. Maamar H, Raj A, Dubnau D. Noise in gene expression determines cell fate in Bacillus subtilis. Science. 2007;317:526–529. doi: 10.1126/science.1140818. - DOI - PMC - PubMed

Publication types