. 2018 Aug;560(7718):382-386.
doi: 10.1038/s41586-018-0392-8. Epub 2018 Aug 8.

Exosomal PD-L1 contributes to immunosuppression and is associated with anti-PD-1 response

Affiliations

Exosomal PD-L1 contributes to immunosuppression and is associated with anti-PD-1 response

Gang Chen et al. Nature. 2018 Aug.

Abstract

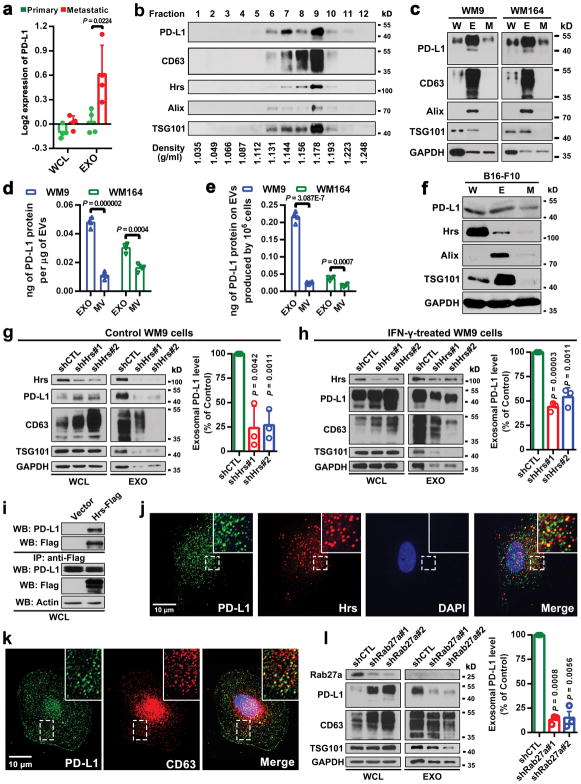
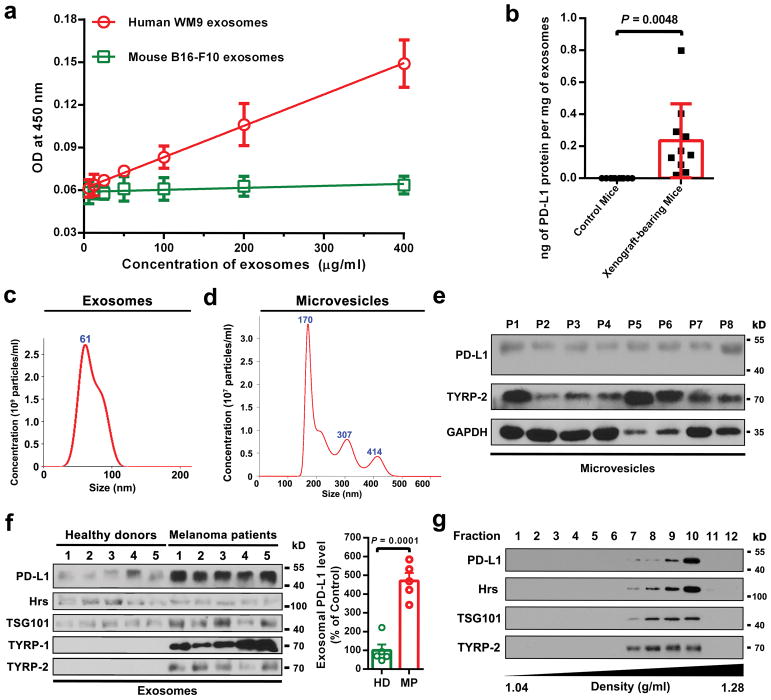
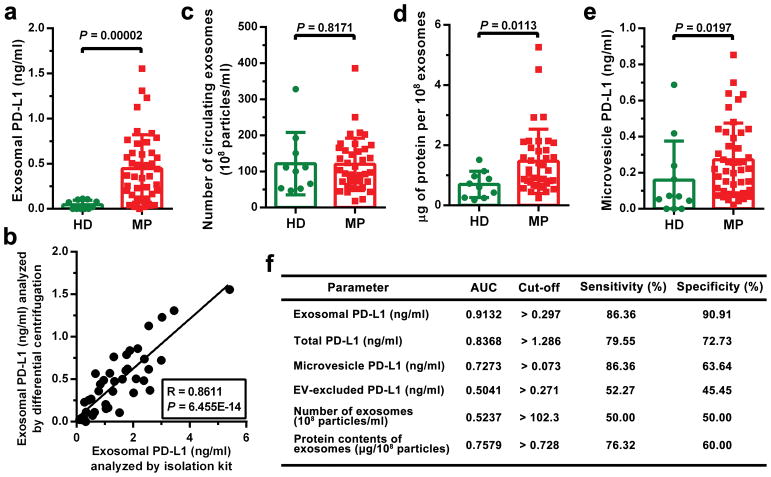
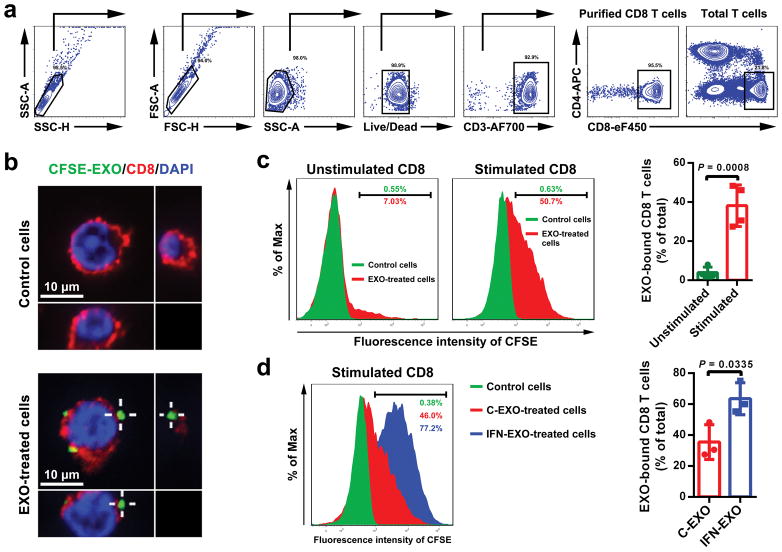
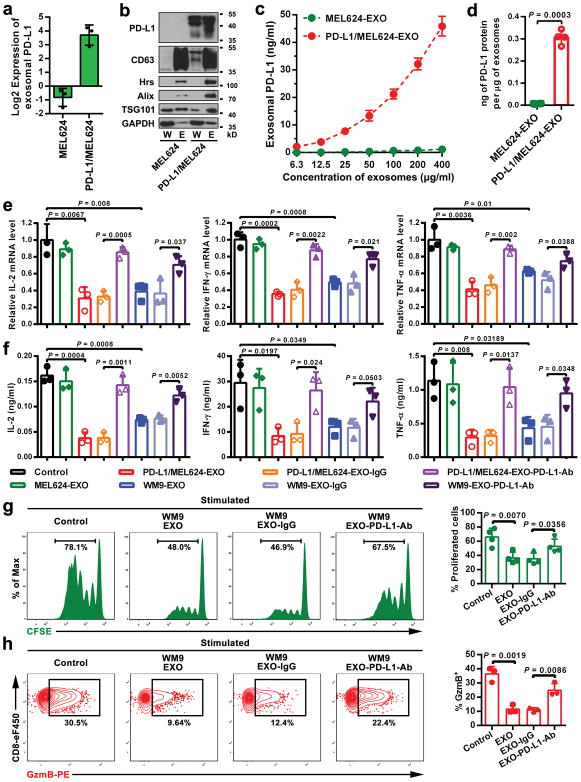
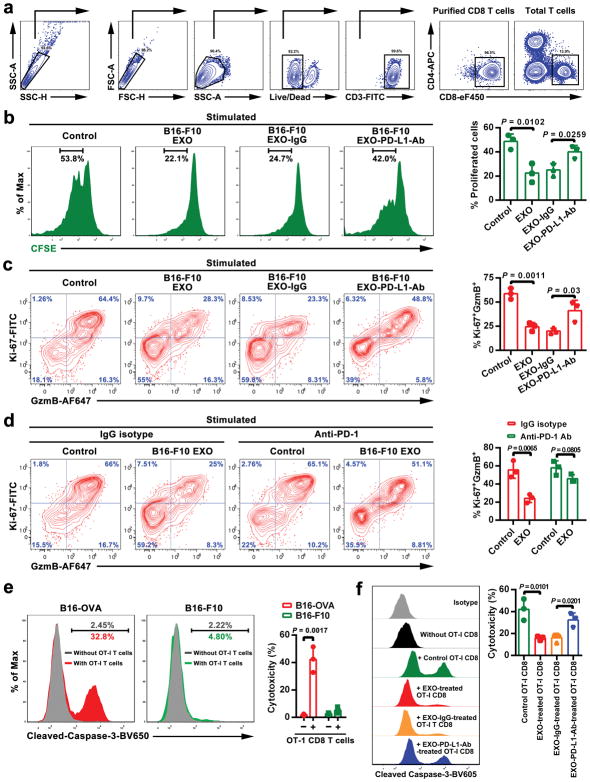
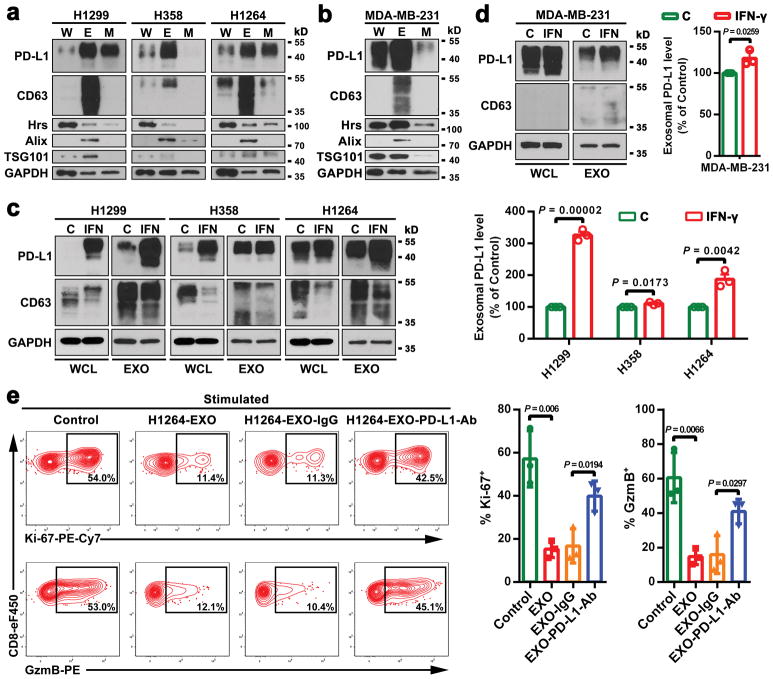
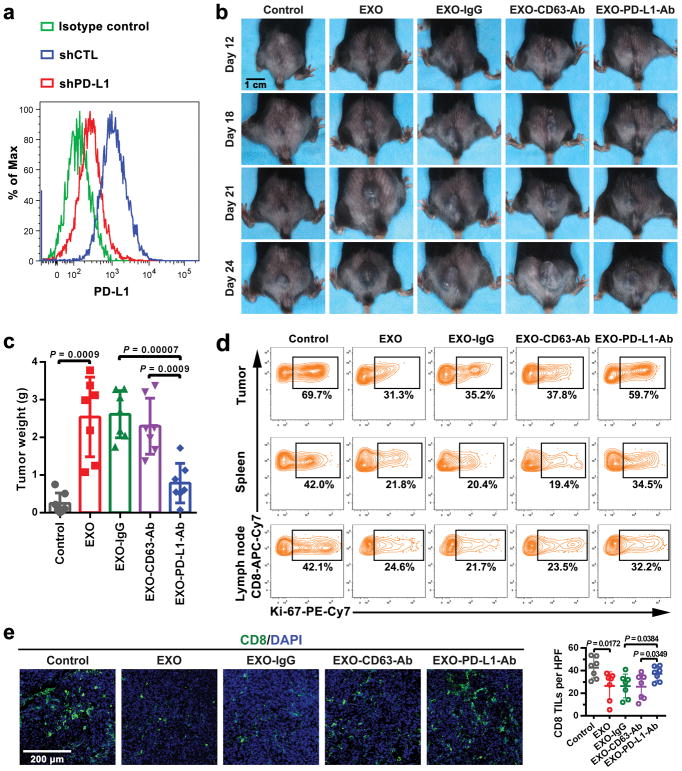
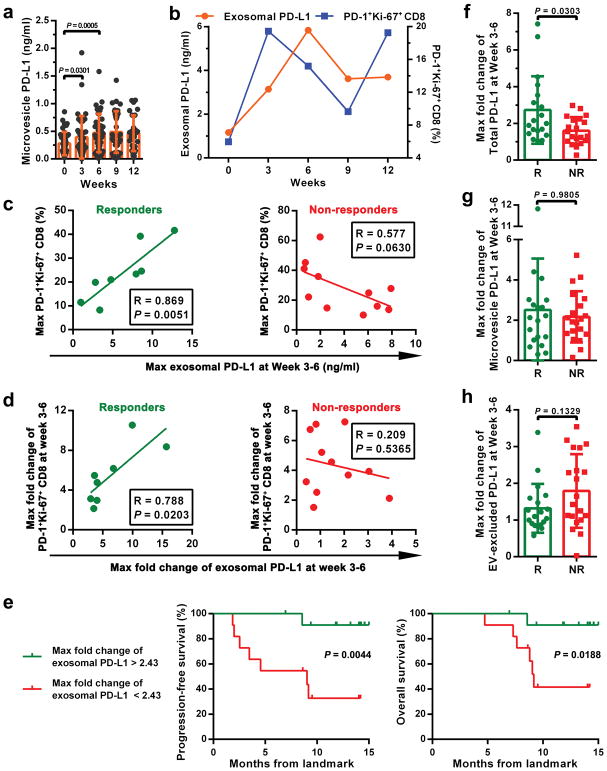
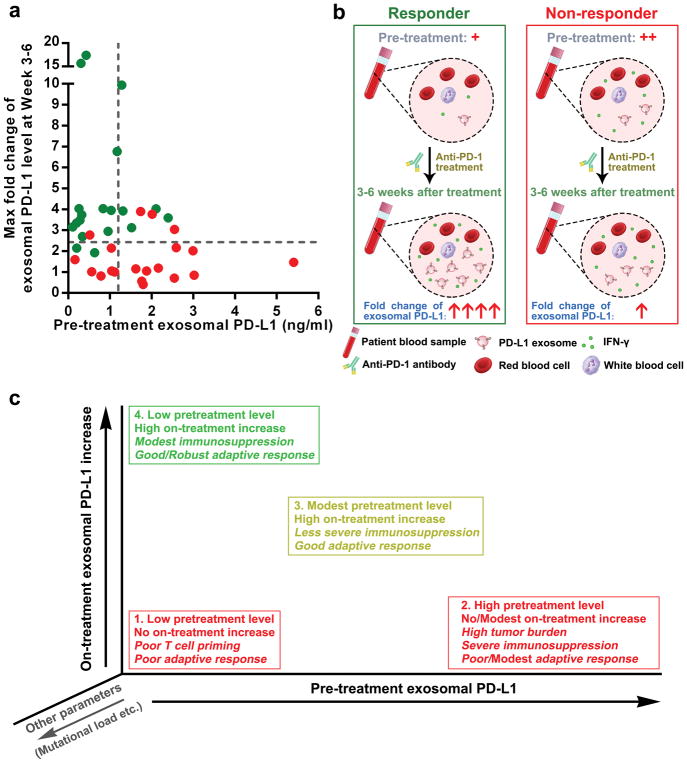
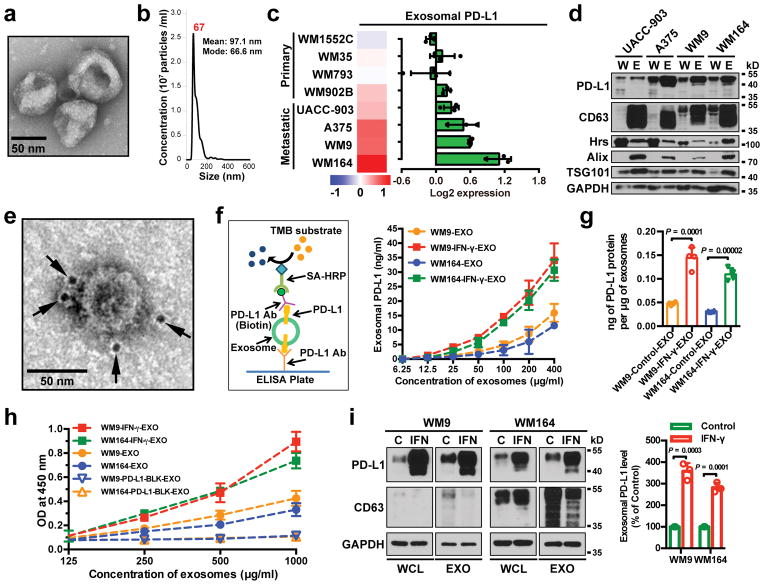
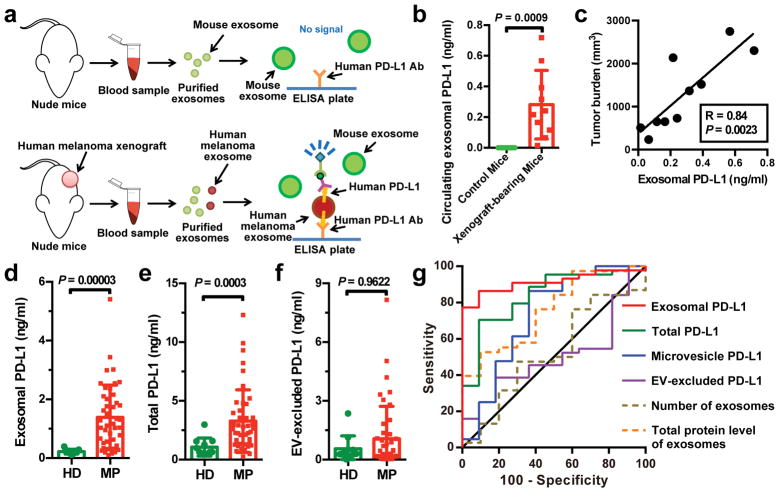
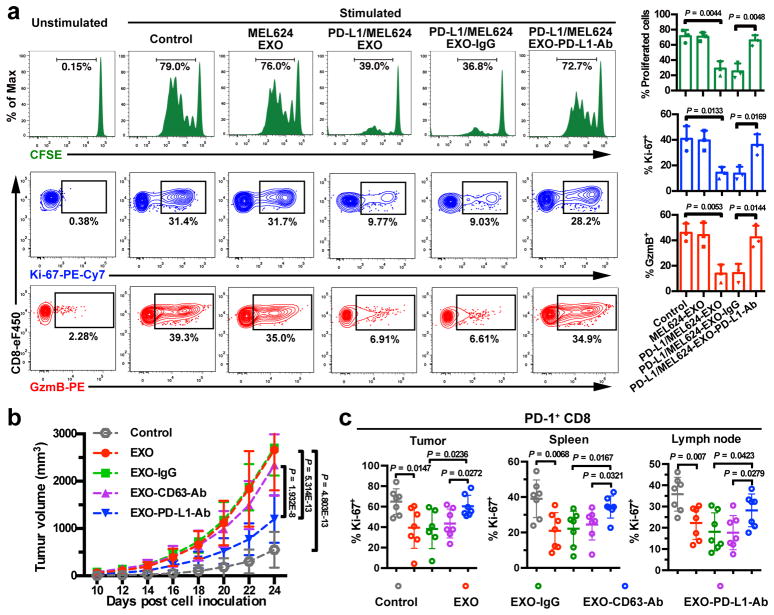
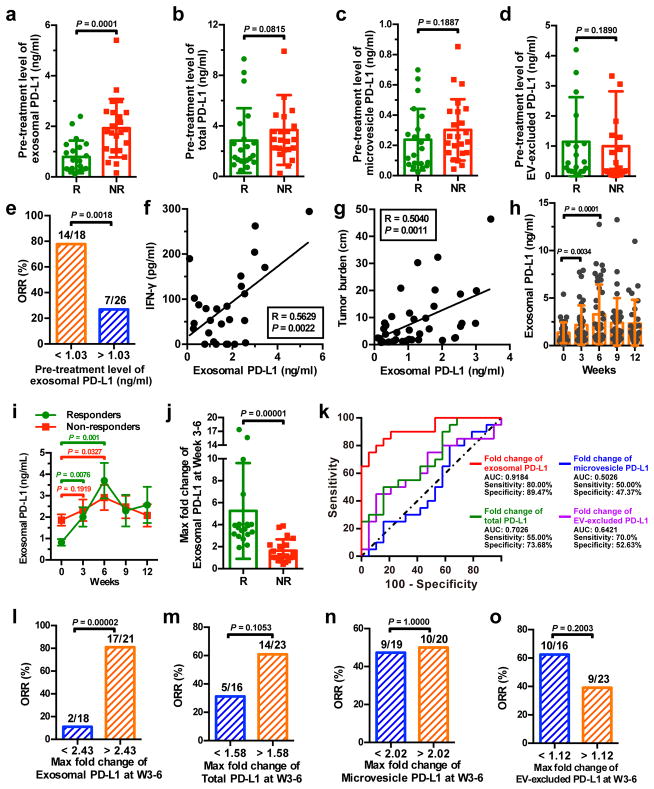
Tumour cells evade immune surveillance by upregulating the surface expression of programmed death-ligand 1 (PD-L1), which interacts with programmed death-1 (PD-1) receptor on T cells to elicit the immune checkpoint response1,2. Anti-PD-1 antibodies have shown remarkable promise in treating tumours, including metastatic melanoma2-4. However, the patient response rate is low4,5. A better understanding of PD-L1-mediated immune evasion is needed to predict patient response and improve treatment efficacy. Here we report that metastatic melanomas release extracellular vesicles, mostly in the form of exosomes, that carry PD-L1 on their surface. Stimulation with interferon-γ (IFN-γ) increases the amount of PD-L1 on these vesicles, which suppresses the function of CD8 T cells and facilitates tumour growth. In patients with metastatic melanoma, the level of circulating exosomal PD-L1 positively correlates with that of IFN-γ, and varies during the course of anti-PD-1 therapy. The magnitudes of the increase in circulating exosomal PD-L1 during early stages of treatment, as an indicator of the adaptive response of the tumour cells to T cell reinvigoration, stratifies clinical responders from non-responders. Our study unveils a mechanism by which tumour cells systemically suppress the immune system, and provides a rationale for the application of exosomal PD-L1 as a predictor for anti-PD-1 therapy.


Conflict of interest statement

COMPETING INTERESTS

W.G., C.G., and X. Xu. are listed as inventors on a patent owned by the University of Pennsylvania related to this work. W.G. and X. Xu. serve on the Scientific Advisory Board and have equities in Exo Bio, a company that has licensed the patent from the University of Pennsylvania.

Figures

Extended Data Figure 1
Extended Data Figure 1. Melanoma cells release EVs carrying PD-L1
a, The Log2 transformed RPPA data showing a higher level of exosomal PD-L1 secreted by metastatic melanoma cell lines compared with primary melanoma cell lines. Data represent mean ± s.d. of four primary (WM1552C, WM35, WM793, WM902B) or metastatic (UACC-903, 1205Lu, WM9, WM164) melanoma lines. b, Density gradient centrifugation confirming that PD-L1 secreted by WM9 cells co-fractionated with exosome markers CD63, Hrs, Alix, and TSG101. c, Immunoblots for PD-L1 in the whole cell lysate (“W”), purified exosomes (“E”), or microvesicles (“M”) from different metastatic melanoma cell lines. The same protein amounts of whole cell lysates, exosome and microvesicle proteins were loaded. d, Levels of PD-L1 on the exosomes or microvesicles derived from melanoma cells as assayed by ELISA. e, The levels of exosomal PD-L1 and microvesicle PD-L1 produced by an equal number of melanoma cells. f, Immunoblots for PD-L1 in the whole cell lysate, purified exosomes or microvesicles from mouse melanoma B16-F10 cells. The same protein amounts of whole cell lysates, exosome and microvesicle proteins were loaded. g, h, Western blot analysis of PD-L1 in HRS knockdown cells without (g) or with (h) IFN-γ treatment. Quantification of the western blotting data (right panel). i, Co-immunoprecipitation of PD-L1 and Hrs from MEL624 cells expressing exogenous PD-L1 and Hrs. j, Immunofluorescence staining of intracellular PD-L1 and exosome marker Hrs in WM9 cells treated with IFN-γ. k, Immunofluorescence staining of intracellular PD-L1 and CD63 in WM9 cells treated with IFN-γ. l, Western blotting analysis showing intracellular accumulation of PD-L1, and decreased exosomal secretion of PD-L1 in WM9 cells with RAB27A knockdown (left). The levels of exosomal PD-L1 were compared (right). Two experiments were repeated independently with similar results (b, c, f, ik). Data represent mean ± s.d. of four (d, e), or three (g, h, l) independent biological replicates. Statistical analysis is performed by two-sided unpaired t-test (a, d, e, g, h, l). For gel source data (b, c, fi, l), see Supplementary Fig. 1.
Extended Data Figure 2
Extended Data Figure 2. Melanoma cells secrete exosomal PD-L1 into the circulation
a, The monoclonal antibodies against the extracellular domain of human PD-L1 specifically detect human exosomal PD-L1, but not mouse exosomal PD-L1 (n = 3 independent biological experiments) b, Levels of human PD-L1 (ng) in the exosomes from the plasma of control nude mice (n = 10) and human WM9 melanoma xenograft-bearing nude mice (n = 10) per μg of total circulating exosomal proteins. c, Characterization of circulating exosomes purified from the plasma of a patient with Stage IV melanoma using NanoSight nanoparticle tracking analysis. d, Characterization of circulating microvesicles purified from the plasma sample of a patient with Stage IV melanoma using NanoSight nanoparticle tracking analysis. e, Immunoblots for PD-L1 in the microvesicles purified from the plasma samples of 8 patients with Stage IV melanoma (denoted as “P1” to “P8”). f, Immunoblots for PD-L1 in the exosomes purified from the plasma samples of 5 healthy donors and 5 patients with Stage IV melanoma (left panel). Quantification of the levels of exosomal PD-L1 by western blot analysis (right panel). Results are expressed as the percentage of the mean value of healthy donors. g, Standard density gradient centrifugation analysis showing that circulating PD-L1 co-fractionated with exosome markers Hrs and TSG101 and melanoma-specific marker TYRP-2. Three (c, d) or two (e, g) experiments were repeated independently with similar results. Data represent mean ± s.d. (a, b, f). Statistical analyses were performed using two-sided unpaired t-test (b, f). For gel source data (eg), see Supplementary Fig. 1.
Extended Data Figure 3
Extended Data Figure 3. The number or bulk protein level of circulating exosomes shows no or modest difference between healthy donors and patients with metastatic melanoma
a, ELISA showing the level of PD-L1 on circulating exosomes purified from healthy donors (“HD”, n = 11) and melanoma patients (“MP”, n = 44). The exosomes were purified using differential centrifugation. b, Pearson correlation between the ELISA-detected levels of PD-L1 on circulating exosomes purified by differential centrifugation or using the commercial exosome isolation kit (n = 44). c, Comparison of the number of circulating exosomes between healthy donors (n = 10) and melanoma patients (n = 38). d, Comparison of the protein content of circulating exosomes between healthy donors (n = 10) and melanoma patients (n = 38). e, ELISA of the circulating level of microvesicle PD-L1 in healthy donors (“HD”, n = 11) and melanoma patients (“MP”, n = 44). f, Detailed data associated with the ROC curve analysis depicted in Fig. 2g. Data represent mean ± s.d. Statistical analyses are performed by two-sided unpaired t-test (a, ce).
Extended Data Figure 4
Extended Data Figure 4. Melanoma cell-derived exosomes bind to CD8 T cells on their surface
a, Representative contour plots showing the general gating strategy used to identify the purified CD8 T cells (CD3+CD8+CD4) from human peripheral blood. b, Confocal microscopy analysis of human peripheral CD8 T cells (stimulated with anti-CD3/CD28 antibodies) after incubation with CFSE-labeled WM9 cell-derived exosomes for 2 hr. The experiments were repeated three times independently with similar results. c, Representative histogram of human peripheral CD8 T cells with or without anti-CD3/CD28 antibody stimulation after incubation with CFSE-labeled WM9 cell-derived exosomes for 2 hr (left panel). The proportion of exosome-bound cells is shown at the right panel. d, Representative histogram of human peripheral CD8 T cells (stimulated with anti-CD3/CD28 antibodies) after incubation with CFSE-labeled exosomes purified from control or IFN-γ-treated WM9 cells for 2 hr (left panel). The proportion of EXO-bound cells is shown at the right panel. Data represent mean ± s.d. of four (c) or three (d) independent biological replicates. Statistical analyses are performed using two-sided unpaired t-test (c, d).
Extended Data Figure 5
Extended Data Figure 5. Functional inhibition of CD8 T cells by exosomal PD-L1
a, The Log2 transformed RPPA data showing the levels of PD-L1 in the exosomes secreted by control (MEL624) or PD-L1-expressing (PD-L1/MEL624) human melanoma MEL624 cells (Bottom). b, Immunoblots for PD-L1 in the whole cell lysate (“W”) or in the purified exosomes (“E”) from MEL624 or PD-L1/MEL624 cells. The same amounts of whole cell lysates and exosomal proteins for each cell line were loaded. The experiments were repeated two times independently with similar results. For source data, see Supplementary Fig. 1. c, PD-L1 on the surface of exosomes secreted by MEL624 or PD-L1/MEL624 cells as determined by ELISA. d, Levels of PD-L1 on exosomes secreted by MEL624 or PD-L1/MEL624 cells, as measured by ELISA. e, Real-time PCR analyses of IL-2, IFN-γ, and TNF-α in human peripheral CD8 T cells (stimulated with anti-CD3/CD28 antibodies) after treatment with MEL624 cell-derived exosomes, PD-L1/MEL624 cell-derived exosomes or WM9-cell-derived exosomes with or without blocking by IgG isotype or the anti-PD-L1 antibodies. The relative mRNA expression level was calculated as the ratio to the control cells. f, ELISA of IL-2, IFN-γ, and TNF-α in human peripheral CD8 T cells (stimulated with anti-CD3/CD28 antibodies) after treatment with MEL624 cell-derived exosomes, PD-L1/MEL624 cell-derived exosomes or WM9-cell-derived exosomes with or without blocking by IgG isotype or PD-L1 antibodies. g, Representative histogram of CFSE-labeled human peripheral CD8 T cells (stimulated with anti-CD3/CD28 antibodies) after treatment with WM9 cell-derived exosomes with or without antibody blocking (left). The proportion of cells with diluted CFSE dye is shown at the right panel. h, Representative contour plots of human peripheral CD8 T cells (stimulated with anti-CD3/CD28 antibodies) examined for the expression of Granzyme B (GzmB) after treatment with WM9 cell-derived exosomes with or without antibody blocking (left). The percentage of GzmB+ CD8 T cells stimulated with anti-CD3/CD28 antibodies is shown at the right panel. Data represent mean ± s.d. of three (a, c, e, f, h) or four (d, g) independent biological replicates. Statistical analyses are performed using two-sided unpaired t-test (d–h).
Extended Data Figure 6
Extended Data Figure 6. Exosomal PD-L1 secreted by mouse melanoma B16-F10 cells inhibits the proliferation and cytotoxicity of mouse splenic CD8 T cells
a Representative contour plots showing the general gating strategy used to identify the purified CD8 T cells (CD3+CD8+CD4) from mouse splenocytes. b, Representative histogram of CFSE-labeled mouse splenic CD8 T cells (stimulated with anti-CD3/CD28 antibodies) after treatment with B16-F10 cell-derived exosomes with or without blocking by IgG isotype or the anti-PD-L1 antibodies (left). The proportion of cells with diluted CFSE dye is shown at the right panel. c, Representative contour plots of mouse splenic CD8 T cells (stimulated with anti-CD3/CD28 antibodies) examined for the expression of Ki-67 and Granzyme B (GzmB) after treatment with B16-F10 cell-derived exosomes with or without blocking by IgG isotype or the anti-PD-L1 antibodies (left). The percentage of Ki-67+GzmB+ CD8 T cells stimulated with anti-CD3/CD28 antibodies is shown at the right panel. d, Representative contour plots of mouse splenic CD8 T cells (stimulated with anti-CD3/CD28 antibodies) examined for the expression of Ki-67 and GzmB after treatment with B16-F10 cell-derived exosomes in the presence or absence of anti-PD-1 blocking antibodies (left). The percentage of Ki-67+GzmB+ CD8 T cells stimulated with anti-CD3/CD28 antibodies is shown at the right panel. e, OT-I CD8 T cell-meditated tumor cell killing assay was performed in B16-OVA cells with PD-L1 knockdown, or B16-F10 cells with PD-L1 knockdown (negative control). Apoptosis of tumor cells was evaluated by flow cytometric analysis of intracellular cleaved caspase-3 (left), and the relative cytotoxicity was calculated (right). f, OT-I CD8 T cells, activated by OVA-pulsed bone marrow-derived dendritic cells and treated with PBS (as a control), exosomes derived from B16-F10 cells with or without IgG isotype or PD-L1 antibody blocking, were co-cultured with PD-L1 knockdown B16-OVA cells for 48 hr. Tumor cell apoptosis was evaluated by flow cytometric analysis of intracellular cleaved caspase-3 (left), and the relative cytotoxicity was calculated (right). Data represent mean ± s.d. of three (b–f) independent biological replicates. Statistical analyses are performed using two-sided unpaired t-test (b–f).
Extended Data Figure 7
Extended Data Figure 7. Lung cancer and breast cancer cells release extracellular vesicles carrying PD-L1
a, Immunoblots for PD-L1 in the whole cell lysate (“W”), purified exosomes (“E”), or microvesicles (“M”) from different lung cancer cell lines. The same amounts of proteins were loaded for each fraction. b, Immunoblots for PD-L1 in the whole cell lysate, purified exosomes, or microvesicles from the breast cancer cell line MDA-MB-231. The same amounts of proteins were loaded for each fraction. c, Immunoblots for PD-L1 in the whole cell lysate (“WCL”) or in the purified exosomes (“EXO”) from control (“C”) or IFN-γ-treated (“IFN”) lung cancer cells. The same amounts of exosome proteins from IFN-γ-treated and control cells were loaded (left panel). Quantification of the exosomal PD-L1 level determined by western blot analysis (right panel). d, Immunoblots for PD-L1 in the whole cell lysate or in the purified exosomes from control or IFN-γ-treated the breast cancer MDA-MB-231 cells. The same amounts of exosome proteins from IFN-γ-treated and control cells were loaded (left panel). Quantification of the exosomal PD-L1 level determined by western blot analysis (right panel). e, Representative contour plots of human peripheral CD8 T cells examined for the expression of Ki-67 and GzmB after treatment with H1264 cell-derived exosomes with or without blocking by IgG isotype or PD-L1 antibodies (left). The percentage of Ki-67+ or GzmB+ CD8 T cells is shown at the right panel. The experiments were repeated twice independently with similar results (a, b). Data represent mean ± s.d. of three (c-e) independent biological replicates. Statistical analyses are performed using two-sided unpaired t-test (c–e). For source data (ad), see Supplementary Fig. 1.
Extended Data Figure 8
Extended Data Figure 8. Exosomal PD-L1 facilitates melanoma growth in vivo
a, Representative flow cytometric histograms of B16-F10 cells examined for the expression of PD-L1 with or without PD-L1 knockdown. B16-F10 cells were stably depleted of PD-L1 using lentiviral shRNA against PD-L1 (“shPD-L1”) or the scrambled control shRNA (“shCTL”). The experiment was repeated twice independently with similar results. b, Representative images showing the growth of PD-L1 knockdown B16-F10 tumors in C57BL/6 mice after indicated treatments. Experiments were performed using 7 mice for each group. c, The weights of PD-L1 knockdown B16-F10 tumors from C57BL/6 mice with indicated treatments (n = 7 mice per group). Data represent mean ± s.d. d, Representative contour plot of CD8 TILs or splenic or lymph node CD8 T cells examined for the expression of Ki-67 after indicated treatments. Experiments were performed using 7 mice for each group. See Fig. 3c for quantification data. e, Representative immunofluorescence images of CD8 TILs in tumor tissues (left). The number of CD8 TILs for each mouse (n = 7 mice per group) were quantified from 5 high-power fields (“HPF”) (right). Statistical analysis is performed using two-sided unpaired t-test (c, e).
Extended Data Figure 9
Extended Data Figure 9. The level of circulating exosomal PD-L1 distinguishes the clinical responders from non-responders to pembrolizumab treatment
a, The levels of PD-L1 on circulating microvesicles at serial time points pre- and on-treatment (n = 39). b, The frequency of PD-1+ Ki-67+ CD8 T cells and the level of circulating exosomal PD-L1 in clinical responders at serial time points pre- and on-treatment (n = 8). c, Pearson correlation of the maximum level of circulating exosomal PD-L1 at Week 3–6 to the maximum frequency of PD-1+Ki-67+ CD8 T cells at Week 3–6 in clinical responders (n = 8) and non-responders (n = 11). d, Pearson correlation of the maximum fold change of circulating exosomal PD-L1 level at Week 3–6 to the maximum fold change of PD-1+Ki-67+ CD8 T cells at Week 3–6 in clinical responders (n = 8) and non-responders (n = 11). e, Kaplan-Meier progression-free and overall survival of patients with high (n = 11) and low (n = 12) fold changes of circulating exosomal PD-L1 at 3–6 weeks. f, Comparison of the maximum fold change of total circulating PD-L1 at Week 3–6 between the clinical responders and non-responders. “R”: responders, n = 19; “NR”: non-responders, n = 20. g, Comparison of the maximum fold change of circulating microvesicle PD-L1 at Week 3–6 between the clinical responders (n = 19) and non-responders (n = 20). h, Comparison of the maximum fold change of EV-excluded PD-L1 at Week 3–6 between the clinical responders (n = 19) and non-responders (n = 20). Data represent mean ± s.d. Statistical analyses were performed using two-sided paired t-test (a), log-rank test (e), or two-sided unpaired t-test (f–h).
Extended Data Figure 10
Extended Data Figure 10. Circulating exosomal PD-L1 is a potential rationale-based and clinically accessible predictor for clinical outcomes of anti-PD-1 therapy
a, Tracking the levels of circulating exosomal PD-L1 before and during anti-PD-1 treatment may stratify responders (green) from non-responders (red) to anti-PD-1 therapy as early as 3–6 weeks into the treatment. b, Diagram for the potential application of circulating exosomal PD-L1 to predict patients’ response to anti-PD-1 therapy. The pre-treatment level of circulating exosomal PD-L1 is lower in metastatic melanoma patients with clinical response to anti-PD-1 therapy. After 3–6 weeks of anti-PD-1 treatment, the level of circulating exosomal PD-L1 increases significantly in clinical responders but not in non-responders. c, Tracking both the pre-treatment and on-treatment levels of circulating exosomal PD-L1 may help define the possible reasons involved in the success (green) or failure (red) of the therapy.
Figure 1
Figure 1. Extrafacial expression of PD-L1 on melanoma cell-derived exosomes and its regulation by INF-γ
a, A representative TEM image of purified WM9 cell exosomes. b, Characterization of purified exosomes by NanoSight nanoparticle tracking system. c, RPPA data showing the level of PD-L1 in the exosomes secreted by primary or metastatic melanoma cell lines (n = 3 for WM1552C, WM902B, A375, WM164, and n = 4 for WM35, WM793, UACC-903, WM9). See Extended Data Fig. 1a for statistical analysis. d, Immunoblots for PD-L1 in the whole cell lysate (“W”) and purified exosomes (“E”) from different metastatic melanoma cell lines. The same amounts of proteins in whole cell lysates and exosome were loaded. e, A representative TEM image of WM9 cell-derived exosomes immunogold-labeled with anti-PD-L1 antibodies. Arrowheads indicate 5-nm gold particles. f, Diagram of ELISA of exosomal PD-L1 (left panel). PD-L1 on the surface of exosomes was determined. See Methods for details. g, Levels of PD-L1 on exosomes from melanoma cells, with or without IFN-γ treatment, as measured by ELISA. h, PD-l binding of exosomes. See Methods for details. i, Western blot analysis of PD-L1 in exosomes from IFN-γ-treated cells (“IFN”) and control cells (“C”). The same amounts of exosome proteins were loaded (left panel). Quantification of exosomal PD-L1 by western blotting (right panel). The experiments were repeated three (a, b) or two (d, e) times independently with similar results obtained. Data represent mean ± s.d. of three (f, h, i) or four (g) independent biological replicates. Statistical analyses were performed using two-sided unpaired t-test (g, i). For source data (d, i), see Supplementary Fig. 1.
Figure 2
Figure 2. The level of PD-L1 on circulating exosomes distinguishes patients with metastatic melanoma from healthy donors
a, Diagram of ELISA of human exosomal PD-L1 in the plasma samples derived from mice harboring human melanoma xenograft. b, Levels of PD-L1 on exosomes isolated from the plasma samples of control or human WM9 melanoma xenograft-bearing nude mice as measured by ELISA (n = 10). c, Pearson correlation between the plasma level of exosomal PD-L1 and tumor burden in xenograft-bearing nude mice (n = 10). df, ELISA of the circulating level of exosomal PD-L1 (d), total PD-L1 (e), or EV-excluded PD-L1 (f) in healthy donors (“HD”, n = 11) and melanoma patients (“MP”, n = 44). g, ROC curve analysis for the indicated parameters in patients with metastatic melanoma compared to healthy donors. Data represent mean ± s.d. Statistical analyses were performed using two-sided unpaired t-test (b, df).
Figure 3
Figure 3. Exosomal PD-L1 inhibits CD8 T cells and facilitates the progression of melanoma in vitro and in vivo
a, Representative histogram of CFSE-labeled human peripheral CD8 T cells (left top), representative contour plots of human peripheral CD8 T cells examined for the expression of Ki-67 (left middle) and Granzyme B (GzmB) (left bottom) after indicated treatments. The proportions of cells with diluted CFSE dye, or positive Ki-67 or GzmB expression are shown at the right panel (n = 3 independent biological experiments). b, Growth curve of B16-F10 PD-L1 knockdown tumors with indicated treatments (n = 7 mice per group). c, The proportions of Ki-67+PD-1+ CD8 TILs or splenic or lymph node CD8 T cells after indicated treatments (n = 6 for tumor samples of the “EXO-IgG” group, and n = 7 for all the other groups). See Extended Data Fig. 8d for representative contour plots. Data represent mean ± s.d. (a–c). Statistical analyses were performed using two-sided unpaired t-test (a, c) or two-way ANOVA (b).
Figure 4
Figure 4. The level of circulating exosomal PD-L1 stratifies clinical responders from non-responders to pembrolizumab
a-d, Comparison of the pre-treatment levels of circulating exosomal PD-L1 (a), total PD-L1 (b), microvesicle PD-L1 (c), or EV-excluded PD-L1 (d) between melanoma patients with or without clinical response to pembrolizumab (“R”: responders, n = 21; “NR”: non-responders, n = 23). e, Objective response rate (“ORR”) for patients with high and low pre-treatment levels of circulating exosomal PD-L1. f, g, Pearson correlation of the IFN-γ level (f, n = 27) or overall tumor burden (g, n = 39) to the exosomal PD-L1 level in the plasma of melanoma patients. h, The levels of circulating exosomal PD-L1 at serial time points pre- and on-treatment (n = 39). i, The levels of circulating exosomal PD-L1 in clinical responders (n = 19) and non-responders (n = 20) at serial time points pre- and on-treatment. j, Comparison of the maximum fold change of circulating exosomal PD-L1 at Week 3–6 between the clinical responders and non-responders. k, ROC curve analysis for the max fold change of circulating exosomal PD-L1 at Week 3–6 in clinical responders compared to non-responders. l-o, Objective response rate for patients with high and low fold changes of circulating exosomal PD-L1 (l), total PD-L1 (m), microvesicle PD-L1 (n), or EV-excluded PD-L1 (o). Data represent mean ± s.d. *P < 0.05, Statistical analyses were performed using two-sided unpaired t-test (a–d, j), two-sided paired t-test (h, i), or two-sided Fisher’s exact test (e, l–o).

References

    1. Dong H, et al. Tumor-associated B7-H1 promotes T-cell apoptosis: a potential mechanism of immune evasion. Nat Med. 2002;8:793–800. - PubMed
    1. Chen L, Han X. Anti-PD-1/PD-L1 therapy of human cancer: past, present, and future. J Clin Invest. 2015;125:3384–3391. - PMC - PubMed
    1. Topalian SL, Taube JM, Anders RA, Pardoll DM. Mechanism-driven biomarkers to guide immune checkpoint blockade in cancer therapy. Nat Rev Cancer. 2016;16:275–287. - PMC - PubMed
    1. Ribas A, et al. Association of Pembrolizumab With Tumor Response and Survival Among Patients With Advanced Melanoma. JAMA. 2016;315:1600–1609. - PubMed
    1. Zaretsky JM, et al. Mutations Associated with Acquired Resistance to PD-1 Blockade in Melanoma. N Engl J Med. 2016;375:819–829. - PMC - PubMed

Publication types

MeSH terms