. 2018 Jul 25:9:1092.
doi: 10.3389/fpls.2018.01092. eCollection 2018.

Regulation of Ferredoxin-NADP+ Oxidoreductase to Cyclic Electron Transport in High Salinity Stressed Pyropia yezoensis

Affiliations

Regulation of Ferredoxin-NADP+ Oxidoreductase to Cyclic Electron Transport in High Salinity Stressed Pyropia yezoensis

Bin Yu et al. Front Plant Sci. .

Abstract

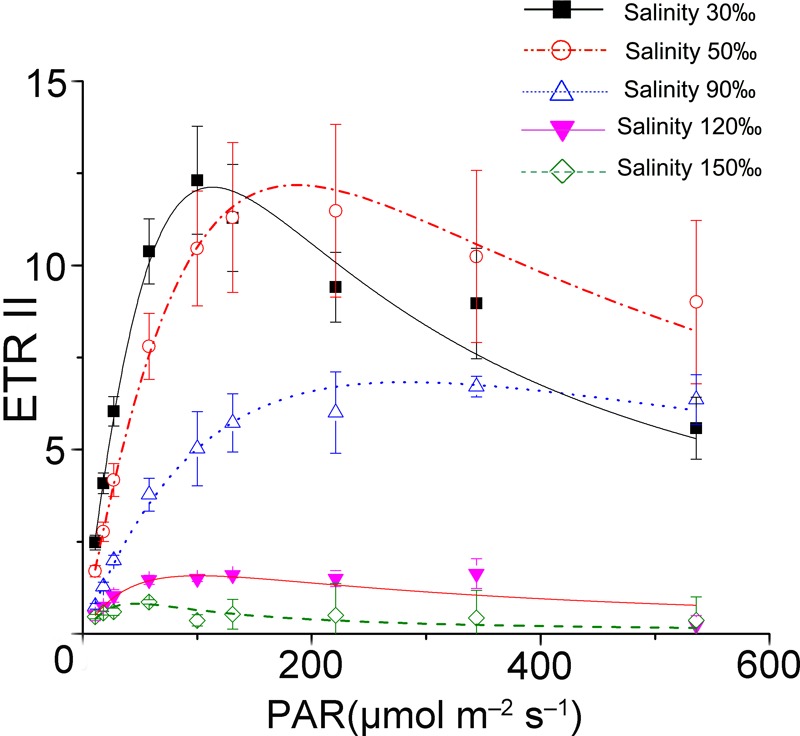
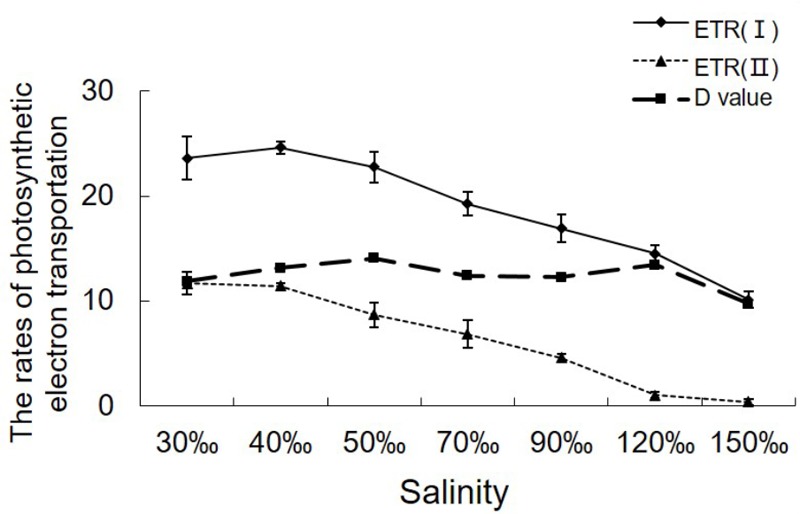
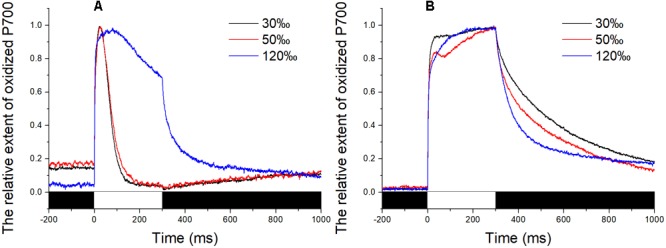
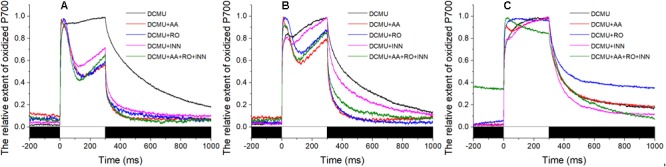
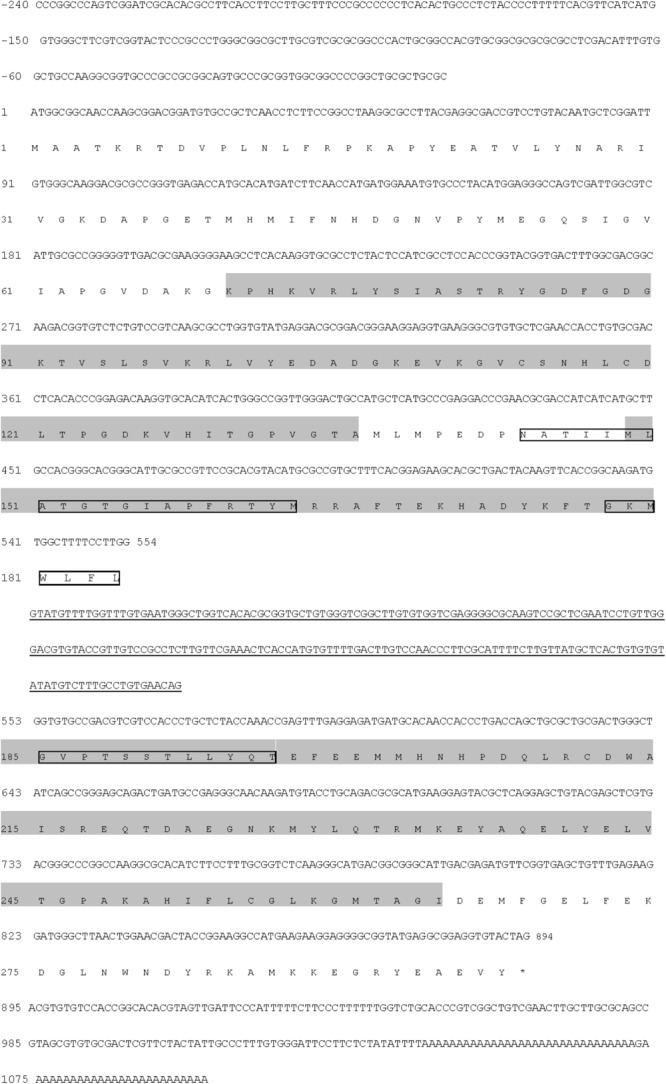
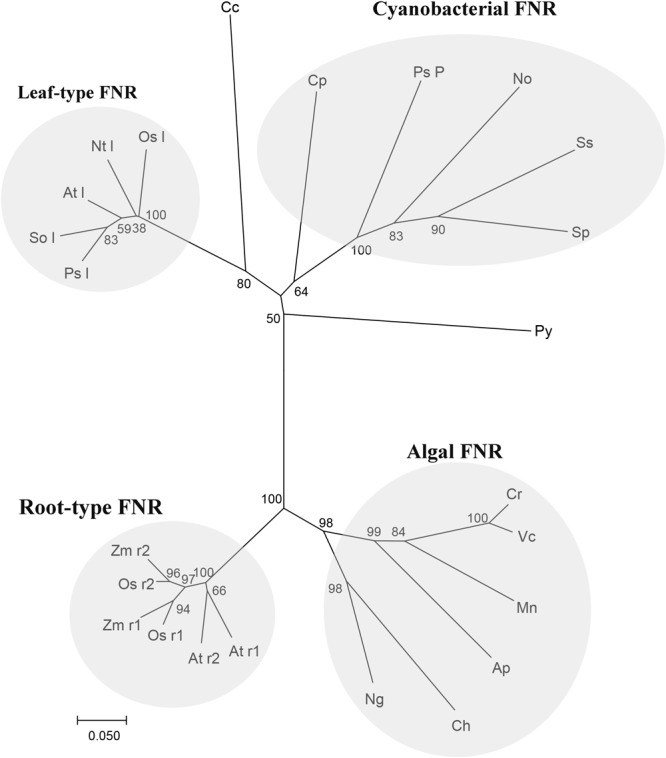
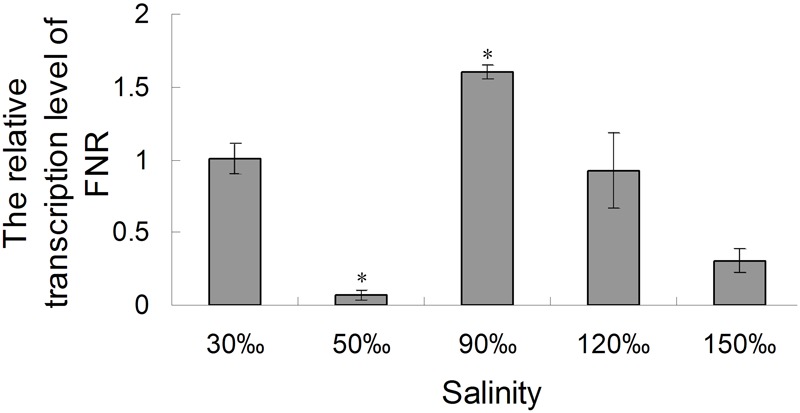
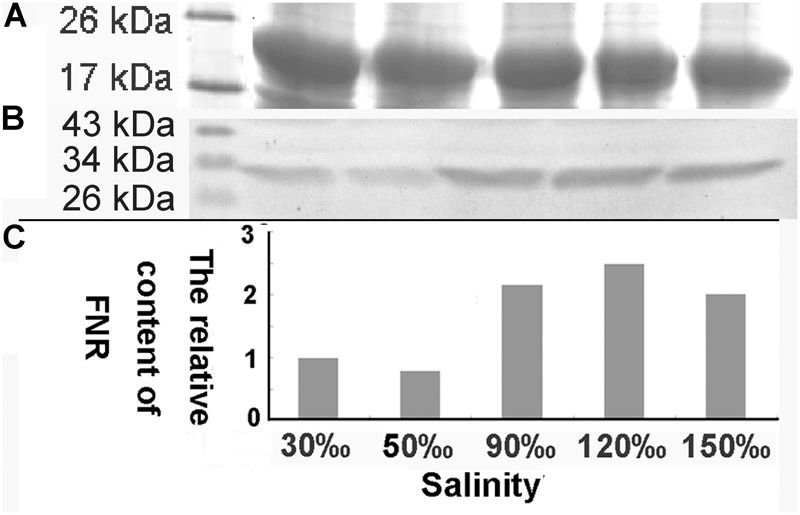
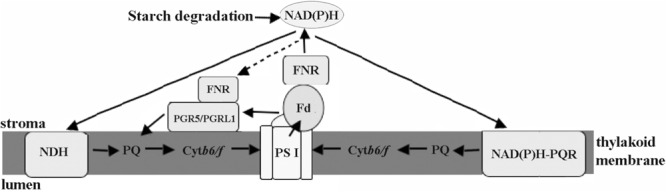
Pyropia yezoensis can survive the severe water loss that occurs during low tide, making it an ideal species to investigate the acclimation mechanism of intertidal seaweed to special extreme environments. In this study, we determined the effects of high salinity on photosynthesis using increasing salinity around algal tissues. Both electron transport rates, ETR (I) and ETR (II), showed continuous decreases as the salinity increased. However, the difference between these factors remained relatively stable, similar to the control. Inhibitor experiments illustrated that there were at least three different cyclic electron transport pathways. Under conditions of severe salinity, NAD(P)H could be exploited as an endogenous electron donor to reduce the plastoquinone pool in Py. yezoensis. Based on these findings, we next examined how these different cyclic electron transport (CETs) pathways were coordinated by cloning the gene (HM370553) for ferredoxin-NADP+ oxidoreductase (FNR). A phylogenetic tree was constructed, and the evolutionary relationships among different FNRs were evaluated. The results indicated that the Py. yezoensis FNR showed a closer relationship with cyanobacterial FNR. The results of both real-time polymerase chain reaction and western blotting showed that the enzyme was upregulated under 90-120‰ salinity. Due to the structure-function correlations in organism, Py. yezoensis FNR was proposed to be involved in NAD(P)H-dependent Fd+ reduction under severe salinity conditions. Thus, through the connection between different donors bridged by FNR, electrons were channeled toward distinct routes according to the different metabolic demands. This was expected to make the electron transfer in the chloroplasts become more flexible and to contribute greatly to acclimation of Py. yezoensis to the extreme variable environments in the intertidal zone.

Keywords: Pyropia yezoensis; electron transportation; environmental acclimation; ferredoxin-NADP+ reductase; stress responding.


Figures

FIGURE 1
FIGURE 1
Saturation curves of Py. yezoensis under different salinity stresses. The solid lines with filled squares indicate the control; the dashed lines with open circles represent samples stressed with 50‰ salinity; the dotted lines with upward-pointing open triangles indicate the 90‰ salinity-treated algae; the solid lines with downward-pointing filled triangles indicate 120‰ salinity; and the dashed lines with open diamonds indicate 150‰ salinity-treated algae. Three independent determinations were performed, and the average values were analyzed using Origin2015 software to fit the saturation curves according to the following formula: ETR = PAR/(a × PAR2 + b × PAR + c).
FIGURE 2
FIGURE 2
Variations in the relative rates of photosynthetic electron transport in Py. yezoensis under different salinities. The ETR data were the means of five independent experiments (±SDs). D-values were derived from the differences between ETR (I) and ETR (II).
FIGURE 3
FIGURE 3
Time course of the P700+ signal in Py. yezoensis under different salinity stresses. The start point of the saturation pulse (SP) of 6,000 μmol m-2 s-1 was set as 0, and the duration of the SP was 300 ms. The value of the P700+ signal was normalized before plotting. (A) Time course results under different salinities. (B) Curve of the samples under DCMU. The bar under the coordinate system indicates the duration of different irradiation conditions. The white indicates the saturation flash and black indicates dark.
FIGURE 4
FIGURE 4
Effects of inhibitors of the P700+ signal under different salinity stresses with DCMU. (A) Curve of the samples in the normal seawater. (B) Curve of the samples stressed with 50‰ salinity. (C) Curve of the samples stressed with 120‰ salinity. Inhibitor solutions were prepared with seawater having different salinities and the stock solution. Inhibitor treatment was performed in the dark for 10 min using the Py. yezoensis thalli treated with the indicated salinity. The data are the means of three independent experiments (±SDs). C, control; AA, antimycin A; Ro, rotenone; INN, dicoumarol. The bar under the coordinate system indicates the duration of different irradiation conditions. The white indicates the saturation flash and black indicates dark.
FIGURE 5
FIGURE 5
Nucleotide and deduced amino acid sequences of the FNR gene from Py. yezoensis. Nucleotides of the cDNA are numbered in the 5′ to 3′ direction. Amino acids are numbered in the N- to C-terminal direction. The underlined sequence is the intron. The black shading indicates the conserved FAD- and NAD(P)-binding domains. The asterisk represents the termination codon tag. The possible transmembrane regions are labeled with textboxes.
FIGURE 6
FIGURE 6
Relationships among FNR amino-acid sequences. Neighbor joining tree based on FNR protein sequence of Py (Pyropia yezoensis): ADM64306.2 and the other 23 species, including Cp (Cyanophora paradoxa): Q00598, Nt l (Nicotiana tabacum leaf): O04977, So l (Spinacia oleracea leaf): AAA34029, Sp (Spirulina sp.): P00454, Ss (Synechocystis sp. PCC 6803): CAA63961, Ps l (Pisum sativum leaf): ABO87610, Ap (Auxenochlorella protothecoides): XP_011400423.1, At l (Arabidopsis thaliana leaf): NP_201420.1, At r1 (Arabidopsis thaliana root1): NP_001190682.1, At r2 (Arabidopsis thaliana root2): NP_849734.1, Ch (Chrysochromulina sp.): KOO53489.1, Cr (Chlamydomonas reinhardtii): XP_001697352.1, Mn (Monoraphidium neglectum): XP_013905631.1, Ng (Nannochloropsis gaditana): XP_005853875.1, Os l(Oryza sativa leaf): BAS95764.1, Os r1 (Oryza sativa root 1): BAF13390.1, Os r2 (Oryza sativa root 1):BAF20804.2, Ps P (Pseudanabaena sp. PCC 7367): WP_015165197.1, Vc (Volvox carteri): XP_002954986.1, Zm r1 (Zea mays root 1): ACG39703.1, Zm r2 (Zea mays root 2):ACG35047.1, Cc (Cyanidium caldarium): BAF42337.1 and No (Nostocaceae): BAO37114.1. Tree topology was inferred from maximum parsimony analyses, and the numbers at nodes were bootstrap support percentages of 1,000 replicates. Branch lengths were proportional to the level of sequence difference (note the scale bar). The four distinct branches are individually labeled on the right of the panel.
FIGURE 7
FIGURE 7
Real-time analysis of the relative expression of the FNR gene in Py. yezoensis under different salinities. A gene fragment from the EF-1α gene in the same sample was used as the internal control. The 2-ΔΔCt method was used to compare the relative fold changes in FNR, and the log2 of these variations was used to perform statistical analysis. Bars represent the mean values of three independent experiments ± SDs. P < 0.05 compared with the control.
FIGURE 8
FIGURE 8
Western blot analysis of FNR in samples treated with different salinity stress. (A) Western blot analysis of samples treated with different salinities (Mark, 30, 50, 90, 120, and 150‰). (B) Equal proteins of corresponding samples were separated on SDS-PAGE and stained with Coomassie brilliant blue R-250. (C) The relative content of FNR derived from the normalization of western blot band by the 19 kDa protein band in SDS-PAGE gel.
FIGURE 9
FIGURE 9
Schematic views of cyclic electron transport in Py. yezoensis. Three possible CET pathways around PSI were indicated by the arrows. The main CET pathway belonged to the PGR5/PGRL1-dependent CET using Fd as the electron donors. The other two pathways, NDH-dependent CET and the one mediated with rotenone-insensitive NAD(P)H-PQ oxidoreductase, were driven by NAD(P)H. FNR might be function as a regulator to maintain the proper contents of electron donors. PS I, photosystem I; Cytb6/f, cytochrome b6/f; Fd, Ferredoxin; FNR, ferredoxin NADP+ oxidoreductase; PQ, plastoquinone; NDH, NAD(P)H dehydrogenase; NAD(P)H-PQR, rotenone-insensitive NAD(P)H-PQ oxidoreductase. Black arrows show electron flows.

References

    1. Asada K. (1999). The water-water cycle in chloroplasts: scavenging of active oxygens and dissipation of excess photons. Annu. Rev. Plant Biol. 50 601–639. 10.1146/annurev.arplant.50.1.601 - DOI - PubMed
    1. Baker N. R. (1991). A possible role for photosystem II in environmental perturbations of photosynthesis. Physiol. Plant. 81 563–570. 10.1111/j.1399-3054.1991.tb05101.x - DOI
    1. Batie C. J., Kamin H. (1984). Ferredoxin-NADP+ oxidoreductase. Equilibria in binary and ternary complexes with NADP+ and ferredoxin. J. Biol. Chem. 259 8832–8839. - PubMed
    1. Ben-Amotz A., Avron M. (1973). The role of glycerol in the osmotic regulation of the halophilic alga Dunaliella parva. Plant Physiol. 51 875–878. 10.1104/pp.51.5.875 - DOI - PMC - PubMed
    1. Blouin N. A., Brodie J. A., Grossman A. C., Xu P., Brawley S. H. (2011). Porphyra: a marine crop shaped by stress. Trends Plant Sci. 16 29–37. 10.1016/j.tplants.2010.10.004 - DOI - PubMed

LinkOut - more resources