. 2015 Nov 1;6(11):6496-6504.
doi: 10.1039/c5sc02465j. Epub 2015 Aug 3.

Catalytic two-electron reduction of dioxygen catalysed by metal-free [14]triphyrin(2.1.1)

Affiliations

Catalytic two-electron reduction of dioxygen catalysed by metal-free [14]triphyrin(2.1.1)

Kentaro Mase et al. Chem Sci. .

Abstract

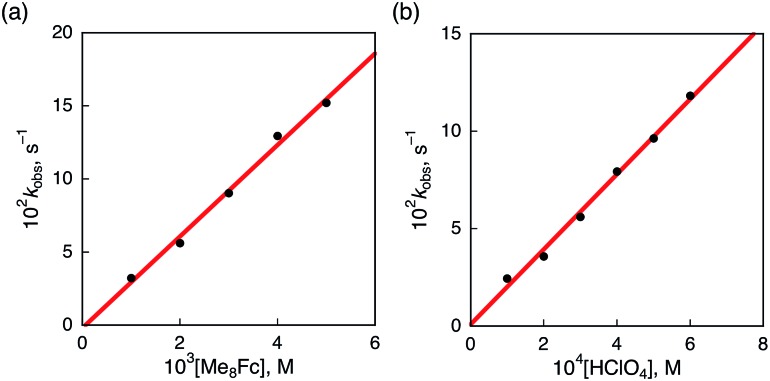
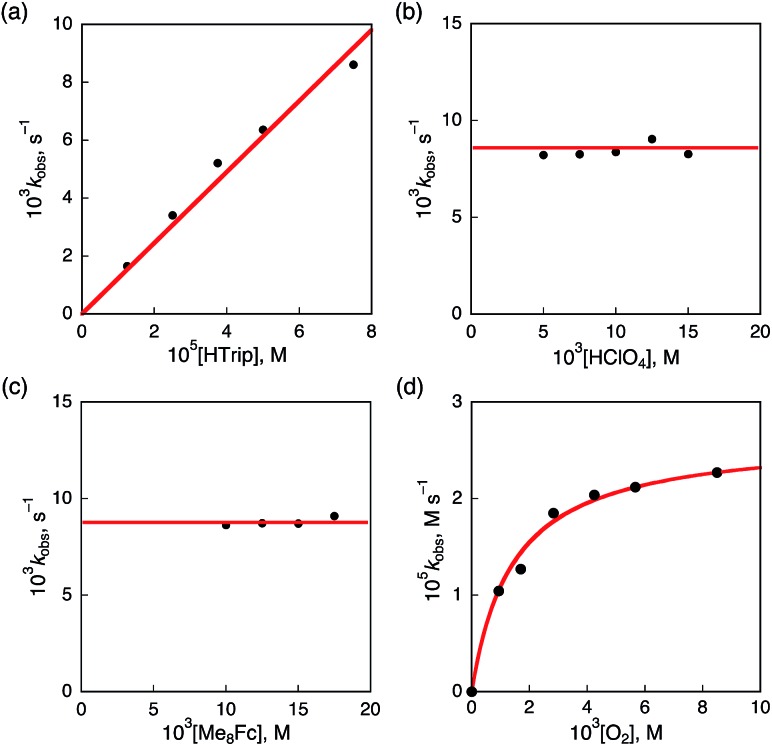
The catalytic two-electron reduction of dioxygen (O2) by octamethylferrocene (Me8Fc) occurs with a metal-free triphyrin (HTrip) in the presence of perchloric acid (HClO4) in benzonitrile (PhCN) at 298 K to yield Me8Fc+ and H2O2. Detailed kinetic analysis has revealed that the catalytic two-electron reduction of O2 by Me8Fc with HTrip proceeds via proton-coupled electron transfer from Me8Fc to HTrip to produce H3Trip˙+, followed by a second electron transfer from Me8Fc to H3Trip˙+ to produce H3Trip, which is oxidized by O2via formation of the H3Trip/O2 complex to yield H2O2. The rate-determining step in the catalytic cycle is hydrogen atom transfer from H3Trip to O2 in the H3Trip/O2 complex to produce the radical pair (H3Trip˙+ HO2˙) as an intermediate, which was detected as a triplet EPR signal with fine-structure by the EPR measurements at low temperature. The distance between the two unpaired electrons in the radical pair was determined to be 4.9 Å from the zero-field splitting constant (D).


Figures

Chart 1
Chart 1. Structure of HTrip.
Fig. 1
Fig. 1. (a) Absorption spectral changes of HTrip (2.0 × 10⁻⁵ M) upon the addition of HClO4 in air-saturated PhCN at 298 K. (b) Absorbance change profile at 565 nm.
Fig. 2
Fig. 2. Cyclic voltammograms (upper) and differential pulse voltammograms (lower) of deaerated PhCN solutions of HTrip (1.0 × 10⁻³ M) recorded in the presence of TBAPF6 (0.10 M) (a) without HClO4 and (b) with HClO4 (1.0 × 10⁻² M); sweep rate: 100 mV s–1 for CV and 4 mV s–1 for DPV.
Scheme 1
Scheme 1
Fig. 3
Fig. 3. (a) Absorption spectral changes upon addition of Me8Fc (1.0 × 10⁻³ and 2.0 × 10⁻³ M) to a deaerated PhCN solution of H2Trip+ (1.0 × 10⁻³ M) in the presence of HClO4 (1.0 × 10⁻³ M) at 298 K in a quartz cuvette (light path length = 1 mm) (black); absorption spectral change upon addition of HClO4 (1.0 × 10⁻³ M) to the solution indicated by the black line (red); absorption spectral change upon addition of HClO4 (1.0 × 10⁻³ M) to the solution indicated by the red line (blue). (b) Absorption change at 738 nm upon addition of various concentrations of Me8Fc and HClO4.
Fig. 4
Fig. 4. Time profiles of absorbance at 738 nm due to H3Trip in the reduction of H2Trip+ (2.5 × 10⁻⁵ M) (a) by various concentrations of Me8Fc in the presence of HClO4 (3.0 × 10⁻⁴ M) and (b) by Me8Fc (2.0 × 10⁻³ M) in the presence of various concentrations of HClO4 in deaerated PhCN at 298 K.
Fig. 5
Fig. 5. (a) Plot of kobsvs. [Me8Fc] for the reduction of H2Trip+ (2.5 × 10⁻⁵ M) by various concentrations of Me8Fc in the presence of HClO4 (3.0 × 10⁻⁴ M) in PhCN at 298 K. (b) Plot of kobsvs. [HClO4] for the reduction of H2Trip+ (2.5 × 10⁻⁵ M) by Me8Fc (2.0 × 10⁻³ M) in the presence of various concentrations of HClO4 in deaerated PhCN at 298 K.
Scheme 2
Scheme 2
Fig. 6
Fig. 6. (a) Absorption spectral changes produced by electron transfer from Me8Fc (1.0 × 10⁻⁴ M) to HTrip (2.5 × 10⁻⁵ M) in the presence of HClO4 (1.0 × 10⁻⁴ M) in deaerated PhCN at 298 K. (b) Absorption spectral changes upon introducing O2 to a deaerated PhCN solution of (a). The red and green lines show the spectrum of H3Trip before and after introducing O2 by O2 gas bubbling, respectively. The blue line shows the spectrum due to precursor complex. Insets show absorption time profiles.
Fig. 7
Fig. 7. (a) Absorption spectral changes in the two-electron reduction of O2 (9.4 × 10⁻⁴ M) by Me8Fc (1.0 × 10⁻² M) with HTrip (5.0 × 10⁻⁵ M) in the presence of HClO4 (1.0 × 10⁻² M) in PhCN at 298 K. The black and red lines show the spectra before and after addition of Me8Fc, respectively. The dotted line is the absorbance at 750 nm due to 1.9 × 10⁻³ M of Me8Fc+. (b) Time profile of absorbance at 750 nm due to Me8Fc+. Inset shows first-order plot.
Scheme 3
Scheme 3
Fig. 8
Fig. 8. Plots of (a) kobsvs. [HTrip] for the two-electron reduction of O2 (9.4 × 10⁻⁴ M) by Me2Fc (1.0 × 10⁻² M) with various concentrations of HTrip in the presence of HClO4 (1.0 × 10⁻² M) in PhCN; (b) kobsvs. [HClO4] for the two-electron reduction of O2 (9.4 × 10⁻⁴ M) by Me8Fc (1.0 × 10⁻² M) with HTrip (5.0 × 10⁻⁵ M) in PhCN at 298 K; (c) kobsvs. [Me8Fc] for the two-electron reduction of O2 (9.4 × 10⁻⁴ M) by various concentrations of Me8Fc with HTrip (5.0 × 10⁻⁵ M) in the presence of HClO4 (1.0 × 10⁻² M) in PhCN at 298 K; and (d) kobsvs. [O2] for the two-electron reduction of O2 by Me8Fc (1.0 × 10⁻² M) with HTrip (5.0 × 10⁻⁵ M) in the presence of HClO4 (1.0 × 10⁻² M) in PhCN at 298 K.
Fig. 9
Fig. 9. EPR spectrum observed after the reduction of HTrip (1.0 × 10⁻³ M) by (BNA)2 (2.0 × 10⁻³ M) in the presence of HClO4 (1.0 × 10⁻³ M) in aerated PhCN under photoirradiation using a high-pressure Hg lamp (1000 W) measured at 80 K. Experimental conditions: Microwave frequency 9.0 GHz, microwave power 1.0 mW, modulation frequency 100 kHz, and modulation width 10 G. (b) Optimized structure of H3Trip/O2 calculated by DFT with calculated spin-density values given in parentheses at the UB3LYP/6-31G(d) level of theory.

References

    1. Abrantes S., Amaral E., Costa A. P., Shatalov A. A., Duarte A. P. Ind. Crops Prod. 2007;25:288–293.
    2. Zeronian S. H., Inglesby M. K. Cellulose. 1995;2:265–272.
    1. Li L., Lee S., Lee H. L., Youn H. J. BioResources. 2011;6:721–736.
    1. Yamazaki S., Siroma Z., Senoh H., Ioroi T., Fujiwara N., Yasuda K. J. Power Sources. 2008;178:20–25.
    2. Disselkamp R. S. Energy Fuels. 2008;22:2771–2774.
    3. Disselkamp R. S. Int. J. Hydrogen Energy. 2010;35:1049–1053.
    1. Fukuzumi S., Yamada Y., Karlin K. D. Electrochim. Acta. 2012;82:493–511. - PMC - PubMed
    1. Yamada Y., Fukuzumi S. Aust. J. Chem. 2014;67:354–364.
    2. Yamada Y., Yoneda M., Fukuzumi S. Inorg. Chem. 2014;53:1272–1274. - PubMed
    3. Yamada Y., Yoneda M., Fukuzumi S. Chem.–Eur. J. 2013;19:11733–11741. - PubMed
    4. Yamada Y., Yoshida S., Honda T., Fukuzumi S. Energy Environ. Sci. 2011;4:2822–2825.
    5. Yamada Y., Fukunishi Y., Yamazaki S., Fukuzumi S. Chem. Commun. 2010;46:7334–7336. - PubMed

LinkOut - more resources