. 2018 Jun 18;9(29):6193-6198.
doi: 10.1039/c8sc01848k. eCollection 2018 Aug 7.

Concentrated electrolytes stabilize bismuth-potassium batteries

Affiliations

Concentrated electrolytes stabilize bismuth-potassium batteries

Ruding Zhang et al. Chem Sci. .

Abstract

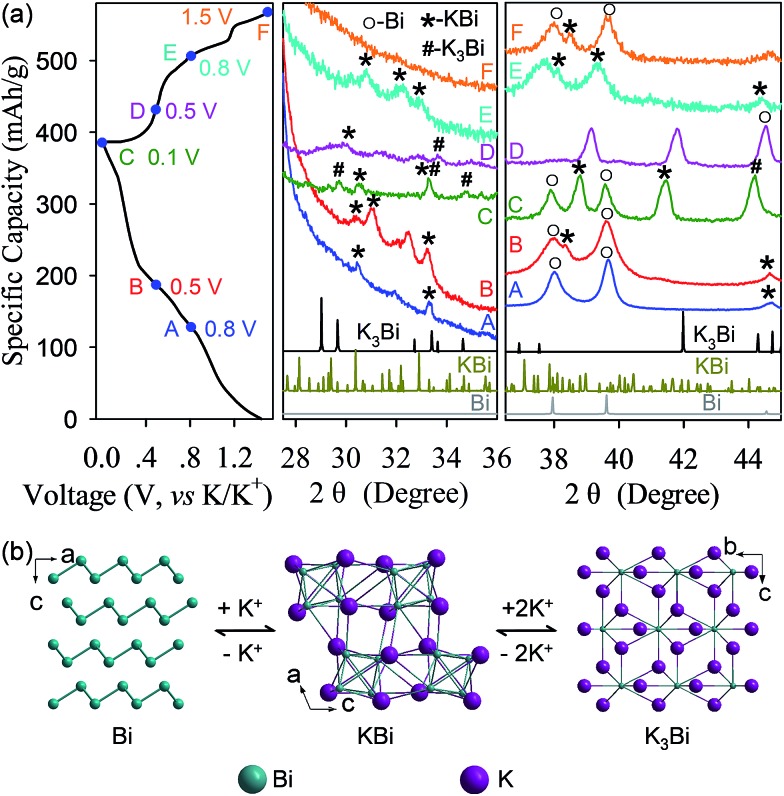
Storing as many as three K-ions per atom, bismuth is a promising anode material for rechargeable potassium-ion batteries that may replace lithium-ion batteries for large-scale electrical energy storage. However, Bi suffers from poor electrochemical cyclability in conventional electrolytes. Here, we demonstrate that a 5 molar (M) ether-based electrolyte, versus the typical 1 M electrolyte, can effectively passivate the bismuth surface due to elevated reduction resistance. This protection allows a bismuth-carbon anode to simultaneously achieve high specific capacity, electrochemical cyclability and Coulombic efficiency, as well as small potential hysteresis and improved rate capability. We show that at a high electrolyte concentration, the bismuth anode demonstrates excellent cyclability over 600 cycles with 85% capacity retention and an average Coulombic efficiency of 99.35% at 200 mA g-1. This "concentrated electrolyte" approach provides unexpected new insights to guide the development of long-cycle-life and high-safety potassium-ion batteries.


Figures

Fig. 1
Fig. 1. Potassium-ion storage potential of Bi compared to that of graphite, Sn, and KTi2(PO4)3. The (x, y, z) coordinates represent the theoretical specific capacity, theoretical volumetric capacity, and average operation potential, respectively. All the specific capacities are calculated based on the mass of the active material, while the volumetric capacities are calculated based on the volume and density of the final potassiated phase (K3Bi, KC8, and KSn) except KTi2(PO4)3 whose value is estimated based on the original phase as its potassiated structure remains unknown.
Fig. 2
Fig. 2. XRD and electron microscopy characterization of the Bi@C nanocomposite: (a) XRD confirming the purity and crystallinity of Bi@C. The inset shows the crystal structure of Bi. (b) SEM image, (c) TEM image, and (d) dark-field TEM EDS mapping of the Bi@C nanocomposite.
Fig. 3
Fig. 3. The electrochemical discrepancy of the Bi@C anode at 10 mA g–1 in different electrolyte concentrations: (a) Depotassiation capacity and Coulombic efficiency (CE). (b) First-cycle voltage profiles. (c) dQ/dV curve in the 5th cycle in the 5 M KTFSI–DEGDME electrolyte. (d–f) Galvanostatic voltage profiles in the 1 M (d), 5 M (e), and 7 M (f) KTFSI–DEGDME electrolytes.
Fig. 4
Fig. 4. Electrolyte concentration effects on electrochemical cyclability and rate capability of the Bi@C anode: (a) Depotassiation capacity and Coulombic efficiency at 50 mA g–1. (b) Cyclability at 100 mA g–1. Solid and empty squares represent the potassiation and depotassiation capacities, respectively. (c) Long-term cyclability at 200 mA g–1 in the 5 M KTFSI–DEGDME electrolyte. For clarity, the first cycle is not shown. (d–f) Rate capability in the 1 M (a), 5 M (b), and 7 M (c) KTFSI–DEGDME electrolytes.
Fig. 5
Fig. 5. Concentration-dependent reduction resistance of electrolytes: (a) linear sweep voltammetry (LSV) curves. (b) Normalized reduction current versus electrolyte concentration. (c–i) SEM images of the Bi@C anode. The initial anode (c) and anodes after one potassiation/depotassiation cycle in the 1 M (d and e), 5 M (f and g), and 7 M (h and i) KTFSI–DEGDME electrolytes.
Fig. 6
Fig. 6. Reaction kinetics study of the Bi@C nanocomposite anode in the 5 M KTFSI–DEGDME electrolyte: (a) EIS of the initial and cycled Bi@C anodes. (b and c) EIS fitting data of the initial (b) and three times cycled Bi@C anodes (c), where Rs, Rf, Rct, CPE, and Zw represent the electrolyte resistance, contact resistance, charge-transfer resistance, constant-phase element, and Warburg ion-diffusion resistance, respectively. The insets of (b) and (c) show the corresponding equivalent circuits used for the data fitting. (d) GITT data collected during the 2nd cycle.
Fig. 7
Fig. 7. Mechanistic studies of the Bi@C anode in the 5 M KTFSI–DEGDME electrolyte: (a) Ex situ XRD recorded during the first cycle. The results reveal evidence of a multi-step reaction involving the phase transformation of Bi metal to the KBi alloy and ultimately to the K3Bi alloy. (b) Schematics illustrating the phase transformation of Bi upon potassiation/depotassiation.

References

    1. Eftekhari A. J. Power Sources. 2004;126:221–228.
    1. Eftekhari A., Jian Z., Ji X. ACS Appl. Mater. Interfaces. 2017;9:4404–4419. - PubMed
    1. Jian Z., Luo W., Ji X. J. Am. Chem. Soc. 2015;137:11566–11569. - PubMed
    1. Xue L., Li Y., Gao H., Zhou W., Lu X., Kaveevivitchai W., Manthiram A., Goodenough J. B. J. Am. Chem. Soc. 2017;139:2164–2167. - PubMed
    1. Zhao Q., Wang J., Lu Y., Li Y., Liang G., Chen J. Angew. Chem., Int. Ed. 2016;55:12528–12532. - PubMed

LinkOut - more resources