. 2018 Jun 27;9(3):2041669518781381.
doi: 10.1177/2041669518781381. eCollection 2018 May-Jun.

Visual Light Zones

Affiliations

Visual Light Zones

Tatiana Kartashova et al. Iperception. .

Abstract

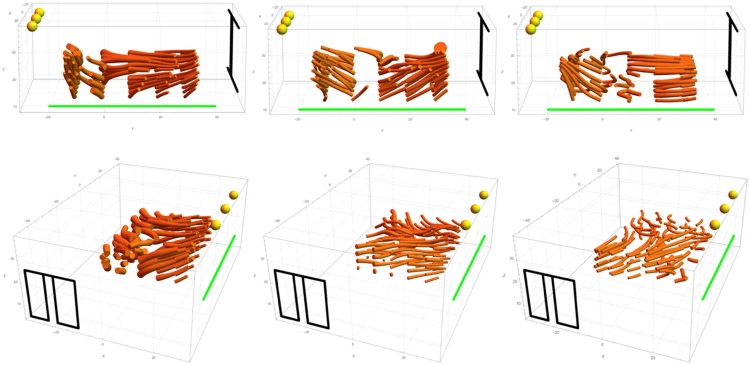
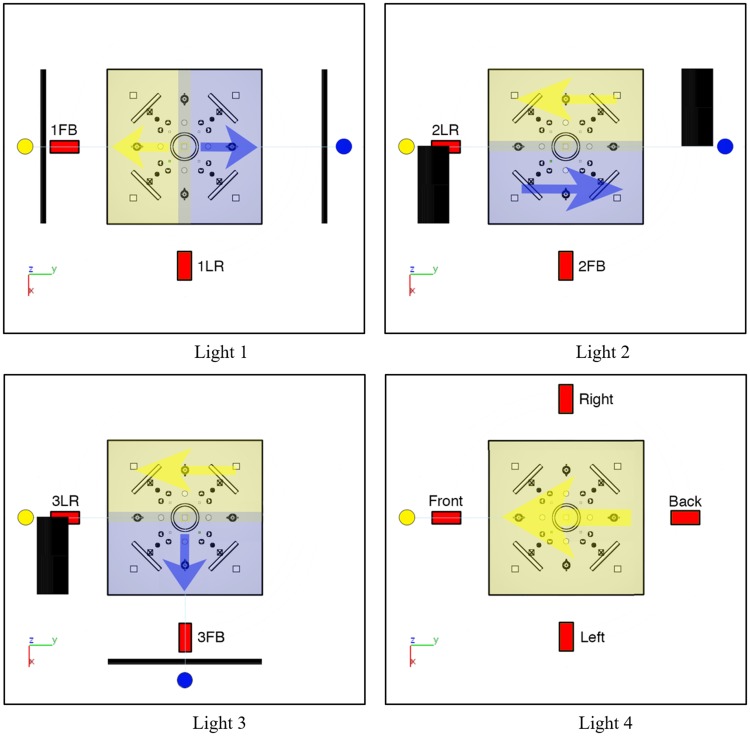
In this article, we studied perception of a particular case of light fields that is characterized by a difference in its consistent structure between parts of a scene. In architectural lighting design, such a consistent structure in a part of a light field is called a light zone. First, we explored whether human observers are sensitive to light zones, that is, zones determined primarily by light flow differences, for a natural-looking scene. We found that observers were able to distinguish the light conditions between the zones. The results suggested an effect of light zones' orientation. Therefore, in Experiment 2, we systematically examined how the orientation of light zones (left-right or front-back) with respect to a viewer influences light inferences in symmetric scenes. We found that observers are quite sensitive to the difference in the light flow of the light zones. In addition, we found that participants showed idiosyncratic behavior, especially for front-back-oriented light zones. Our findings show that observers are sensitive to differences in light field structure between two parts of a scene, which we call visual light zones.

Keywords: illumination; light; light field; light properties; light zones; visual perception.


Figures

Figure 1.
Figure 1.
Scenes of Experiment 1. Left is the left-right (LR) condition, and right is the front-back (FB) condition.
Figure 2.
Figure 2.
Schematic representation of the measurements positions. The positions of repeated measurements are marked with red. The viewing plane orientation is denoted as a green line.
Figure 3.
Figure 3.
The mathematical first-order structure of the physical light fields for the stimuli used in Experiment 1. Left is the LR (left-right) orientation, and right is the FB (front-back) orientation.
Figure 4.
Figure 4.
Slicing of the resulting settings. Left is the LR (left-right) condition sliced parallel to the viewing direction, and right is the FB (front-back) condition sliced across the viewing direction.
Figure 5.
Figure 5.
Distribution of settings per slice. The first row shows the results for the LR (left-right) condition, the second row for the FB (front-back) condition. Each sphere represents all the directional settings of all observers on all the spheres of a corresponding slice. The red dots represent the mean directions; the red ellipses represent one standard deviation.
Figure 6.
Figure 6.
Pairs of visual light fields of three representative observers. The first row represents results for the LR (left-right) condition, the second row for the FB (front-back) condition. The green line denotes the picture plane. Yellow spheres represent the lamps. Black lines show the positions of the window and the door. The visualizations of the LR conditions have a rather clear border between the light zones, whereas for the FB conditions, the visual light fields vary idiosyncratically.
Figure 7.
Figure 7.
Spreads of settings between observers in the first row and between repetitions in the second row. The first column concerns the spread in the directional settings, the second column in the intensity settings, and the third column in the diffuseness settings. For the bar charts between observers, each bar represents the spread between all observers’ settings in one slice of the grid. For the bar charts between repetitions, each bar represents an average of the spreads between observers’ repetitions for each probe. LR = left-right; FB = front-back.
Figure 8.
Figure 8.
Schematic representation of the tested conditions and views. Each image represents the top view of the scene and light sources (the distances to light sources and shades are not proportional). Red rectangles represent the cameras, labeled according to the resulting scene image. Yellow and blue circles represent the light sources. Black bars show the shades, which partially occluded the light, so that the light source illuminated only the closest half of the scene. Black rectangles show the shades that completely occluded the light on a half of the scene. Yellow and blue arrows show the approximate light orientation (as a vector, pointing toward the source) in the zones of corresponding colors.
Figure 9.
Figure 9.
Test images. The first two rows contain the conditions with two light zones. The first row shows the LR orientations, the second row the FB orientations. The third row shows the single light zone condition from the left, front, and back (the right is not shown here because that is exactly mirrored to the left case).
Figure 10.
Figure 10.
White spheres illustrating the positions of probes (for 2LR (left-right), with veridical probe illuminations). Each scene contained five probes, four in each quadrant of the scene and one in the center of the scene. Only one probe was shown at a time. A probe did not produce a shadow in the trials.
Figure 11.
Figure 11.
Inter- and intraobservers’ variability of the directions of the settings (parameterized via the dispersion).
Figure 12.
Figure 12.
Deviations with respect to the veridical average light direction (light vector) as a function of condition.
Figure 13.
Figure 13.
Top view circular histograms of direction settings. Settings are grouped such that the left histogram of a test image shows the settings made on the two probes in the left or front light zone (for LR or FB, respectively), the middle histogram shows the settings on the middle sphere, and the right histogram shows the settings made on the two probes in the right or back light zone (for LR or FB, respectively). The red lines in the centers of the circles show the veridical light directions (red dots instead of lines mean that veridical light vector points straight up or straight down). The green line represents the picture plane.

References

    1. Adams A. (1948) The negative: Exposure and development. Ansel Adams basic photography series/Book 2, Boston, MA: New York Graphic Society.
    1. Boyaci H., Doerschner K., Maloney L. T. (2006) Cues to an equivalent lighting model. Journal of Vision 6: 106–118. doi:10.1167/6.2.2. - PubMed
    1. Brainard D. H. (1997) The psychophysics toolbox. Spatial Vision 10: 433–436. - PubMed
    1. Chajdas, M. G., Weis, A., & Westermann, R. (2011). Assisted environment map probe placement. Paper presented at the Proceedings of SIGRAD, Stockholm, November 2011.
    1. Cuttle C. (2003) Lighting by design, Oxford, England: Architectural Press.

How to cite this article

    1. Kartashova, T., de Ridder, H., te Pas, S. F., & Pont, S. C. (2018). Visual Light Zones. i-Perception, 9(3), 1–20. doi: 10.1177/2041669518781381. - PMC - PubMed

LinkOut - more resources