

Comparative oxidative stress elicited by nanosilver in stable HSPA1A promoter-driven luciferase reporter HepG2 and A549 cells
- PMID: 30090433
- PMCID: PMC6060725
- DOI: 10.1039/c6tx00195e
Comparative oxidative stress elicited by nanosilver in stable HSPA1A promoter-driven luciferase reporter HepG2 and A549 cells
Abstract
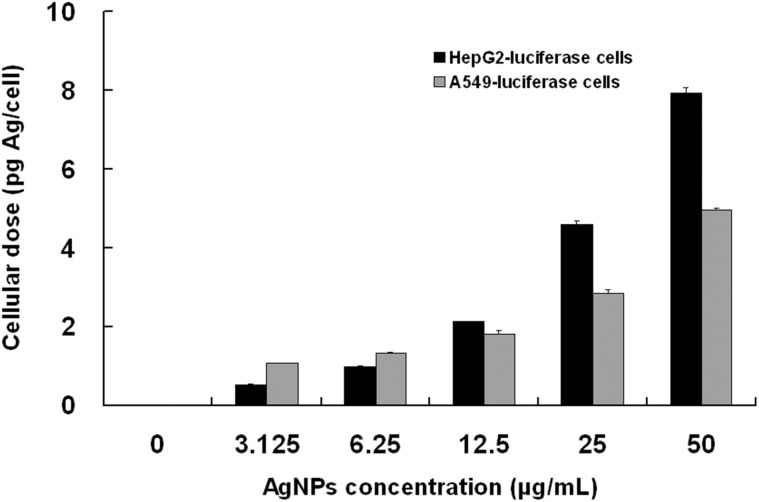
The use of silver nanoparticles (AgNPs) in consumer products and medical applications is growing rapidly owing to their noted antimicrobial properties. As a consequence, a rapid and reliable toxicology test that allows multiple nanosilver screening in a stress responsive pathway-based assay is needed to ensure consumer safety. Here, novel HSPA1A promoter-driven luciferase reporter gene assays based on two cell models widely used in toxicology testing, HepG2 and A549 cell lines, were developed to analyze the oxidative stress elicited by AgNPs. After AgNP exposure, the luciferase activity, cell viability, and oxidative damage in HepG2- and A549-luciferase cells were determined. The uptake and intracellular localization of AgNPs were measured by transmission electron microscopy. The cellular AgNPs were determined by inductively coupled plasma mass spectrometry. Our results showed that both reporter cells were able to take up nanoparticles and furthermore, exposure to AgNPs resulted in an obviously dose-dependent increase in transcriptional activation of the HSPA1A promoter indicated by luciferase activity. Surprisingly, luciferase activity was greater than 200× the control level in HepG2-luciferase reporter cells treated with 50 μg mL-1 AgNPs. These results were in line with the positive responses in cytotoxicity, intracellular reactive oxygen species induction, glutathione depletion, malondialdehyde concentration, and the cellular silver content. Compared with the A549-luciferase cells, the luciferase signal in the metabolic competent HepG2-luciferase cells is obviously more sensitive and stable. We conclude that these two reporter gene cell systems, especially the HepG2-luciferase cells, demonstrated their utilities in predictive screening of the oxidative stress elicited by nanosilver.
Figures


References
-
- Nowack B., Krug H. F., Height M. Environ. Sci. Technol. 2011;45:1177–1183. - PubMed
-
- Wijnhoven S. W. P., Peijnenburg W. J. G. M., Heberts C. A., Hagens W. I., Oomen A. G., Heugens E. H. W., Roszek B., Bisschops J., Gosens I., Van de Meent D., Dekkers S., De Jong W. H., Van Zijverden M., Sips A. J. A. M., Geertsma R. E. Nanotoxicology. 2009;3:109–138.
-
- Gaiser B. K., Hirn S., Kermanizadeh A., Kanase N., Fytianos K., Wenk A., Haberl N., Brunelli A., Kreyling W. G., Stone V. Toxicol Sci. 2013;131:537–547. - PubMed
-
- Ahamed M., Karns M., Goodson M., Rowe J., Hussain S. M., Schlager J. J., Hong Y. Toxicol. Appl. Pharmacol. 2008;233:404–410. - PubMed
LinkOut - more resources
Full Text Sources
Other Literature Sources
Research Materials
