. 2017 Oct 12;7(1):48-58.
doi: 10.1039/c7tx00205j. eCollection 2018 Jan 1.

Bifenthrin-induced neurotoxicity in rats: involvement of oxidative stress

Affiliations

Bifenthrin-induced neurotoxicity in rats: involvement of oxidative stress

Farah Syed et al. Toxicol Res (Camb). .

Abstract

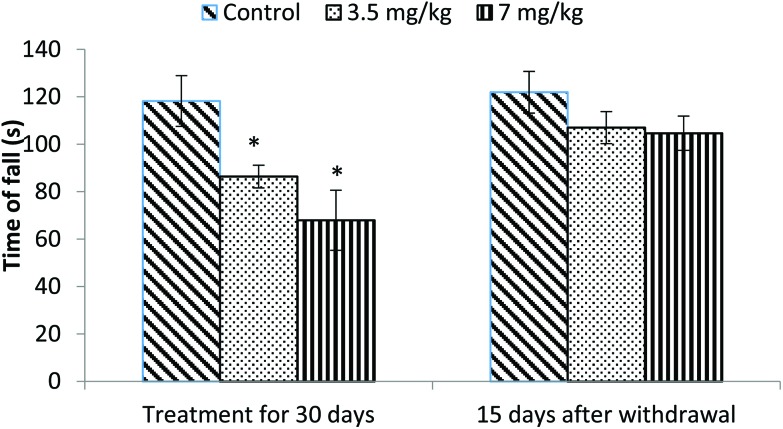
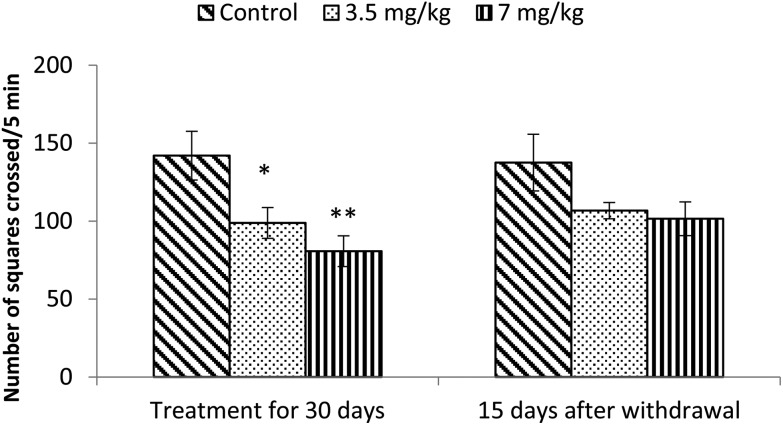
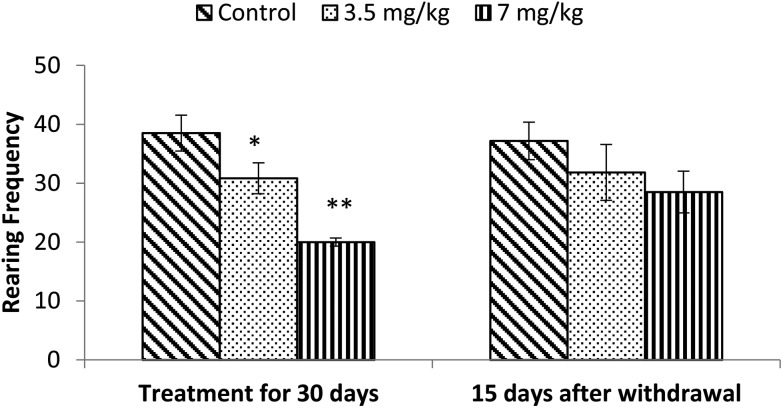
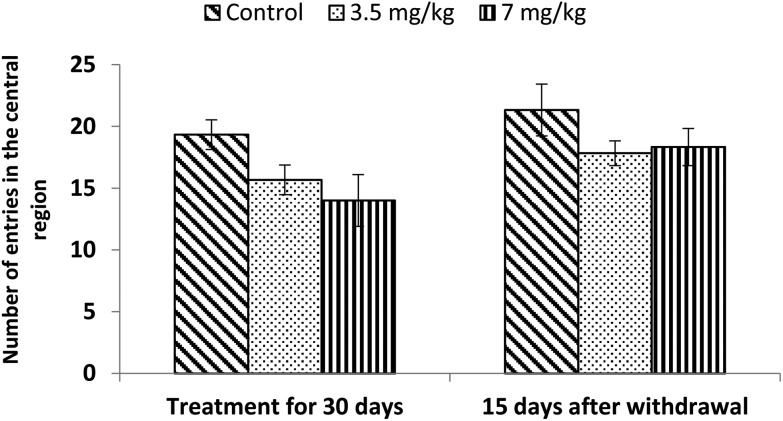
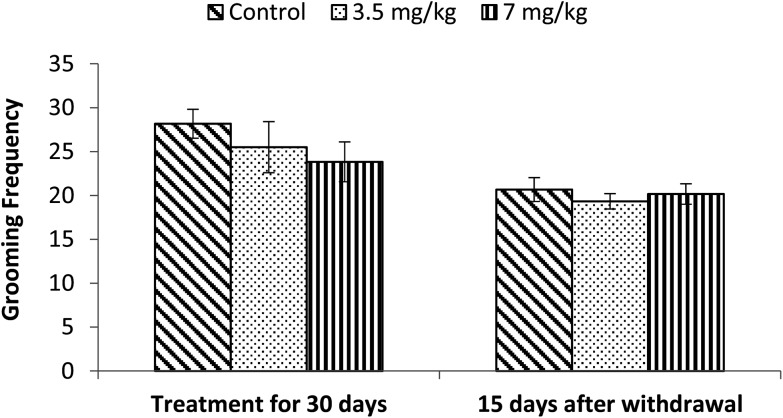
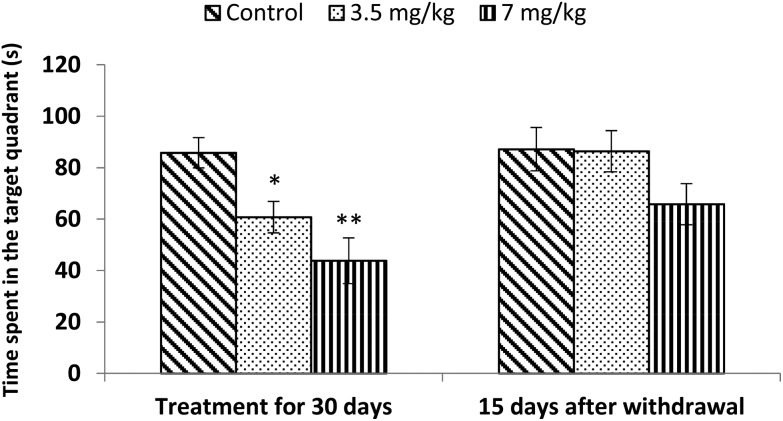
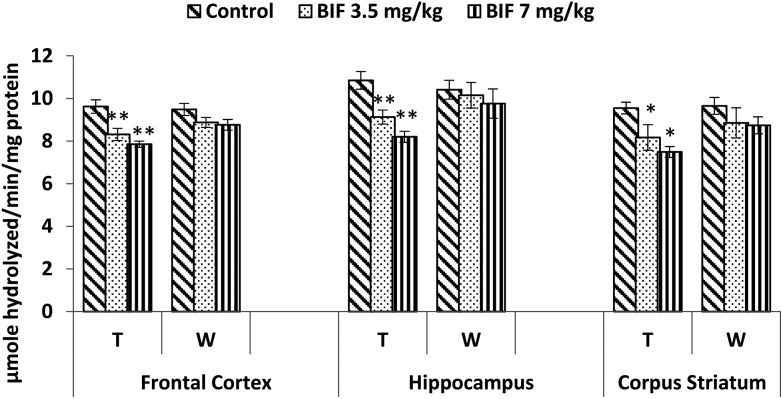
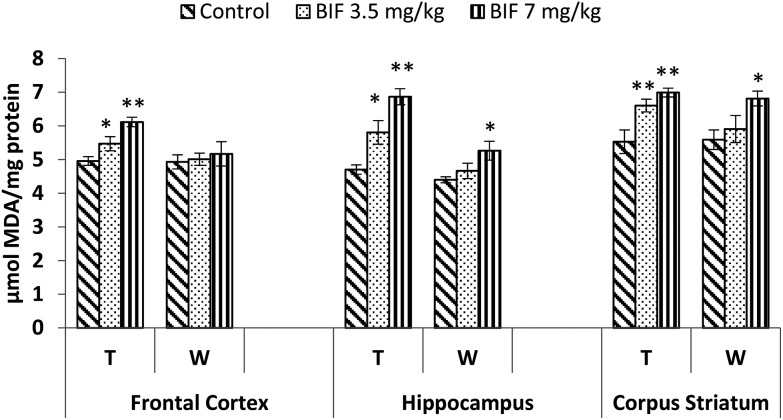
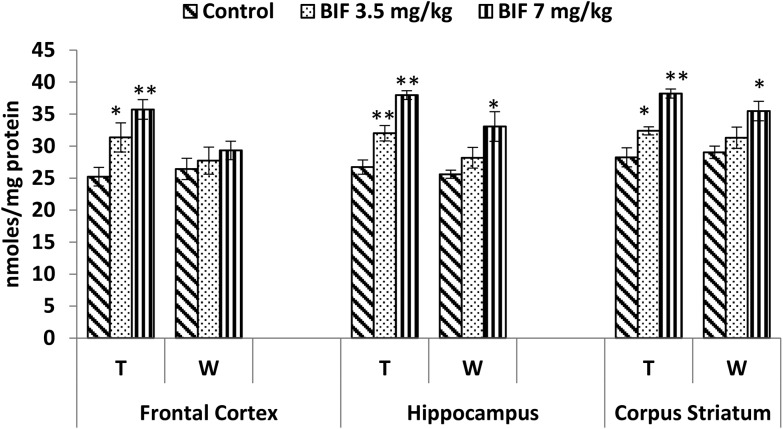
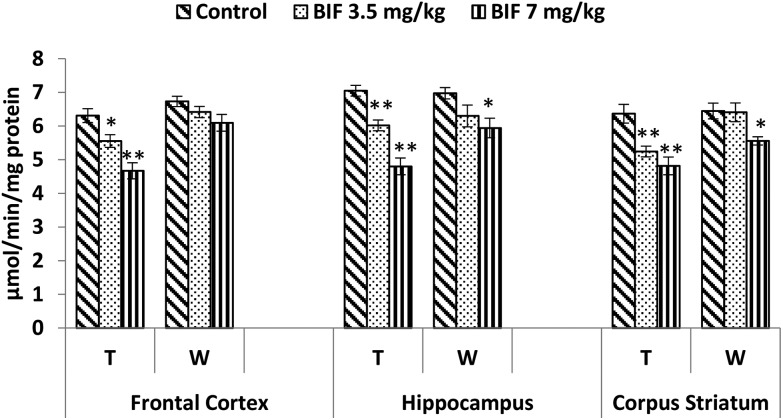
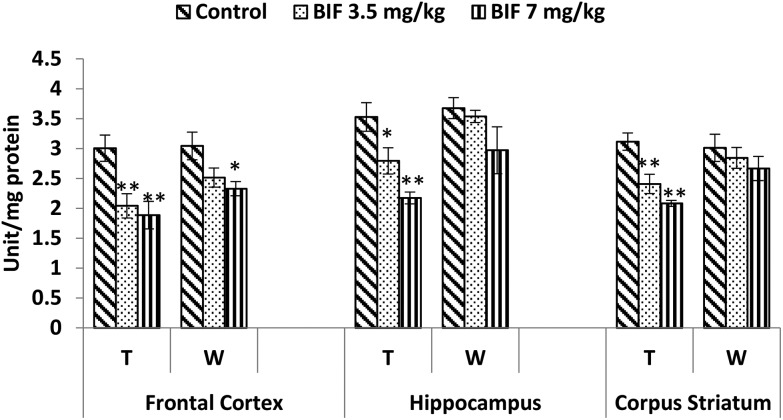
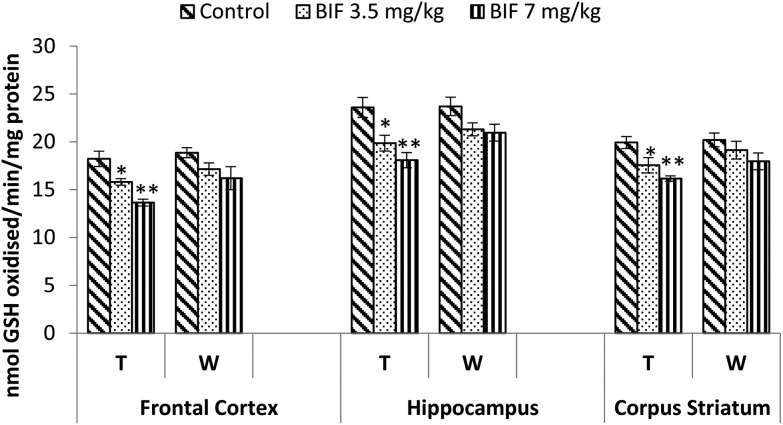
Extensive use of synthetic pyrethroids has resulted in serious human health issues. Induction of oxidative stress is an important mechanism of action of most pesticides including pyrethroids. In the present study, we have elucidated the possible role of oxidative stress in bifenthrin-induced neurotoxicity. Adult male Wistar rats were administered bifenthrin (3.5 and 7 mg per kg body weight p.o.) for 30 days. Behavioral studies were conducted on a set of randomly selected rats from each treatment group after completion of treatment. Neurochemical parameters were assessed 24 h after the last dose was administered. The selected behavioral and neurochemical endpoints were also assessed 15 days after cessation of exposure to reveal whether the neurobehavioral changes produced by bifenthrin were temporary or permanent. Deficits in motor activity, motor incoordination, and cognitive impairment were observed after exposure to bifenthrin. Levels of biogenic amines viz. dopamine (DA) and its metabolites, i.e. 3,4-dihydroxyphenylacetic acid (DOPAC) and homovanillic acid (HVA), epinephrine (EPN), norepinephrine (NE), and serotonin (5-HT) altered in the frontal cortex, corpus striatum, and hippocampus of bifenthrin-treated rats. A decrease in the activity of acetylcholinesterase (AChE) occurred in all regions of the brain. Both doses of bifenthrin significantly induced lipid peroxidation (LPO) and increased protein carbonyl levels in the frontal cortex, corpus striatum, and hippocampus of rats. The activities of antioxidant enzymes, i.e. catalase, superoxide dismutase, and glutathione peroxidase, were also suppressed in all selected regions of the brain. A trend of recovery was, however, observed in all the behavioral and neurochemical endpoints 15 days after withdrawal of exposure. Oxidative stress seems to play an important role in bifenthrin-induced neurotoxicity. Our study suggests that long-term exposure to these compounds can produce detrimental effects.


Figures

Fig. 1
Fig. 1. Effect on rotarod performance of rats following exposure to bifenthrin for 30 days and 15 days after withdrawal of exposure. Data were analyzed by one-way analysis of variance followed by Newman–Keuls test. Values are mean ± SEM of six animals in each group. * Significant difference from controls (p < 0.05); ** significant difference from controls (p < 0.01).
Fig. 2
Fig. 2. Effect on locomotion of rats in the open field following exposure to bifenthrin for 30 days and 15 days after withdrawal of exposure. Data were analyzed by one-way analysis of variance followed by Newman–Keuls test. Values are mean ± SEM of six animals in each group. * Significant difference from controls (p < 0.05); ** significant difference from controls (p < 0.01).
Fig. 3
Fig. 3. Effect on rearing of rats in the open field following exposure to bifenthrin for 30 days and 15 days after withdrawal of exposure. Data were analyzed by one-way analysis of variance followed by Newman–Keuls test. Values are mean ± SEM of six animals in each group. * Significant difference from controls (p < 0.05); ** significant difference from controls (p < 0.01).
Fig. 4
Fig. 4. Effect on central area entries in the open field following exposure to bifenthrin for 30 days and 15 days after withdrawal of exposure. Data were analyzed by one-way analysis of variance followed by Newman–Keuls test. Values are mean ± SEM of six animals in each group. * Significant difference from controls (p < 0.05); ** significant difference from controls (p < 0.01).
Fig. 5
Fig. 5. Effect on grooming of rats in the open field following exposure to bifenthrin for 30 days and 15 days after withdrawal of exposure. Data were analyzed by one-way analysis of variance followed by Newman–Keuls test. Values are mean ± SEM of six animals in each group. * Significant difference from controls (p < 0.05); ** significant difference from controls (p < 0.01).
Fig. 6
Fig. 6. Effect on spatial memory of rats in the Morris water maze following exposure to bifenthrin for 30 days and 15 days after withdrawal of exposure. Data were analyzed by one-way analysis of variance followed by Newman–Keuls test. Values are mean ± SEM of six animals in each group. * Significant difference from controls (p < 0.05); ** significant difference from controls (p < 0.01).
Fig. 7
Fig. 7. Acetylcholinesterase activity in the frontal cortex, hippocampus and corpus striatum of rats following exposure to bifenthrin for 30 days and 15 days after withdrawal of exposure. T = treatment for 30 days; W = 15 days after withdrawal of exposure. Data were analyzed by one-way analysis of variance followed by Newman–Keuls test. Values are represented as mean ± SEM of 5 rats in each group. * Significant difference from controls (p < 0.05), ** significant difference from controls (p < 0.01).
Fig. 8
Fig. 8. Effect on lipid peroxidation in the frontal cortex, hippocampus and corpus striatum of rats following exposure to bifenthrin for 30 days and 15 days after withdrawal of exposure. T = treatment for 30 days; W = 15 days after withdrawal of exposure. Data were analyzed by one-way analysis of variance followed by Newman–Keuls test. Values are represented as mean ± SEM of 5 rats in each group. * Significant difference from controls (p < 0.05), ** significant difference from controls (p < 0.01).
Fig. 9
Fig. 9. Effect on protein carbonyl levels in the frontal cortex, hippocampus and corpus striatum of rats following exposure to bifenthrin for 30 days and 15 days after withdrawal of exposure. T = treatment for 30 days; W = 15 days after withdrawal of exposure. Data were analyzed by one-way analysis of variance followed by Newman–Keuls test. Values are represented as mean ± SEM of 5 rats in each group. * Significant difference from controls (p < 0.05), ** significant difference from controls (p < 0.01).
Fig. 10
Fig. 10. Effect on catalase activity in the frontal cortex, hippocampus and corpus striatum of rats following exposure to bifenthrin for 30 days and 15 days after withdrawal of exposure. T = treatment for 30 days; W = 15 days after withdrawal of exposure. Data were analyzed by one-way analysis of variance followed by Newman–Keuls test. Values are represented as mean ± SEM of 5 rats in each group. * Significant difference from controls (p < 0.05), ** significant difference from controls (p < 0.01).
Fig. 11
Fig. 11. Effect on superoxide dismutase activity in the frontal cortex, hippocampus and corpus striatum of rats following exposure to bifenthrin for 30 days and 15 days after withdrawal of exposure. T = treatment for 30 days; W = 15 days after withdrawal of exposure. Data were analyzed by one-way analysis of variance followed by Newman–Keuls test. Values are represented as mean ± SEM of 5 rats in each group. * Significant difference from controls (p < 0.05), ** significant difference from controls (p < 0.01).
Fig. 12
Fig. 12. Effect on glutathione peroxidase activity in the frontal cortex, hippocampus and corpus striatum of rats following exposure to bifenthrin for 30 days and 15 days after withdrawal of exposure. T = treatment for 30 days; W = 15 days after withdrawal of exposure. Data were analyzed by one-way analysis of variance followed by Newman–Keuls test. Values are represented as mean ± SEM of 5 rats in each group. * Significant difference from controls (p < 0.05), ** significant difference from controls (p < 0.01).

References

    1. Gupta S., Sharma R. K., Gupta R. K., Sinha S. R., Singh R., Gajhbhiye V. T. Bull. Environ. Contam. Toxicol. 2009;82:243–247. - PubMed
    1. Mokrey L. E., Hoagland K. D. Environ. Toxicol. Chem. 1989;9:1045–1051.
    1. W.H.O., The WHO recommended classification of pesticides by hazard and guidelines to classification, World Health Organization, Geneva, 2009.
    1. Nguyen H. T., Whelan P. I., Shortus M. S., Jacups S. P. J. Am. Mosq. Control Assoc. 2009;25:74–82. - PubMed
    1. Domagalski J. L., Weston D. P., Zhang M., Hladik M. Environ. Toxicol. Chem. 2010;29:813–823. - PubMed

LinkOut - more resources