. 2018 Oct;7(10):647-659.
doi: 10.1002/psp4.12343. Epub 2018 Sep 7.

PBPK Models for CYP3A4 and P-gp DDI Prediction: A Modeling Network of Rifampicin, Itraconazole, Clarithromycin, Midazolam, Alfentanil, and Digoxin

Affiliations

PBPK Models for CYP3A4 and P-gp DDI Prediction: A Modeling Network of Rifampicin, Itraconazole, Clarithromycin, Midazolam, Alfentanil, and Digoxin

Nina Hanke et al. CPT Pharmacometrics Syst Pharmacol. 2018 Oct.

Abstract

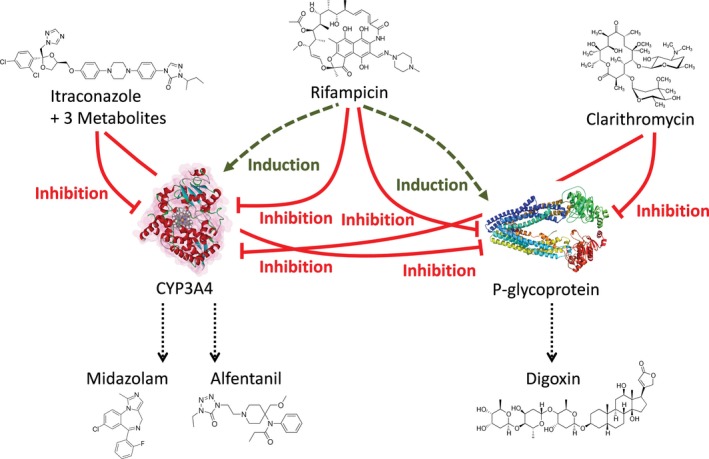
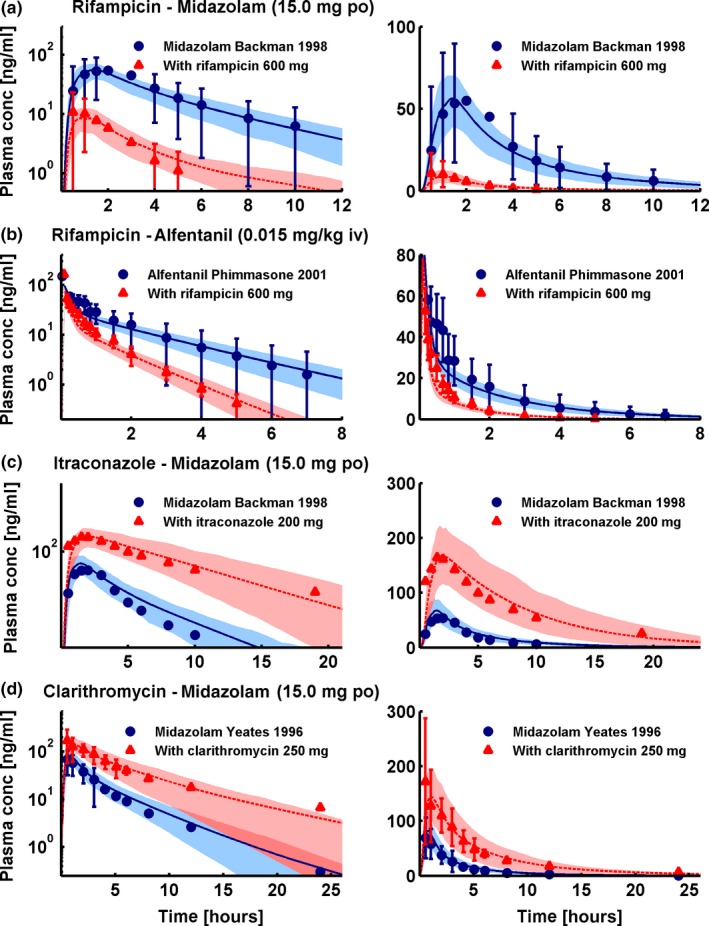
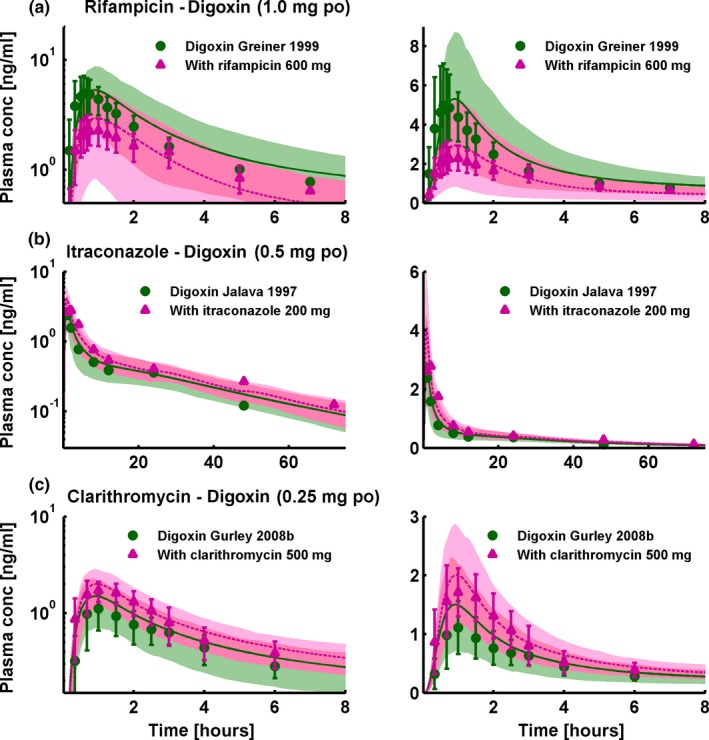
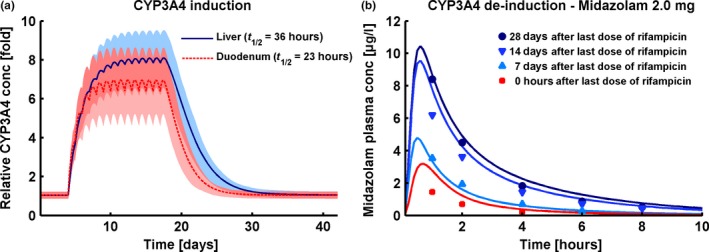
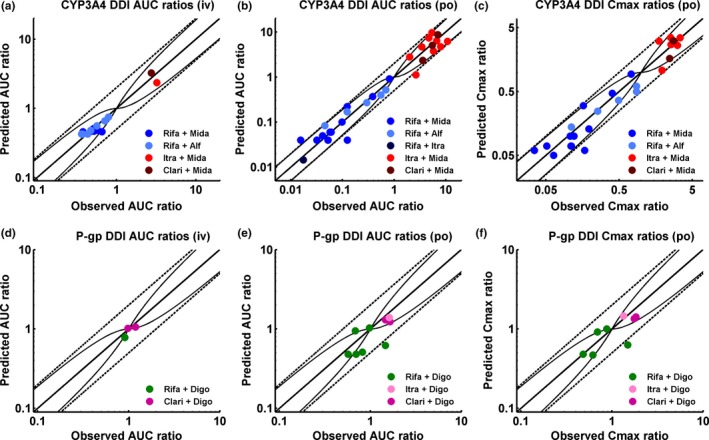
According to current US Food and Drug Administration (FDA) and European Medicines Agency (EMA) guidance documents, physiologically based pharmacokinetic (PBPK) modeling is a powerful tool to explore and quantitatively predict drug-drug interactions (DDIs) and may offer an alternative to dedicated clinical trials. This study provides whole-body PBPK models of rifampicin, itraconazole, clarithromycin, midazolam, alfentanil, and digoxin within the Open Systems Pharmacology (OSP) Suite. All models were built independently, coupled using reported interaction parameters, and mutually evaluated to verify their predictive performance by simulating published clinical DDI studies. In total, 112 studies were used for model development and 57 studies for DDI prediction. 93% of the predicted area under the plasma concentration-time curve (AUC) ratios and 94% of the peak plasma concentration (Cmax ) ratios are within twofold of the observed values. This study lays a cornerstone for the qualification of the OSP platform with regard to reliable PBPK predictions of enzyme-mediated and transporter-mediated DDIs during model-informed drug development. All presented models are provided open-source and transparently documented.


Figures

Figure 1
Figure 1
Physiologically based pharmacokinetic drug‐drug interaction network. Schematic illustration of the modeled interaction network of cytochrome P450 (CYP)3A4 and P‐glycoprotein perpetrator (upper level: itraconazole, rifampicin, and clarithromycin) and victim drugs (lower level: midazolam, alfentanil, and digoxin). Green dashed lines indicate induction; red solid lines indicate inhibition.
Figure 2
Figure 2
Cytochrome P450 3A4 drug‐drug interactions (DDIs). Selection of one study each of the rifampicin‐midazolam (a), rifampicin‐alfentanil (b), itraconazole‐midazolam (c), and clarithromycin‐midazolam (d) DDIs, presented in semilogarithmic (left panel) and linear plots (right panel). Shown are population predictions compared to observed victim drug concentration‐time profiles before and during perpetrator administration. Observed data are shown as blue dots (control) or red triangles (DDI) ± SD. Population simulation arithmetic means are shown as solid blue lines (control) or dashed red lines (DDI); the shaded areas illustrate the respective 68% population prediction intervals. Details on dosing regimens, study populations, predicted and observed DDI area under the plasma concentration‐time curve ratios and DDI peak plasma concentration ratios are summarized in Table 1.
Figure 3
Figure 3
P‐glycoprotein drug‐drug interactions (DDIs). Selection of one study each of the rifampicin‐digoxin (a), itraconazole‐digoxin (b), and clarithromycin‐digoxin (c) DDIs, presented in semilogarithmic (left panel) and linear plots (right panel). Shown are population predictions compared to observed victim drug concentration‐time profiles before and during perpetrator administration. Observed data are shown as green dots (control) or pink triangles (DDI) ± SD. Population simulation arithmetic means are shown as solid green lines (control) or dashed pink lines (DDI); the shaded areas illustrate the respective 68% population prediction intervals. Details on dosing regimens, study populations, predicted and observed DDI area under the plasma concentration‐time curve ratios and DDI peak plasma concentration ratios are summarized in Table 1.
Figure 4
Figure 4
Cytochrome P450 (CYP)3A4 induction and de‐induction. (a) Fold change of predicted CYP3A4 concentrations in liver (solid blue line) and duodenum (dashed red line) before, during, and after a 600 mg q.d. rifampicin regimen. Shown are population prediction arithmetic means (lines) and 68% population prediction intervals (shaded areas). (b) Population simulation arithmetic means (lines) and observed (squares, triangles, and dots) midazolam plasma concentration‐time profiles during simultaneous administration of midazolam and rifampicin (red line and squares) or administration of midazolam 7 days (light blue line and triangles), 14 days (blue line and triangles) or 28 days (dark blue line and dots) after the last dose of a 600 mg q.d. rifampicin treatment. Observed data are from Reitman et al.12 Predicted and observed DDI area under the plasma concentration‐time curve ratios and DDI peak plasma concentration ratios are given in Table 1.
Figure 5
Figure 5
Correlation of predicted to observed DDI area under the plasma concentration‐time curve (AUC) ratios and DDI peak plasma concentration (Cmax) ratios. The upper panel illustrates the cytochrome P450 (CYP)3A4 DDI prediction performance, the lower panel illustrates the P‐glycoprotein (P‐gp) DDI prediction performance of the network. (a, d) DDI AUC ratios of intravenously administered victim drugs, (b, e) DDI AUC ratios of orally administered victim drugs, and (c, f) DDI Cmax ratios of orally administered victim drugs. The line of identity and the prediction acceptance limits proposed by Guest et al.23 are shown as solid lines. The 0.5‐fold to 2.0‐fold acceptance limits are shown as dashed lines. Induction of elimination pathways by rifampicin results in DDI ratios <1, inhibition of elimination pathways by itraconazole or clarithromycin results in DDI ratios >1. Study references and values of predicted and observed DDI AUC ratios and DDI Cmax ratios are listed in Table 1.

References

    1. U.S. Food and Drug Administration . Clinical Drug Interaction Studies – Study Design, Data Analysis, and Clinical Implications. Draft Guidance for Industry. <https://www.fda.gov/downloads/drugs/guidances/ucm292362.pdf>, (October 2017).
    1. European Medicines Agency . Guideline on the Investigation of Drug Interactions. CPMP/EWP/560/95/Rev. 1 Corr. 2** <http://www.ema.europa.eu/docs/en_GB/document_library/Scientific_guidelin...>, (21 June 2012).
    1. Guengerich, F.P. Cytochrome P‐450 3A4: regulation and role in drug metabolism. Annu. Rev. Pharmacol. Toxicol. 39, 1–17 (1999). - PubMed
    1. Fenner, K.S. et al Drug‐drug interactions mediated through P‐glycoprotein: clinical relevance and in vitro‐in vivo correlation using digoxin as a probe drug. Clin. Pharmacol. Ther. 85, 173–181 (2009). - PubMed
    1. U.S. Food and Drug Administration . Drug development and drug interactions: table of substrates, inhibitors and inducers. <https://www.fda.gov/Drugs/DevelopmentApprovalProcess/DevelopmentResource...>.

Publication types

MeSH terms