Review
. 2018 Jul;24(4):225-236.
doi: 10.5152/dir.2018.17400.

Sonographically indeterminate scrotal masses: how MRI helps in characterization

Affiliations
Review

Sonographically indeterminate scrotal masses: how MRI helps in characterization

Athina C Tsili et al. Diagn Interv Radiol. 2018 Jul.

Abstract

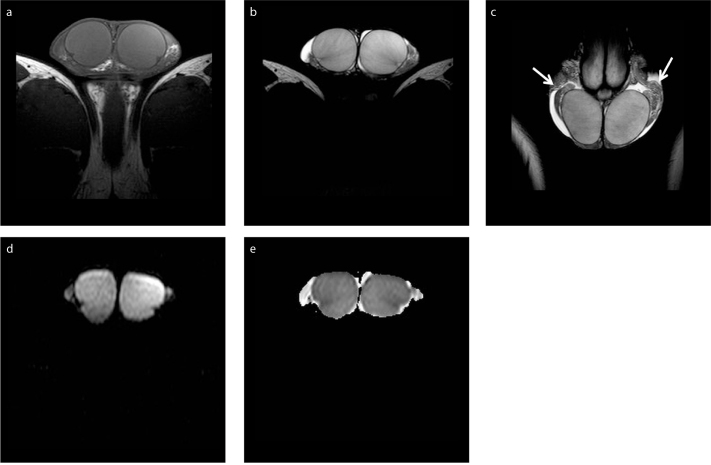
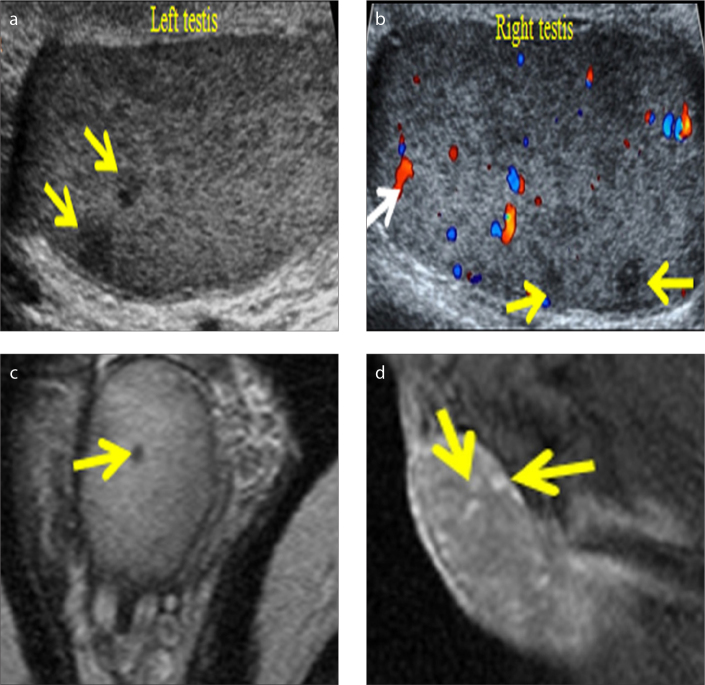
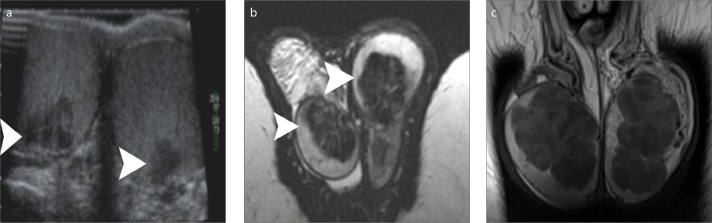
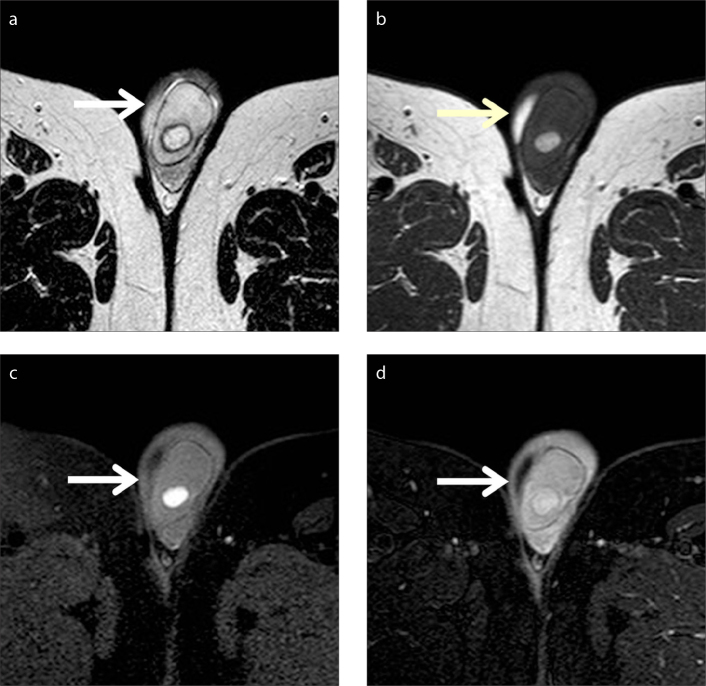
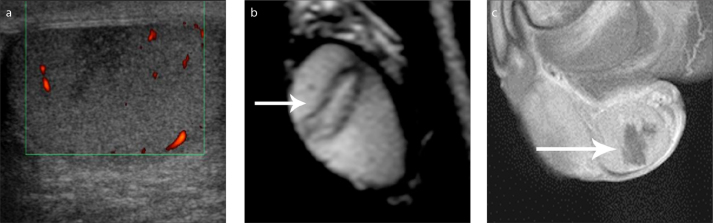
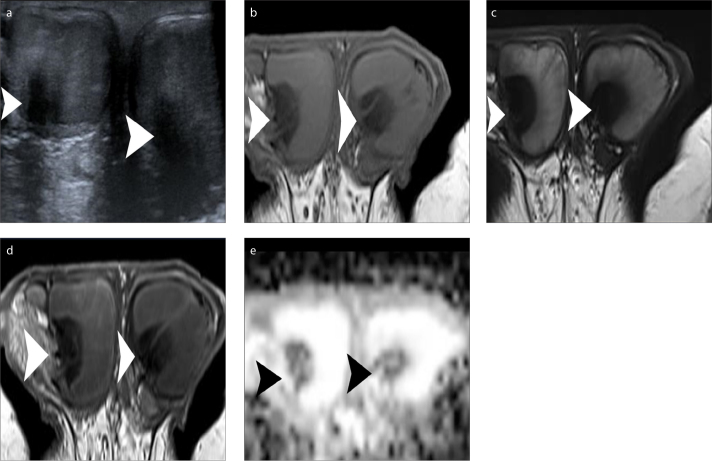
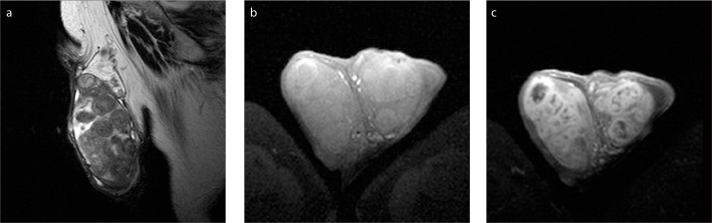
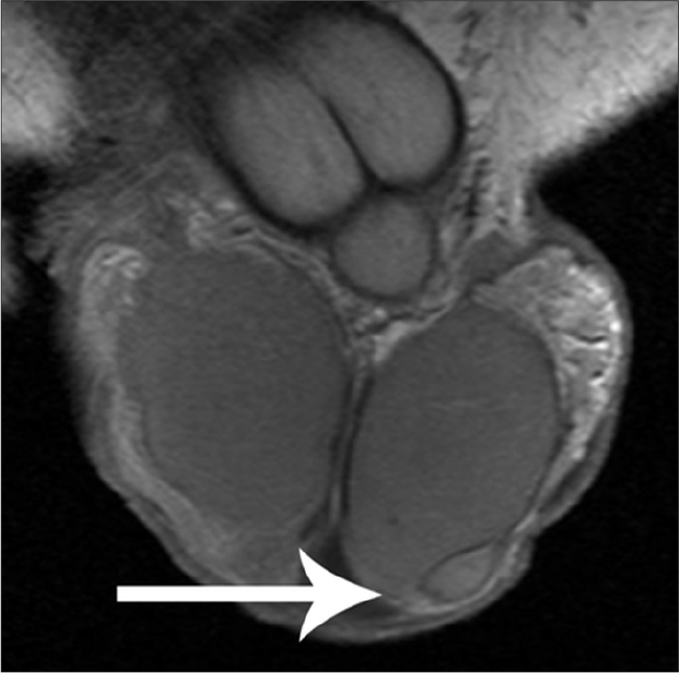
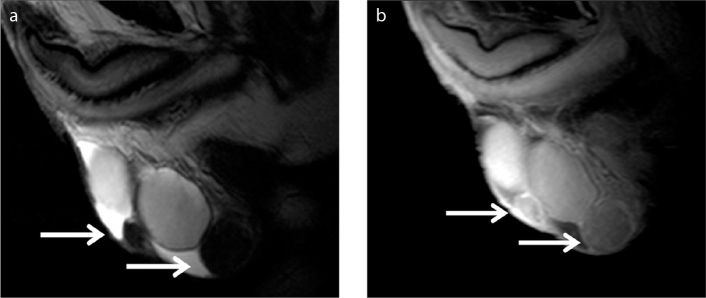
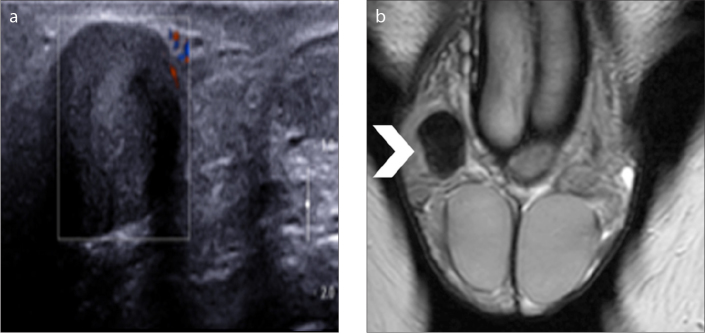
Magnetic resonance imaging (MRI) of the scrotum represents a useful supplemental imaging technique in the characterization of scrotal masses, particularly recommended in cases of nondiagnostic ultrasonographic findings. An accurate characterization of the benign nature of scrotal masses, including both intratesticular and paratesticular ones may improve patient management and decrease the number of unnecessary radical surgical procedures. Alternative treatment strategies, including follow-up, lesion biopsy, tumor enucleation, or organ sparing surgery may be recommended. The aim of this pictorial review is to present how MRI helps in the characterization of sonographically indeterminate scrotal masses and to emphasize the key MRI features of benign scrotal masses.


Conflict of interest statement

Conflict of interest disclosure

The authors declared no conflicts of interest.

Figures

Figure 1 a–e
Figure 1 a–e
Normal MRI findings in a 21-year-old man. Axial T1-weighted image (a) shows testes mainly isointense to the muscles. T2-weighted image in axial (b) and coronal (c) orientation depicts hyperintensity of normal testicular parenchyma. Thin, hypointense septa are seen traversing normal testes. The tunica albuginea is clearly depicted as a thin, hypointense halo surrounding the testes. Parts of the epididymis (arrows) are demonstrated bilaterally, slightly heterogeneous, mainly of low signal intensity. Small bilateral hydrocele is also seen, as a normal finding. Axial DWI (b=900 s/mm2) image (d) and the corresponding ADC map (e) show normal testes as hyperintense and slightly hypointense, respectively. The ADC (×10−3 mm2/s) of the right and left testis is 0.91 and 0.86, respectively.
Figure 2
Figure 2
Schematic drawing shows time-signal intensity curve types. Type I shows the progressive, linear increase of contrast enhancement of normal testicular parenchyma. Type II demonstrates an early, strong enhancement, followed by either a plateau or a slight further increase, detected in benign intratesticular lesions, whereas the type III corresponds to a vigorous, early enhancement, followed by gradual washout of the contrast material, detected in testicular malignancies.
Figure 3 a–c
Figure 3 a–c
A 58-year old man with bilateral TERT. T2-weighted images in coronal (a) and sagittal (b) orientation, and coronal contrast-enhanced T1-weighted image (c) show multicystic intratesticular lesions (arrowheads), within the mediastinum (larger on the right side). The lesions are hyperintense and hypointense on T2- and T1-weighted images, respectively and do not enhance after gadolinium administration. A large right spermatocele (arrow) and a moderate ipsilateral hydrocele are also depicted.
Figure 4 a–e
Figure 4 a–e
Epidermoid cyst of the right testis. Power Doppler sonographic image (a) of the right testis in sagittal orientation depicts heterogeneous, mainly hypoechoic intratesticular mass, with absence of internal vascularity. Transverse T1-weighted image (b), T2-weighted image (c), ADC map (d) and fat-suppressed contrast-enhanced T1-weighted image (e) show inhomogeneous right intratesticular mass (arrowhead). The lesion is slightly hypointense and hyperintense on T1- and T2-weighted images, respectively, when compared to normal testicular parenchyma and is surrounded by a low signal intensity rim, best seen on T2-weighted images. Restricted diffusion within the mass is attributed to the presence of dense keratinous material. Peripheral lesion enhancement is seen after gadolinium administration.
Figure 5 a–d
Figure 5 a–d
LCH in a 34-year-old man referred with mild, intermittent testicular pain, no palpable mass and negative serum tumoral markers. Sagittal US image (a) of the left testis reveals sub-centimeter-sized hypoechoic intratesticular nodules (arrows). Sagittal color Doppler US image (b) of the right testis shows multiple hypoechoic lesions (yellow arrows) of few mm in diameter, some with vascularity (white arrow). Axial T2-weighted image (c) depicts hypointensity of the testicular nodule (arrow). Sagittal contrast-enhanced T1-weighted image (d) shows lesion enhancement (arrows).
Figure 6 a–c
Figure 6 a–c
Testicular adrenal rest tumors in a young man with congenital adrenal hyperplasia. Transverse sonographic image (a) including both testes demonstrates small, bilateral, mainly hypoechoic intratesticular mass lesions (arrowheads). T2-weighted images in transverse (b) and coronal (c) planes show multiple, bilateral intratesticular masses of low signal intensity (arrowheads).
Figure 7 a–d
Figure 7 a–d
Left traumatic intratesticular hematoma in a 54-year-old man. Transverse T2-weighted image (a) depicts slightly hyperintense left testicular lesion (arrow), surrounded by a low signal intensity rim. The mass (arrow) appears hyperintense on both T1-weighted (b) and fat-suppressed T1-weighted (c) images. Absence of contrast enhancement on fat-saturated contrast-enhanced T1-weighted image (d) confirms benign nature of the lesion (arrow).
Figure 8 a–c
Figure 8 a–c
MRI findings suggestive for the diagnosis of segmental testicular infarction. Sagittal grayscale sonographic image (a) depicts an ill-defined, hypoechoic intratesticular mass lesion. Sagittal T2-weighted (b) and contrast-enhanced T1-weighted (c) images show triangular lesion shape and absence of contrast enhancement (long arrow).
Figure 9 a–e
Figure 9 a–e
Bilateral testicular fibrosis. Transverse sonographic image (a) including both testes demonstrates bilateral hypoechoic intratesticular masses, with ill-defined margins (arrowheads). Transverse T1-weighted (b), T2-weighted (c), contrast-enhanced T1-weighted (d) images and ADC map (e). The lesions have very low signal intensity on both T1-weighted and T2-weighted images and do not enhance after gadolinium administration, findings suggestive for the presence of fibrous tissue. Restricted diffusion within the masses is also related to the presence of fibrous component.
Figure 10 a–c
Figure 10 a–c
Bilateral TB epididymo-orchitis in a 70-year-old man. Sagittal T2-weighted image (a) depicts testicular enlargement and multiple, nodular, mainly hypointense mass lesions, involving both the testis and the head of the epididymis. On transverse T1-weighted (b) and contrast-enhanced T1-weighted (c) images, lesions have signal intensity slightly higher than that of normal testis and enhance strongly and heterogeneously.
Figure 11
Figure 11
Adenomatoid tumor arising from the tail of the left epididymis. Coronal contrast-enhanced T1-weighted image depicts a small, sharply demarcated left paratesticular mass (arrow). The lesion enhances less than the normal testes. A small amount of hydrocele (arrowhead) is detected ipsilaterally.
Figure 12 a, b
Figure 12 a, b
Bilateral paratesticular leiomyomas in a 60-year-old man, confirmed pathologically after tumor enucleation. Sagittal T2-weighted (a) and contrast-enhanced T1-weighted (b) images depict bilateral paratesticular masses (long arrows). The lesions are well-delineated, hypointense on T2-weighted image, with mild, delayed contrast enhancement.
Figure 13 a, b
Figure 13 a, b
Fibrous pseudotumor. Color Doppler US image (a) shows a hypoechoic right paratesticular mass, without detectable vascularity. Coronal T2-weighted image (b) depicts paratesticular mass lesion (arrowhead), with very low signal intensity, suggestive for the presence of fibrous tissue.

References

    1. Appelbaum L, Gaitini D, Dogra VS. Scrotal ultrasound in adults. Semin Ultrasound CT MR. 2013;34:257–273. doi: 10.1053/j.sult.2013.01.008. - DOI - PubMed
    1. Dogra VS, Gottlieb RH, Oka M, Rubens DJ. Sonography of the scrotum. Radiology. 2003;227:18–36. doi: 10.1148/radiol.2271001744. - DOI - PubMed
    1. Basu S, Howlett DC. High-resolution ultrasound in the evaluation of the non acute testis. Abdom Imaging. 2001;26:425–432. doi: 10.1007/s002610000169. - DOI - PubMed
    1. Baker LL, Hajek PC, Burkhard TK. MR imaging of the scrotum: pathologic conditions. Radiology. 1987;163:93–98. doi: 10.1148/radiology.163.1.3823465. - DOI - PubMed
    1. Cramer BM, Schlegel EA, Thueroff JW. MR imaging in the differential diagnosis of scrotal and testicular disease. Radiographics. 1991;11:9–21. doi: 10.1148/radiographics.11.1.1996400. - DOI - PubMed