Clinical Trial
. 2018 Oct 1;128(10):4588-4603.
doi: 10.1172/JCI121960. Epub 2018 Aug 9.

Circulating and intrahepatic antiviral B cells are defective in hepatitis B

Affiliations
Clinical Trial

Circulating and intrahepatic antiviral B cells are defective in hepatitis B

Alice R Burton et al. J Clin Invest. .

Abstract

B cells are increasingly recognized as playing an important role in the ongoing control of hepatitis B virus (HBV). The development of antibodies against the viral surface antigen (HBV surface antigen [HBsAgs]) constitutes the hallmark of resolution of acute infection and is a therapeutic goal for functional cure of chronic HBV (CHB). We characterized B cells directly ex vivo from the blood and liver of patients with CHB to investigate constraints on their antiviral potential. Unexpectedly, we found that HBsAg-specific B cells persisted in the blood and liver of many patients with CHB and were enriched for T-bet, a signature of antiviral potential in B cells. However, purified, differentiated HBsAg-specific B cells from patients with CHB had defective antibody production, consistent with undetectable anti-HBs antibodies in vivo. HBsAg-specific and global B cells had an accumulation of CD21-CD27- atypical memory B cells (atMBC) with high expression of inhibitory receptors, including PD-1. These atMBC demonstrated altered signaling, homing, differentiation into antibody-producing cells, survival, and antiviral/proinflammatory cytokine production that could be partially rescued by PD-1 blockade. Analysis of B cells within healthy and HBV-infected livers implicated the combination of this tolerogenic niche and HBV infection in driving PD-1hiatMBC and impairing B cell immunity.

Keywords: B cells; Hepatitis; Immunology; Infectious disease; Tolerance.


Conflict of interest statement

Conflict of interest: NP is employed by F. Hoffmann-La Roche AG. MKM also receives collaborative research funding from Gilead Sciences Inc. and Immunocore and has served as a consultant/on advisory boards for F. Hoffmann-La Roche AG, Gilead Sciences Inc., Immunocore, Arbutus Biopharma Corp., and Janssen.

Figures

Figure 1
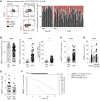
Figure 1. B cells specific for HBV surface antigen persist in chronic infection.
(A) Representative staining: HBsAg-specific B cells in a vaccinated HC identified using an AF488–HBsAg bait, compared with FMO. (B) Representative ELISpot well image: anti-HBs–secreting B cells in HBsAg bait sorted– and HBsAg bait–depleted cells from HBV-vaccinated HC (representative of n = 3). anti-HBs measured in supernatant by ELISA (IU/ml). (C) HBsAg-specific B cells (red bars; % of total CD19+CD20+) across the course of HBV vaccination in 2 healthy donors. Samples taken 2 weeks prior to first dose and 7 days after each dose (given 1 and 6 months after the initial dose). Dashed line represents serum anti-HBs titer (IU/ml) determined by ELISA. Red line delineates threshold level of 0.18 based on mean + SD of unexposed controls. (D) Frequency of HBsAg-specific B cells in unexposed HC (n = 24), HBV-HCV+ patients (n = 6), HBV-vaccinated HC (vac HC; n = 29), and patients with CHB (n = 84) identified using AF488–HBsAg bait staining. Red line delineates threshold of detection, as above. (E) Frequency of HBsAg-specific B cells plotted against HBsAg titer (IU/ml; n = 48). (F) Cross-sectional analysis showing the frequency of HBsAg-specific B cells at HBV-acute and HBV-resolved (res.) time points (n = 8). (G) Longitudinal analysis of HBsAg-specific B cells during acute-resolving infection. Frequencies plotted relative to viral load (dashed line; IU/ml), serum ALT (dotted line; IU/liter), and serological status (indicated by bars). (H) anti-HBs in supernatants from stimulated FACS-sorted HBsAg-specific B cells (n = 3 HBV-vaccinated HC; n = 4 patients with CHB). Number of cells ranged from 5 × 10³ to 1.2 × 10⁴ for HBV-vaccinated HC and 5 × 10³ to 1.7 × 10⁴ in patients with CHB. Representative plot for HBV-vaccinated HC is also shown in Supplemental Figure 1A. Error bars indicate mean ± SEM. P values were determined by Kruskal-Wallis test (ANOVA) with Dunn’s post hoc test for pairwise multiple comparisons (D), Spearman’s rank correlation (E); and Wilcoxon’s paired t test (F). **P < 0.005; ***P < 0.001; ****P < 0.0001.
Figure 2
Figure 2. atMBC are expanded in HBV infection and enriched in the HBsAg-specific compartment.
(A) Representative staining and cumulative data: HBsAg-specific MBC subsets (atMBC CD27CD21; actMBC CD27+CD21, cMBC CD27+CD21+; gated on CD45+CD19+CD3CD20+CD10) in HBV-vaccinated HC (n = 27) and patients with CHB (n = 73). Each bar represents an individual. Individuals are ordered by increasing age (range: HBV-vaccinated HC = 21–89 years; CHB = 23–71 years). (B) Summary plots comparing the frequencies of HBsAg-specific MBC subsets between HBV-vaccinated HC (n = 27) and patients with CHB (n = 73). (C) Frequency of atMBC in the global B cell compartment in HBV-vaccinated HC (n = 61) and patients with CHB (n = 96). (D) Frequency of cells with an atMBC phenotype in the global compared with HBsAg-specific compartment (n = 49 patients with CHB). (E) Cross-sectional analysis of global atMBC in HBV-acute (n = 13) and HBV-resolved (n = 20) HBV infection (F) Longitudinal analysis of atMBC during acute-resolving infection. Frequencies plotted relative to viral load (dashed line; IU/ml), serum ALT (dotted line; IU/liter), and serological status (indicated by bars). Error bars indicate mean ± SEM. P values were determined by Mann-Whitney t test (B, C, and E) and Wilcoxon’s paired t test (D). *P < 0.05; ****P < 0.0001.
Figure 3
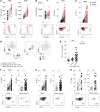
Figure 3. atMBC in CHB have altered T-bet expression and homing profiles.
Representative examples and cumulative data: expression of (A) T-bet on global atMBC and cMBC (%; n = 30) and (B) percentage of MBC subsets within T-bethi, T-betint, or T-betlo fractions (pregated on CD20+CD19+CD10; n = 15). Gates were drawn on total CD45+ lymphocytes, as shown. (C) Expression of CD11c (%; n = 24) on global atMBC and cMBC in patients with CHB. (D) Expression of CD11c (%; n = 10) and CXCR3 (mean fluorescence intensity [MFI]; n = 10) on T-bethi (black), T-betint (gray), or T-betlo (white) atMBC. (E and F) Expression of (E) CXCR5 (MFI; n = 33) and (F) CD80 (MFI; n = 30) on global atMBC and cMBC in patients with CHB. (G) Frequency of class-switched cells (IgMIgD) as a percentage of naive, cMBC, and atMBC (n = 39 patients with CHB). Error bars indicate mean ± SEM. P values were determined by Wilcoxon’s paired t test (A, C, E, and F) and Kruskal-Wallis test (ANOVA) with Dunn’s post hoc test for pairwise multiple comparisons (D and G). *P < 0.05; **P < 0.005; ****P < 0.0001.
Figure 4
Figure 4. atMBC express higher levels of inhibitory receptors.
(AC) Representative examples and cumulative data: expression of (A) BTLA (MFI; n = 16) and CD22 (MFI; n = 26); (B) FcyRII1B (MFI; n = 30) and FcRL5 (%; n = 83); and (C) PD-1 (%; n = 55) on atMBC and cMBC in patients with CHB. (D) Dimension reduction analysis visualized using tSNE identifying discrete populations of atMBC based on the expression profile CD21CD27 FcRL5+. PD-1 expression on B cells was concentrated within IgMIgD atMBC (purple cluster). tSNE analysis was performed on the expression data for the markers BAFF-R, IgD, CD21, CD80, CD10, CD11c, CD27, FcRL5, CD20, IgM, PD-1, CD38, and CD24 as measured by flow cytometry on CD19+ events concatenated from patients with CHB (n = 8) and HBV-vaccinated HC (n = 8). (E) Frequencies of PD-1+ atMBC stratified by viral load (IU/ml) (n = 10 with HBV DNA <2 × 10³; n = 31 with HBV DNA ≥2 × 10³) and compared with HC (HC; n = 37). (FH) Representative examples and cumulative data: paired analysis of marker expression on HBsAg-specific B cells (black) compared with global B cells (gray) from within the same patient with CHB and comparison of HBsAg-specific B cells in patients with CHB and vaccinated HC (white). Expression levels of (F) FcRL5 (%; n = 60 patients with CHB; n = 29 HBV-vaccinated HC), (G) PD-1 (%; n = 66 patients with CHB; n = 23 HBV-vaccinated HC), and (H) T-bet (%; n = 17 patients with CHB; n = 11 HBV-vaccinated HC). Error bars indicate mean ± SEM. P values were determined by Wilcoxon’s paired t test (AC; FH), Kruskal-Wallis test (ANOVA) with Dunn’s post hoc test for pairwise multiple comparisons (E), and Mann-Whitney t test for unpaired data (FH). *P < 0.05; **P < 0.005; ***P < 0.001; ****P < 0.0001.
Figure 5
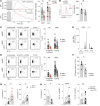
Figure 5. atMBC accumulating in CHB have impaired signaling and antiviral function.
(A) Representative flow cytometric analysis of Ca2+ influx (Fluo-4 AM; median fluorescence intensity) over time (seconds) in purified B cells after stimulation with F(ab′)2-IgG/IgA/IgM (anti-BCR; 50 μg/ml) or ionomycin (iono.) (1 μg/ml) (n = 10 patients with CHB). Basal fluorescence prior to stimulation is shaded gray. Summary plot: difference in MFI upon stimulation in cMBC and atMBC compared with baseline. (B) Expression of phosphorylated-BLNK (MFI) in global B cells after crosslinking with F(ab′)2-IgG/IgA/IgM for 30 seconds (anti-BCR; n = 8). Background fluorescence from paired stimulated control is shown in gray. (CD) Intracellular cytokine staining for (C) IL-6 and (D) TNF-α in atMBC and cMBC after stimulation with F(ab′)2-IgG/IgA/IgM and CD40L (anti-BCR; soluble CD40L [sCD40L]; n = 10 patients with CHB) or R848 (resiquimod; TLR7/8 agonist; 1 μg/ml; n = 35 patients with CHB) for 24 hours. Frequencies are presented minus paired unstimulated control. (E) Anti-HBs–secreting B cells in unexposed controls (n = 5), vaccinated HC (n = 7), and patients with CHB (n = 14), determined by ELISpot. SFC, spot-forming cells. (F) atMBC were FACS sorted (n = 7 HBV-vaccinated HC) and differentiated into plasma cells alongside a matched number of cMBC. Graph shows proportion of cells acquiring a plasma cell phenotype (CD45+CD19+CD3IgDCD38hiCD20CD27+CD138+), as determined by flow cytometry. (G) Ex vivo staining for annexin V on purified B cells, stratified by subset and by PD-1 expression, after stimulation with F(ab′)2-IgG and -IgM (1 μg/ml) and CD40L (0.5 μg/ml) for 7 days (n = 7). (H) Annexin V expression on B cells stimulated ± anti–PD-1 mAb (10 μg/ml) for 7 days (n = 7). (I) Intracellular staining for IL-6 on atMBC and cMBC stimulated as in G and H for 24 hours (n = 18). Frequency is presented minus paired unstimulated control. Error bars indicate mean ± SEM. P values were determined by Wilcoxon’s paired t test (AD, FI); and Kruskal-Wallis test (ANOVA) with Dunn’s post hoc test for pairwise multiple comparisons (E). *P < 0.05; **P < 0.005; ***P < 0.001; ****P < 0.0001.
Figure 6
Figure 6. PD-1hi atMBC preferentially localize in the HBV-infected liver.
(A) Representative staining and summary plot: frequencies of atMBC in paired IHL and blood samples (PBMC) from patients with CHB (10 HBV+ liver biopsies; 5 HBV+ liver resections) and uninfected controls (12 margins from HBV colorectal metastases [CRC margins]; control IHL). (B) Frequencies of atMBC in control liver samples (22 CRC margins; 12 pretransplant perfusates; 6 biopsies from livers with nonviral hepatitis) and HBV-infected liver (10 HBV+ liver biopsies; 1 perfusate from HBsAg+ liver; 2 perfusates from HBV-resolved livers). Ctrl, control. (C) Percentage of intrahepatic B cells with atMBC or cMBC phenotype within global T-bethi, T-betint, or T-betlo populations (n = 2 CRC; 3 HBV+ tissue; 1 healthy perfusate). (D) Expression of FcRL5 (n = 4 HBV+ infected liver; 12 CRC margins) and PD-1 (n = 12 HBV+ liver; 13 CRC margins) on intrahepatic atMBC and cMBC. (E) Comparison of PD-1+ atMBC in uninfected liver (%; n = 15 CRC margins) and HBV+ liver (n = 13). (F) Representative staining and frequency of HBsAg-specific B cells (% of CD19+CD20+) in HBV+ liver samples (n = 14) compared with uninfected controls (n = 4 CRC margins). (G) Frequencies of HBsAg-specific MBC subsets in 7 individual HBV+ liver samples (patient [pt.] 1 through pt. 7). Error bars indicate mean ± SEM. P values were determined by Wilcoxon’s paired t test (A and D) and Mann-Whitney t test (B, E, and F). *P < 0.05; **P < 0.005; ***P < 0.001.

Comment in

References

    1. Barouch DH, et al. Therapeutic efficacy of potent neutralizing HIV-1-specific monoclonal antibodies in SHIV-infected rhesus monkeys. Nature. 2013;503(7475):224–228. doi: 10.1038/nature12744. - DOI - PMC - PubMed
    1. Hangartner L, Zinkernagel RM, Hengartner H. Antiviral antibody responses: the two extremes of a wide spectrum. Nat Rev Immunol. 2006;6(3):231–243. doi: 10.1038/nri1783. - DOI - PubMed
    1. Shingai M, et al. Antibody-mediated immunotherapy of macaques chronically infected with SHIV suppresses viraemia. Nature. 2013;503(7475):277–280. doi: 10.1038/nature12746. - DOI - PMC - PubMed
    1. Hessell AJ, et al. Fc receptor but not complement binding is important in antibody protection against HIV. Nature. 2007;449(7158):101–104. doi: 10.1038/nature06106. - DOI - PubMed
    1. Lu LL, Suscovich TJ, Fortune SM, Alter G. Beyond binding: antibody effector functions in infectious diseases. Nat Rev Immunol. 2018;18(1):46–61. - PMC - PubMed

Publication types

Substances