. 2018 Aug 9;14(8):e1006357.
doi: 10.1371/journal.pcbi.1006357. eCollection 2018 Aug.

Flexible resonance in prefrontal networks with strong feedback inhibition

Affiliations

Flexible resonance in prefrontal networks with strong feedback inhibition

Jason S Sherfey et al. PLoS Comput Biol. .

Abstract

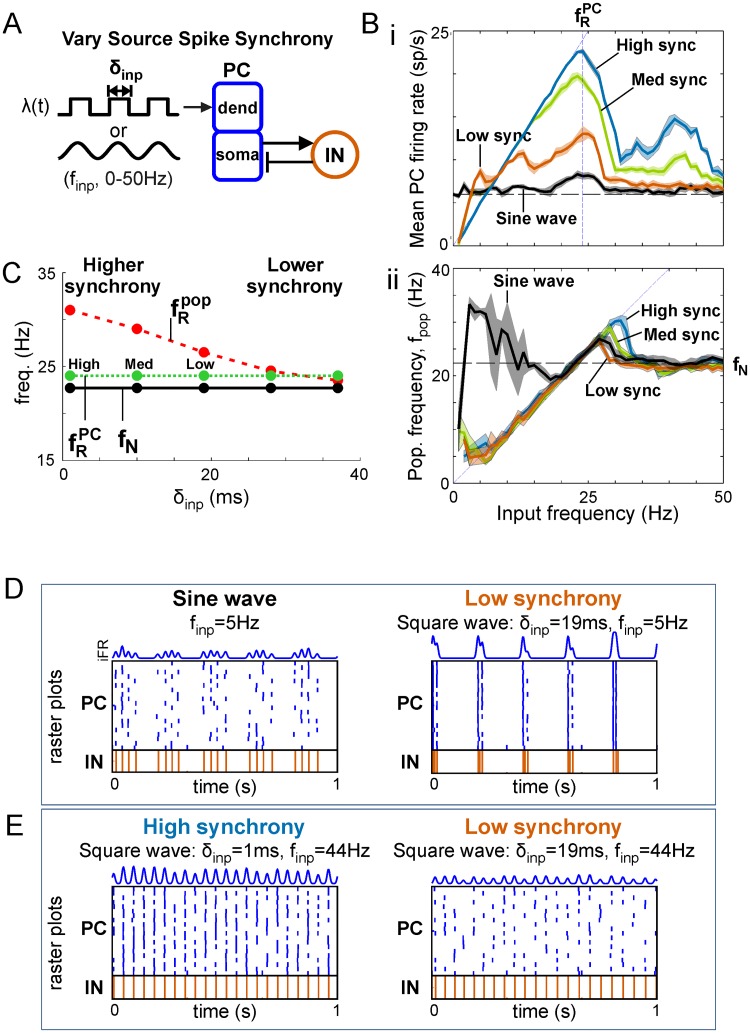
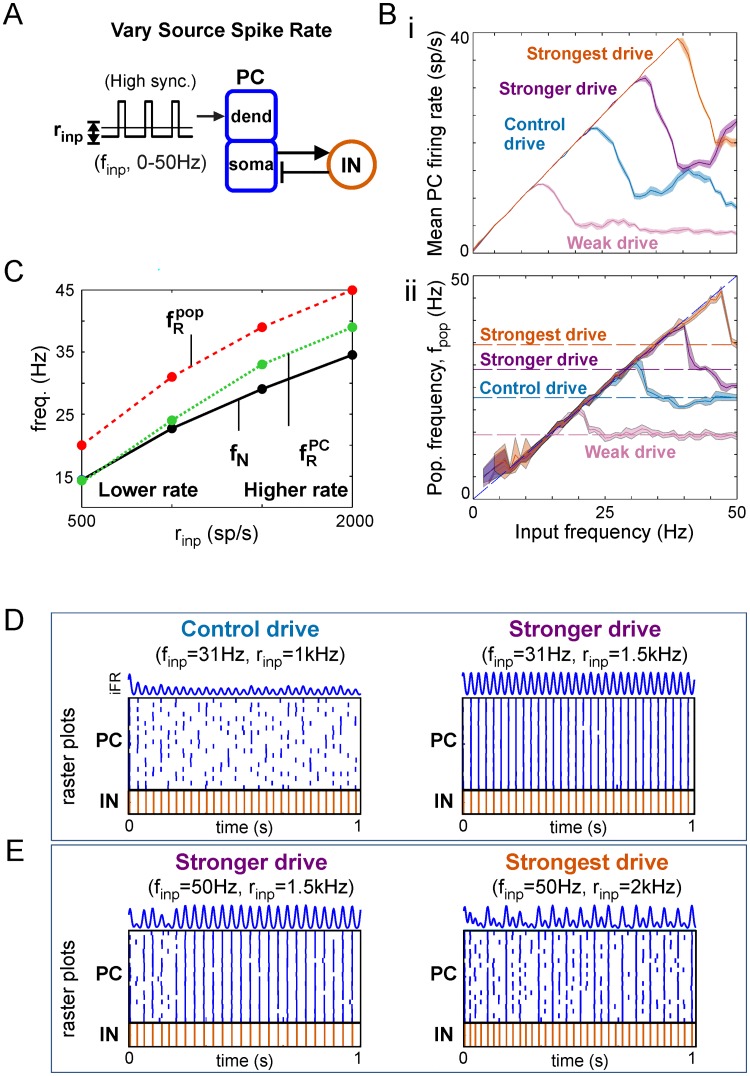
Oscillations are ubiquitous features of brain dynamics that undergo task-related changes in synchrony, power, and frequency. The impact of those changes on target networks is poorly understood. In this work, we used a biophysically detailed model of prefrontal cortex (PFC) to explore the effects of varying the spike rate, synchrony, and waveform of strong oscillatory inputs on the behavior of cortical networks driven by them. Interacting populations of excitatory and inhibitory neurons with strong feedback inhibition are inhibition-based network oscillators that exhibit resonance (i.e., larger responses to preferred input frequencies). We quantified network responses in terms of mean firing rates and the population frequency of network oscillation; and characterized their behavior in terms of the natural response to asynchronous input and the resonant response to oscillatory inputs. We show that strong feedback inhibition causes the PFC to generate internal (natural) oscillations in the beta/gamma frequency range (>15 Hz) and to maximize principal cell spiking in response to external oscillations at slightly higher frequencies. Importantly, we found that the fastest oscillation frequency that can be relayed by the network maximizes local inhibition and is equal to a frequency even higher than that which maximizes the firing rate of excitatory cells; we call this phenomenon population frequency resonance. This form of resonance is shown to determine the optimal driving frequency for suppressing responses to asynchronous activity. Lastly, we demonstrate that the natural and resonant frequencies can be tuned by changes in neuronal excitability, the duration of feedback inhibition, and dynamic properties of the input. Our results predict that PFC networks are tuned for generating and selectively responding to beta- and gamma-rhythmic signals due to the natural and resonant properties of inhibition-based oscillators. They also suggest strategies for optimizing transcranial stimulation and using oscillatory networks in neuromorphic engineering.


Conflict of interest statement

The authors have declared that no competing interests exist.

Figures

Fig 1
Fig 1. Strong feedback inhibition produces natural oscillation in PC/IN network.
(A) Diagram showing feedforward excitation from external (independent) Poisson spike inputs to 20 excitatory principal cells (PCs) receiving feedback inhibition from 5 inhibitory interneurons (INs). See Methods for details. (B) Simulations showing the network switching from an asynchronous to oscillatory state with natural oscillation as the strength of feedback inhibition is increased.
Fig 2
Fig 2. Input frequency-dependent output response profiles.
(A) Diagram of PFC network receiving sinusoidal or high-synchrony square wave input. (B) Response to high-synchrony input. (i) Mean firing rate (FR) profile for PC (blue) and IN (red) populations. Horizontal dashed lines mark the FR response to equal-strength asynchronous input. The diagonal dashed (1:1) line marks where firing rate equals input frequency. (ii) Population frequency profile for PC and IN populations. Peak population frequency occurs at the input frequency maximizing IN activity (i.e., feedback inhibition). Horizontal dashed lines mark the natural frequency in response to asynchronous input. (C) FR profile for PC (blue) and IN (red) populations in response to sinusoidal input. Dashed lines mark the same features as in (Bi). (D) Spike rasters and PC iFR responses to oscillatory inputs at the PC and IN firing rate resonant frequencies. (E) Spike rasters and PC iFR responses to inputs producing network responses paced by internal time constants: (left) asynchronous input, (right) high-frequency input.
Fig 3
Fig 3. Frequency-dependent suppression of asynchronous activity.
(A) Diagram showing a target PC population, PCT, driven by medium-synchrony oscillatory input in competition with an asynchronously-driven distractor PC population, PCD. (B) Dependence of distractor suppression on target input frequency. (i) Time-averaged firing rates (FRs) of PCT (blue) and PCD (black) populations. As expected, PCT FR peaks at the r¯PC-resonant frequency. PCD responds at the FR expected given asynchronous input (horizontal black line, labeled “natural response”) when target input frequency is below the natural frequency (vertical black line) or far above fPCR; it is suppressed at intermediate frequencies. (ii) PCT population (output) frequency versus the input frequency to PCT. As expected, PCT fpop peaks at the fpop-resonant frequency. Importantly, whenever fpop exceeds the natural frequency (horizontal black line), PCD FR is suppressed; maximal suppression of PCD occurs when PCT fpop is maximal and not when PCT FR peaks in (i). (C) Example simulation with continuous suppression of the distractor pathway by a target pathway driven with a fpop-resonant input. On every cycle, the more rapidly oscillating target population engages the INs before the distractor reaches threshold.
Fig 4
Fig 4. Dependence of response profiles on input synchrony.
(A) Diagram of PFC network receiving variable-synchrony square wave or sinusoidal inputs. (Bi) Firing rate profile for PC populations given oscillatory inputs with different degrees of synchrony. (Bii) Population frequency profile for inputs with different degrees of synchrony. Horizontal dashed line marks the natural frequencies for each degree of synchrony. (C) The effect of input synchrony on resonant frequencies. Maximum population frequency (at the IN firing rate res. freq.) increases with input synchrony. (D) Spike rasters and PC iFR responses showing the nesting of natural oscillations generated by a local network on the depolarizing phase of a lower-frequency external driving oscillation with sine wave (left) or square wave (right) rate-modulation. (E) Spike rasters and PC iFR responses showing that weaker firing rate resonance at the first harmonic (i.e., smaller bump at finp = 44Hz in Bi, blue curve) occurs for high synchrony (left) but not low synchrony (right) oscillatory inputs.
Fig 5
Fig 5. Dependence of response profiles on input strength.
(A) Diagram of PFC network receiving variable-strength high-synchrony square wave input. (Bi) Firing rate profile for PC populations given oscillatory inputs with different strengths. (Bii) Population frequency profile for inputs with different strengths. Horizontal dashed lines mark the natural frequencies for each drive strength. (C) The effect of input strength on natural and resonant frequencies. (D) Spike rasters and PC iFR responses showing the typical case of stronger input driving more output: (left) weaker input, less output, (right) stronger input, more output. (E) Spike rasters and PC iFR responses showing special case of resonance at first harmonic enabling a weaker input to drive more output: (left) weaker input, more output, (right) stronger input, less output.
Fig 6
Fig 6. Neuromodulation of firing rate resonance in PC/IN network.
(A) Diagram showing an external sinusoidal Poisson input to the dendrites of 20 two-compartment principal cells (PCs) receiving feedback inhibition from a population of 5 fast spiking interneurons (INs). PC and IN models include conductances found in prefrontal neurons (see Fig 7A for details). (B) Input frequency-dependent firing rate profile showing resonance at a beta2 frequency. (C) The effect of knocking out individual ion currents on the resonant input frequency maximizing firing rate outputs. Removing hyperpolarizing currents (-Ks, -KCa) increased the resonant frequency, while removing depolarizing currents (-NaP) decreased the resonant frequency or (-Ca) silenced the cell altogether (see Fig 7A for ion channel key). Error bars indicate mean ± standard deviation across 10 realizations; only -KCa had a non-zero standard deviation (i.e., values that differed across realizations). (D) The effect of hyperpolarizing and depolarizing injected currents, Iapp, on the resonant frequency mirrored the effect of knockouts on excitability.
Fig 7
Fig 7. Architecture of output networks.
(A) Diagram showing feedforward excitation from external independent Poisson spike trains to the dendrites of 20 two-compartment (soma, dend) principal cells (PCs) receiving feedback inhibition from a population of 5 fast spiking interneurons (INs). All PC and IN cells have biophysics based on rat prelimbic cortex (Ion channel key: NaF = fast sodium channel; KDR = fast delayed rectifier potassium channel; NaP = persistent sodium channel; Ks = slow (M-type) potassium channel; Ca = high-threshold calcium channel; KCa = calcium-dependent potassium channel). (B) Diagram showing a rhythmically-driven target population of PC cells (PCT) competing with an asynchronously-driven distractor population (PCD) through a shared population of inhibitory IN cells.
Fig 8
Fig 8. Input network activity.
(A) Asynchronous Poisson input with (i) constant instantaneous rate rinp and (ii) raster for 100 input cells with rinp = 10 sp/s (equivalent to 1 input cell with rinp = 1000 sp/s). (B) Poisson inputs with oscillatory instantaneous rate-modulation. (i) Instantaneous rate modulated by low synchrony square wave, parameterized by pulse width δinp and inter-pulse frequency finp. (ii) raster plot produced by square wave input. (iii) High synchrony, square wave rate-modulation. (iv) sine wave modulation, parameterized by frequency finp. (C) Output measures for the PC/IN network. (i) Diagram of a PC/IN network receiving an input from (B). (ii) Plots showing the instantaneous firing rate (iFR) computed for each population using Gaussian kernel regression on the spike raster. Time-averaged firing rates are defined by the mean iFR for each population. (iii) Power spectrum showing how population frequency is defined by the spectral frequency with peak power in the iFR.
Fig 9
Fig 9. Cartoon profiles of time- and population-averaged PC firing rates in response to different types of oscillatory inputs.
(A) Response to sinusoidal drive. (i) Weak input produces a band-pass filter (BPF) response with spikes driven by near-resonant frequencies and only a fraction of cells spiking on every cycle. (ii) Strong input produces an all-pass response with a resonant peak. B) Response to fixed-mean square wave drive. (i) Weak input produces a low-pass filter (LPF) response with spikes driven by all frequencies below a resonant peak and all cells spiking on every cycle. (C) Response to fixed-amplitude square wave drive. (i) Weak input produces a high-pass filter (HPF) response. (ii) Strong input produces an all-pass response without a well-defined resonant peak.

References

    1. Whittington MA, Traub RD, Jefferys JG (1995) Synchronized oscillations in interneuron networks driven by metabotropic glutamate receptor activation. Nature 373: 612–615. 10.1038/373612a0 - DOI - PubMed
    1. Randall FE, Whittington MA, Cunningham MO (2011) Fast oscillatory activity induced by kainate receptor activation in the rat basolateral amygdala in vitro. The European Journal of Neuroscience 33: 914–922. 10.1111/j.1460-9568.2010.07582.x - DOI - PMC - PubMed
    1. Roux F, Wibral M, Mohr HM, Singer W, Uhlhaas PJ (2012) Gamma-band activity in human prefrontal cortex codes for the number of relevant items maintained in working memory. The Journal of Neuroscience: The Official Journal of the Society for Neuroscience 32: 12411–12420. 10.1523/JNEUROSCI.0421-12.2012 - DOI - PMC - PubMed
    1. Buschman T, Denovellis E, Diogo C, Bullock D, Miller E (2012) Synchronous Oscillatory Neural Ensembles for Rules in the Prefrontal Cortex. Neuron 76: 838–846. 10.1016/j.neuron.2012.09.029 - DOI - PMC - PubMed
    1. Buzsáki G (2002) Theta Oscillations in the Hippocampus. Neuron 33: 325–340. 10.1016/S0896-6273(02)00586-X - DOI - PubMed

Publication types

MeSH terms